BCH Cash BullishCrypto Altcoins
#CryptoWhale100Billion Alt Coin Analysis:
#CryptoWhale100Billion Alt Coin Analysis: BCH
My Analysis shows that BCH show a strong buy after hitting a low of $98 and bounced up to $103. The resistant area we can see BTC running back all the way up to $116 and breaking out higher.
RSI showing a good bull move from buying big buys. We can see a swing-up trend in the next few weeks. Small sales showing on the MACD. BCH has been trending sideways in this area for some time. Whales may accumulate and push it to the upper side.
Shoot me a message with your Technical Analysis to see your thoughts and trading strategies.
#CryptoWhale100Billion
Press The Thumbs Up and send me a message below about your idea on KNC will hit.
Thank You for the support!
Below are some Previous charts links I've written in the pass for Reference.
Bchusdt
✴️ Bitcoin Cash Major Breakout, Looks Good To Me!Here we are again with the same conditions as visited before in the Binance Coin and Cardano charts... Bullish consolidation.
I was sharing in the BNBUSDT article yesterday the fact that corrections tend to become felt in crypto.
Retraces can happen slowly which means that the current consolidation can turn into a retrace but as for corrections, they go down fast and strong as soon as a resistance level is hit.
This type of action we are seeing with Bitcoin Cash (BCHUSDT) kinds of breeds doubt and uncertainty... But, as shared in the BTC CME Futures GAPs article, Who's selling ?
Bitcoin Cash looks good...
After the break above EMA100, we have 6 days of consolidation. This consolidation is taking place above EMA10 and all the rest.
The RSI is super strong.
As long as the consolidation continues to be this strong, our bullish bias remains intact and we aim for the next target... $150 followed by $170 and so on.
You can read below to expand on this trade idea.
Three relevant articles mentioned are:
1) ✴️ Binance Coin | New Money Enters The Market, BULLS Confirmed!
2) 🅱️ BTC CME Futures GAPs Points To $35K, Who's Selling? | Go UP!
3) 🅱️ (₿) The Real Meaning Of A Bitcoin "Overbought" Daily RSI...
Thanks a lot for the support.
Namaste.
DINO Coins will OUTPREFORM BTC! (And no I don't like BCH)DINO Coins will OUTPREFORM BTC! (And no I don't like BCH but the Charts NEVER lie.)
Sitting above Daily 200 EMA with strong momentum still.
Euphoria is entering the market.
KEEP AN EYE ON DINOS!
This is the 3rd Example of 2x plays that can possibly play out by Mid FEB!
ENTRY:
100-125$ and HOLD
SL open or 25-30% of DCA Entry.
TP 1/8 50%
1/8 75%
1/2 100%
Remaining runner 150%
Signs why Below:
Buy above 4h 200 EMA
(With Smaller Bullish patterns)
Confirmed Breakout
(Look at RSI , Trendlines , Volume )
Look for catalyst News
(Anything that rehypes the shitcoin, or it's bluechip chain)
Buy SPOT ONLY and HODL!
Swing until 2x profit, or weakness. no SL but if needed a loss of 50% would be a SL
FIND THIS IN OTHER SHITCOINS AS WELL!
PLAY THEM ALL
BTW there is an order to this, I will not share it, you will need to DYOR.
but this is a prime example which will likely 2x by MID Feb
✴️ Bitcoin Cash Strong Breakout Is Only The BeginningA very strong breakout... Bitcoin Cash grew 30% in just 10 days... Here is the previous chart (2-Jan)
Looking at the weekly timeframe, this is only the beginning.
Last week BCHUSDT was still trading above EMA10, just this week it moved above this level, telling us that the bullish wave is just beginning.
EMA50 is sitting at 191 so we have a long way to go, up.
The next target is set at 150 for an additional 27% from the current price.
A peak for this wave can be hit at 189 for an additional 60%.
I say additional because we've been tracking this pair since it was at 100... Now we sit back, relax, watch and wait... With sell orders placed.
Namaste.
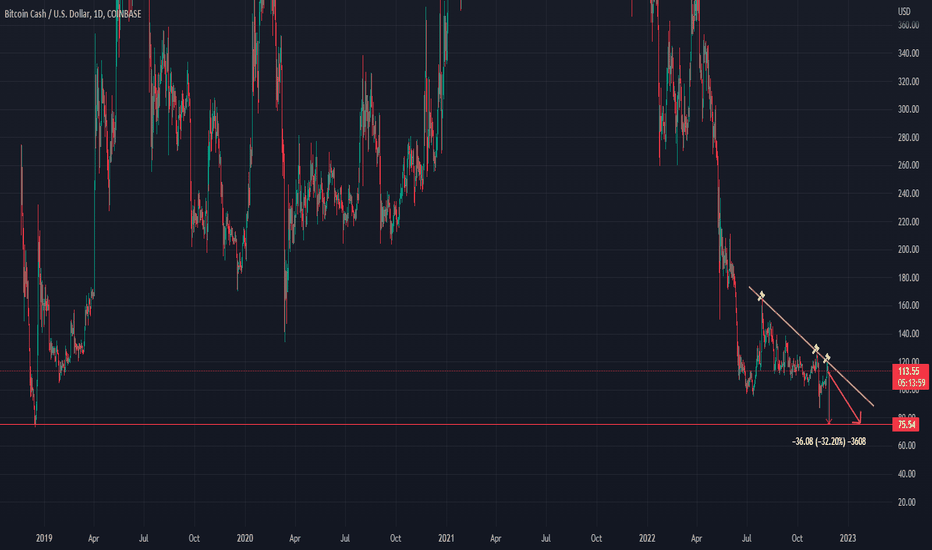
BCHUSD 30 % dump comingAs the bear market continues , the price can't break the resistance and it remains in the downtrend.
We expect 30 % dump before any significant bounce. If it happens BCH would drop to 75 $ which are lows from December 2018.
It also likely that we will see price lower than 75 $ in this bear market.
Any bounce probably will be a short lifted and the price eventually will go down.
Good luck
Current waveIf the current wave can break through the previous ceiling area at $104.6, we can expect price growth to continue up to the ceiling of the main descending channel at $110.4. But if the price goes back below the $100 range due to selling pressure, a retest of the $95 support is likely. In general, in the daily time frame, we expect the range trend to continue.
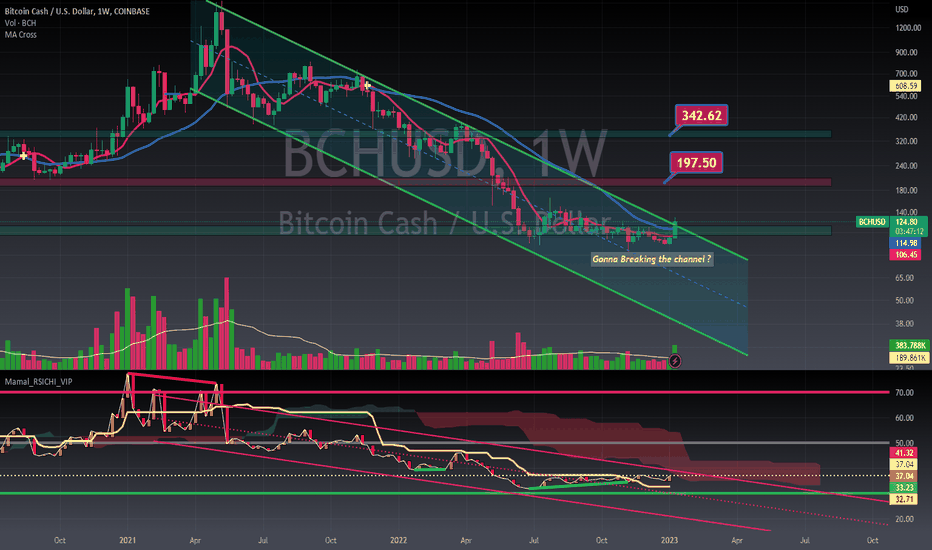
can BITCOIN break the channel resistance to the upside? 🚀Hello 🐋
Based on the chart, the price is close to the channel resistance area and stick in the range zone (parallel channel) ✔️
if
the price doesn't break the support zone to the downside, we will see more gain, at least to our upper trend line resistances 💣🚀
otherwise
we can see more correction to lower support level ❌🧨
Please, feel free to share your point of view, write it in the comments below, thanks 🐋
Bitcoin Cash Lags Behind But Not For 10X Long (85% Possible)We are seeing how Bitcoin Cash (BCHUSDT) is lagging behind some other altcoins but we believe this won't continue to be true for long.
The early/mid November shake-out has been completed and what follows is a bullish jump.
Today BCH moves above EMA10 after multiple days of consolidation.
The RSI is still weak but the short-term bias is pointing up.
The easy target is set at 20% or $133.
The next target on a higher high is $208.
We are active with 10X on this one.
You can find more high-risk lev. trades in the "Related Ideas" below.
Thank you for reading.
Namaste.
BCH/USD 1DAY UPDATE BY CRYPTO SANDERSHello, welcome to this BCH/USDT 1DAY chart update.
I have tried to bring the best possible outcome to this chart.
CHART ANALYSIS:-Bitcoin cash (BCH) raced to a one-week high on Wednesday, despite cryptocurrency markets mostly trading lower.
Following a low of $103.09 on Tuesday, BCH/USD surged to an intraday peak of $109.09 earlier in today’s session.
The move saw BCH hit its highest point since November 8, when the token was trading close to a high of $120.00.
As can be seen from the chart above, today’s high saw bitcoin cash move closer to a key resistance level of $110.00.
The 14-day relative strength index (RSI) also rose higher, with the index breaking out of a ceiling of its own.
Currently, the index is tracking at 46.52, which is above the aforementioned ceiling of 45.00.
This is not a piece of financial advice.
Hit the like button if you like it and share your charts in the comments section.
Thank you
Coinbase to delist Bitcoin Cash (BCH) from Coinbase Wallet last chart
Coinbase to delist Bitcoin Cash (BCH), Ethereum Classic (ETC), XRP (XRP), and Stellar (XLM) from Coinbase Wallet!
My price targets:
BCH/USDT short
Entry Range: $108 - 113
Price Target 1: $88
Price Target 2: $79
Price Target 3: $70
Stop Loss: $129
Bitcoin Cash Strong | Daily & Weekly TimeframesIt may look weak but it isn't...
Trading above EMA50 is very strong for the bulls.
We even have a bullish cross forming for Bitcoin Cash vs Tether (BCHUSDT) between EMA10 and EMA50.
On the weekly timeframe, BCHUSDT is now trading above EMA10 after 4.5 months of sideways (consolidation)...
After consolidation comes the bullish break.
Namaste.
Bitcoin Cash | Not Ready, Not yet; Potential For LowerYesterday Bitcoin Cash (BCHUSDT) tried and failed to move above EMA10 and EMA21.
We see this rejection coupled with high bear volume.
Today we are seeing prices growing below EMA10; bearish growth.
This is bad news as EMA10 is our main indicator to gauge the short-term potential of any cryptocurrency trading pair.
We can also see EMA50 or $110 as a strong barrier, this is the level to break for positive CHANGE.
Any trading below $104 and we can expect lower prices...
Targets: $95 is possible but even $80 is on the cards and lower...
Let's wait for the bottom!
After we hit bottom, we definitely will have long-term growth... That's the meaning of bottom, it can't go lower and this will be set in the next few weeks, maximum a few months.
See the related trade ideas for more.
Remember, I am always grateful for your continued support.
Namaste.
#BCH/USDT 4Hr UPDATE Hello, welcome to this BCH/USDT 4Hr chart update by CRYPTOSANDERS.
I have tried to bring the best possible outcome to this chart.
Show some support, hit the like button, and follow and comment in the comment section. this motivates me to bring this kind of chart analysis on a regular basis.
CHART ANALYSIS:-Bitcoin cash (BCH) raced to a one-week high on Wednesday, despite cryptocurrency markets mostly trading lower.
Following a low of $103.09 on Tuesday, BCH/USD surged to an intraday peak of $109.09 earlier in today’s session.
The move saw BCH hit its highest point since November 8, when the token was trading close to a high of $120.00.
As can be seen from the chart above, today’s high saw bitcoin cash move closer to a key resistance level of $110.00.
The 14-day relative strength index (RSI) also rose higher, with the index breaking out of a ceiling of its own.
Currently, the index is tracking at 46.52, which is above the aforementioned ceiling of 45.00.
This is not a piece of financial advice.
Hit the like button if you like it and share your charts in the comments section.
Thank you
#BCHUSDT Sideways Channel ($100-$150)Trade setup: Trading in a Sideways Channel ($100-$150). Swing trader: trade the channel (Enter near $100 support and Exit near $150 resistance). Trends remain bearish but $100 support area could be a swing entry point for a riskier trade setup; keep a tight stop loss (~$95). (set a price alert)
Trend: Neutral on Short- and Medium-Term basis and Downtrend on Long-Term basis.
Momentum is Mixed as MACD Line is above MACD Signal Line (Bullish) but RSI ~ 50 (Neutral).
OBV (On Balance Volume): is flat, indicating that volume on Up days is equal to volume on Down days. Hence, demand from buyers and supply from sellers are in equilibrium
Support and Resistance: Nearest Support Zone is $100. The nearest Resistance Zone is $150, then $200.


