CONTINUATION BEARISH PATTERNSBearflag:is a sharp,strong volume decline,several days of sideways to higher price action on much weaker volume followed by a second huge decline with a strong volume.Target is a NEW LOW
Target: for a bearflag pattern is derived by height of the flag pole(ex if this height is 5%) the decline target for breakdown will be 5%
Bearish Pennant:this pattern is bearish in nature and indicates that the current downtrend in price may continue.This pennant it s appear after a drop in price which will looks like a triangular flag as the price moves sideways .This slowly makes lower highs and higher lows which will confirm the bearish price action
The downtrend continues with another identical-sized fall in price so here we have an oportunity for short trade
Rising wedge:is a bearish pattern that begins wide at the bottom and contracts as prices move higher and the trading range narrows.In Contrast to symmetrical triangle which have no definitive slope and no bullish or bearish bias rising wedges definitely slop up and have a bearish bias(in the final is a breakdown from this wedge)
If we put this pattern at the continuation category the rising wedge will still slope up but the slope will be against the prevailing downtrend.
The final break of support indicates that the forces of supply have finally won out and lower prices are likely.There are no measuring techniques to estimate the decline.
Bearishpattern

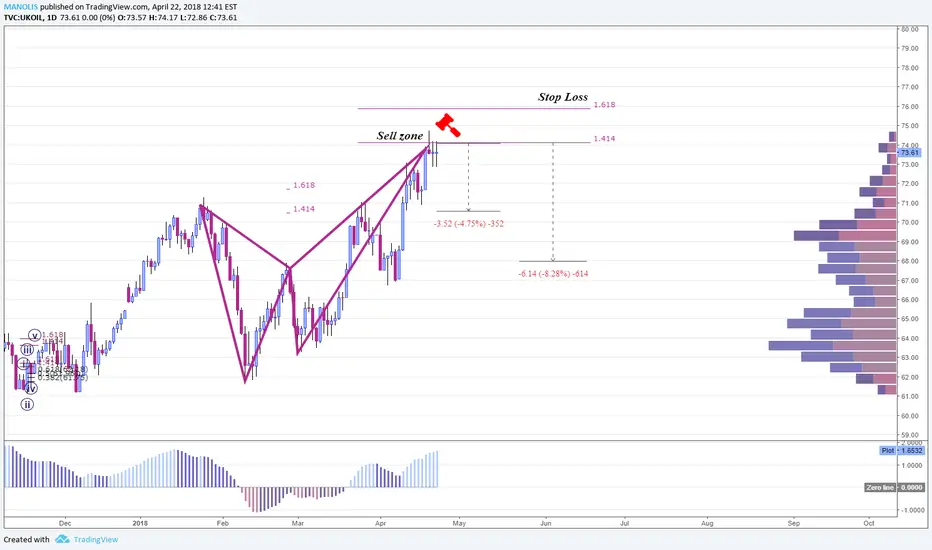
Bear ABCD Patternhere on the Brent OIL we have a Bearish AB=CD pattern. it is an 886 "C" point of the retrace of AB and it is a BC Projection of 1.13 and the ABC extension is completed nearly on top of the BC projection as it should! we shall see what happens!

GBPNZD is Forming BEARISH SHARK - Potential for Reversal!!Hey Everyone,
GBPNZD is forming HARMONIC PATTERN - BEARISH SHARK on H1 Chart with Overbought ratios
and it's expected to reverse,
and Hence we'll be shorting GBPNZD with these preferences,
GBPNZD - SELL NOW
STOP LOSS - 1.94672
TARGET1 - 1.92368
TARGET2 - 1.91389
More updates will be posted under this thread,
have any doubts? then, let us know in the comment section below
and make sure to give this analysis a Thumbs UP +_+

Bearish BatSell US Index as we notice a bearish bat pattern targeting the lower limit of the ascending channel.

EURNZD: Bearish Bat PatternA short opportunity might be coming the next days at FX:EURNZD . Signs for a good opportunity are, that the D point of the formation is right in a strong S&R zone. The potential target 1 is above and target 2 is right in lower S&R zones. Also the price action showed some very steep bullish moves the last days and RSI in H12 is already 74 which indicates the price is ready for bearish correction. Potential targets give a RR of 1:2 and 1:3.5.
Look for price reversal signals in entry zone at point D.

USDCAD is Forming BEARISH BAT | Ahead OF BOC -CPI Release!! Hey Everyone,
Today, all Eyes are on Bank of Canada Consumer Price Index Core E.T 2.22M
and at the moment Initial expectation is Hawkish for CAD (future updates will be posted)
currently as per our Technical side USDCAD is Forming a Bearish BAT on 240M Chart
price is not that Overbought but according to H1 Chart it is slightly Overbought
and hence this trade complies with 60/40 Percent chance to reach our Targets
before crossing the stop level,
(Invest low to moderate amount)
For now let's SELL USDCAD with these preferences,
SELL LIMIT - 1.32630
STOP LOSS - 1.33568
TARGET1 - 1.31078
TARGET2 - 1.29481
(You can SELL at CMP only 9 PIPS Difference)
and remember to stay active during the news release as we might
update or adjust our stops or targets accordingly
GOODLUCK with this particular one,
More updates will be posted under this thread,
have any doubts? then, let us know in the comment section below
and make sure to give this analysis a Thumbs UP +_+

$DASH , Saved or Sell Off
Weekly
Looking at our highest timeframe we see price has been in an aggressive downtrend since forming our all-time high back in March of 2017. Stochastic RSI showing momentum continuing towards the downside, price making it’s way towards our last major support if we do not hold at this level expect a drop towards 2750000 satoshis.
Daily
Shifting over to our pattern timeframe we see price respecting a minor downtrend inside of our major downtrend. Lower high formed recently at our 4350000 satoshis, expecting a lower low to form near our 3500000 zone. A daily close above 4350000 activates our trade, however if we close below 4000000 expect a drop towards 3500000.
4Hour
Finally looking over at our trigger timeframe we see price has broke out of its small downtrend and is currently testing for support. A close below our blue line and expect a drop towards 3500000, however a 4hour close above 4100000 indicates support has been found.
Conclusion
Wait For A Daily Close Above 4100000

Gbpusd: Bat pattern:bearish 1HHello, here we just got a broke under the support, from preivous swing.
we got a nice litlle Bat pattern.
Complete D: 0.886.
Target 1: 1.40515
Target 2:1.40362
Stop loss:1.40867


Dow Jones looking bearishThis chart of the Dow Jones Inustrial Average does not bode well for the shot term future. Fact that it has dipped below its 50 day average , and the low close bar of February 8th continues to signal that this market wants to push further down. I don't want to be the doom and gloom guy, I just read it like I see it. Expect more bearish price action in the coming days.

GBPNZD H1 Bearish Gartleyit gonna melt hard so put a trade and get some good pips.
if you find this analysis useful then please like and comment ;)

USD/CAD Bearish "5-0" pattern.Thought it was only right since I published AUD analysis this morning I publish CAD as well enjoy :)
A bearish 5-0 pattern formed on the daily chart. This pattern is also supported by demand zones on both the Daily and Weekly timeframe (only daily demand/supply present on the chart as overlapped).
Extended target PT = 1.21527
Happy trading :)
Brad.

A Clear H&S in CAG 40A clear pattern trade
We see a clear H&S and French public sector workers also went on strike on Tuesday against President Emmanuel Macron’s plans to cull jobs and toughen pay conditions, forcing airlines to cancel hundreds of flights and disrupting school activities. At this moment the CAG40 is being supported to protect investors, this can't go on. We need to see a price adjustment. Strike notices were lodged in schools, hospitals, airports and government ministries over plans to ax 120,000 jobs, freeze pay and reduce sick leave compensation.
in my opinion, there is a good chance this H&S will be completed in the next 2 days, both Technical and fundamental
Entry: Fib.78.2
Target:
Move stop-loss:

AUDUSD - Long / Short OpportunityAUDUSD - Long / Short Opportunity
1W Timeframe
Week Trade #1
This week looking for a BUY / SELL opportunity for this pair for a total target of 182.1 pips.
With the Pivot Point @ 0.8009 and the Psychological Level of 0.8000 holding, along with remaining well above 0.7965 support:
Phase 1 Tentative:
BUY Entry Market Order @ 0.80236
T/P @ 0.81154
Believe price could go as high as 0.8190 but will take T/P at above target and begin setup for SHORT trade.
Phase 2 Tentative:
SELL Entry Market Order @ 0.81309
T/P @ 0.80406
S/L will follow as price moves in projected direction at rate of 10-15 pips above/below. Entries/Exits may change in accordance to further analysis at beginning of week.
R3 0.8081 R2 0.8059 R1 0.8031
S1 0.7980 S2 0.7958 S3 0.7930
Updates / Adjustments / Results will be reflected in updated comments.
* Personal analysis only. Please use your own rules and strategies prior to entering market.
** Forex trading involves HIGH RISK.
Before entering a trade, carefully consider your objectives, financial resources and level of experience.

GBPUSD BEarish BATGBPUSD BEarish BAT
1. Fib confluence
2. major structure resistance
3. 61.8 FIB
4 Going along with trend
5. the pair had violated the 50DMA and 20DMA

NZDJPY 2 BEARISH PATTERNSHi every one,
just an idea i am not a pro i tried to explain all the things in the chart ,
i see 2 harmonic patterns a bearish BAT and a bearish AB=CD,
time frame is Daily or 4H, targets are Fibonacci levels.
any suggestions are welcome, 2,3 minds or more are better than one :-)
thanks


Starbucks Shares (SBUX) Time To ExitSBUX is setting up a bearish pattern on the monthly and weekly chart with a double top pattern, a bearish candlestick pattern and bearish divergence. Expecting price to go down. Time To Take Profits and Exit

What Are They Serving At Starbucks (SBUX)SBUX Weekly Chart Looking Bearish with #bearishengulfingsignal and #doubletoppattern

AUD/NZD in a clear opportunity for explosive breakout (1)AUD/NZD made Lower Highs and Lower Lows till price got stucked between $1.05 resistance and $1.04 psichological support (purple horizontal-dotted lines). Also, @ $1.04 there is another support from rising trendline. (green rising line)
Because we got Lower Highs and Lower Lows (magenta arrows) on this move, then it's normal to suppose the move will continue and our "bet" will be for the short side.

GBPNZDbearish patterns (2)
possibility for a head and shoulders structure. otherwise the consolidation area will continue in down trend
rsi is rising up
p.s the trend should go up due to bullish candlestick patterns ( you can see it on timeframe 5min); "for this reason the next candle should be a green one"

IGT - Bear flag formation Short from $23 to $20.13 IGT seems forming a bearish flag formation. A break of $23 will be flag pattern breakdown confirmation. And we think it can go down to $20 area at the breakdown.
* Trade Criteria *
Date first found- March 13, 2017
Pattern/Why- Bear Flag formation
Entry Target Criteria- Break of $23
Exit Target Criteria- $20.13
Stop Loss Criteria- $24.13
Please check back for Trade updates. (Note: Trade update is little delayed here.)
