ETH LOGARTHIMIC CHART eth all data in 1 chart. made this too see where we are gonna bottom this bear season. this along with other eth charts supports the bottom to be around 320-305, though if we see a capitulation candle we see bttc around 9.3 and eth around 225-150. please take a look on other charts before seeing this
Bearmarket

eth short ideaig everything is quite provided in the chart , but i really think it will go to lower limits since bt6c is going to 11.9. if eth bleeds every alt will.

btc daily btc made double top in monthly and 2 head and shoulders in daily, followed by a bullish channel after 1st and before 2nd. How am i so sure regarding the double top in monthly? because of 2 retest in daily which is at a perfect angle to the double top. btc will make corrections at 34400 level to before going to 19.4, which might be followed by a short term relief rally but will ultimately end up to 11900 level. 98% of retailers will be out by then and big institions like always fill their bags up which will end up btc to 52k . it will get rejected from that level again and will go to 29k level . it will grab so much liquidity again that the retailers will fomo once again and btc will end up in 72k - 78k range.

BTC - Signs of bottomBitcoin is forming its cyclical market bottom. A spike to a lower-low with a v-shape recovery is in the future, IF history is any indicator.
Looking at the 2015 market low (left) and the 2018 market low(centre) we can see clearly that the once price crosses above the 1D 12 MA AND 20 MA then the market low is in the past. In both instances that crossing was concurrent with increasing volume until price spiked above the upper-Bollinger Band. These are the milestone proof-points of the market bottom.
In the current market, those events are still in our future.
I feel a spike down to a new low is imminent, possibly forming a effective double bottom around the $25k level. History tells us we should then see a discernable upward trend in all indicators, with milestone proof-points confirmed in the following week.
What do you think, is price about to crash to sub $20k, take off to the moon, or emulate these past bear market lows?

BTC/USD Daily TA Cautiously BullishBTC/USD Daily cautiously bullish. *BTC has been consolidating around $30k for thirty consecutive sessions now.* Recommended ratio: 70% BTC, 30% Cash. Price is currently attempting to close above $30507 for a second consecutive session after defending support at the 50/50 uptrend line from March 2017 ($29.5k). Volume remains Moderate (high) and is on track to favor buyers for a fourth consecutive session if it can close today in the green. RSI is currently testing the descending trendline from January 2021 at 52 after defending support at the uptrend line from January 2022 at 45; the next resistance is the uptrend line from November 2018. Stochastic remains bullish and is currently trending up at 87 as it is still technically testing 77.95 resistance; the next resistance is max top at 102.07. MACD remains bullish and is currently trending up at -542, the next resistance is at 312.67. ADX is currently trending down at 28 as Price continues pushing higher; this is mildly bullish and would become bullish if ADX formed a trough as Price continued to appreciate. If Price is able to break above the 30-day high at 32696 minor resistance, the next likely target is a retest of the 50 MA at $33347 (before potentially heading higher). However, if Price breaks back down below $30507 support then it will likely retest the 50/50 uptrend line from March 2017 at $29.5k before potentially falling lower ($24180 minor support). Mental Stop Loss: (one close below) $29273.

After a 94% fall, what's next?Gala is one of the – promised – cryptos that affected most in this bear market, considering that fell 94% since November 2021.
What’s next?
There are two main short-term S/R levels to watch.
If $0.07 support breaks, that will be … a disaster as it’s expected a (29 – 38) % drop.
On the other hand, if $0.095 breaks we may see a 55% surge max.
And that’s an optimistic scenario.

Peculiar Position for the MarketThe market is making an attempt to rally, but we will need to violate this repeating pattern if we can expect any upside from here. Otherwise, it's just another good entry for short positions. Why buy an overpriced market if holding cash would yield positive with no risk of entry or exit?
Here are some sentiment metrics and things to keep in mind, some technical and some fundamental. There's more of them but here are the ones I can immediately think of:
DXY is still rallying.
The US dollar historically loses 5% purchasing power per year, yet is seen as a safe haven. This is how overpriced the market is.
Japan, the largest purchaser of USA treasuries, is now a net seller.
Foreign bank exposure of US Treasuries is now declining as opposed to rising as in 2008.
USA cannot fund a central bank bailout via foreign purchases of treasuries as in 2008.
Some commodities are still at multi-decade lows, save for EV related markets and others which were forcefully subsidized.
Oil is rallying with a distinct lack of supply increase AND increased seasonal demand.
Because fuels are rallying, transportation costs are increasing baseline costs for every person and business.
Fertilizers and other chemicals are in short supply which increases food prices.
Some top producing food countries are now restricting imports.
The rate of home purchases is declining rapidly, mortgage rates and risky variable interest rate mortgage deals are rising.
Most of the rally in the past week was in profitless tech.
Increased USA consumer spending is solely based on increasing consumer credit card debt, rather than savings or income.
Central bank interest rates are not anywhere near the price inflation rates and are causing malinvestment to linger.
The rate of layoffs is increasing and has not met or exceeded 2020 levels.
Layoffs in the past few months were mostly in small businesses with most medium and larger ones adding employees, yet suddenly almost all of them have stopped hiring.
There is a lack of specialized skilled labor and this demand is not being met with supply.
The largest stocks have not had a serious decline.
The percentage of stocks in a downtrend has not yet met the lows of 2016, 2018, or 2020.
Cryptos have not yet dropped to their 200D MA and consolidated sideways as was the case in 2016 and 2018.
Some, but not all cryptos have just made a 30-100% rally and are selling off in a hint of downward continuation.
(VIX + VXN) has not yet met or exceeded the peaks of 2001, 2008, 2011, 2012, 2015, 2018, or 2020.
Chinese housing stocks still in a downtrend, -70% yoy, companies are failing to pay interest. This housing market is valued higher than the US stock market.
The war in Ukraine clearly is not short-term and is a catalyst for future proxy wars, central bank robbery of citizens, and wealth destruction.
Fake CPI data comes out on friday.
---------------------------------------
Unless some of these things have a serious turnaround in the next 3-12 months, the market will not turn fundamentally bullish. Sure, we might get a suckers' rally, but until we get a huge bailout or many of these conditions improve, there is absolutely no reason to lean heavily towards risk-on and everyone MUST do their fiduciary duty of capital preservation. With that said, there is opportunity all around if you look hard enough.
Do not use your capital to price yourself into a mispriced market.
Let me know what you think!
Thanks for taking a look and don't forget to hedge your bets!

ETH/USD Daily TA Neutral BullishETH/USD Daily neutral with a bullish bias. *The Merge is scheduled to go live on Ropsten Testnet in the next couple of days. Price is on day 26 of trading within a Bull Flag. Bitcoin has broken out to the upside. Still unclear whether this is a retracement or reversal.* Recommended ratio: 55% ETH, 45% Cash. Price is currently retesting the upper trendline of the Bull Flag from 05/12/22 after briefly retesting $1941 resistance. Volume remains Moderate (low) and is on track to favor buyers for three consecutive sessions if it can close today in the green. Parabolic SAR flips bullish at $1979, this margin is bullish. RSI is currently trending up at 42.71 after bouncing from 36.91 support. Stochastic crossed over bullish in today's session and is currently trending up at 71, the next resistance is at 80.69. MACD remains bullish and is currently trending up slightly at -135, the next resistance is at -90.80. ADX is currently trending down at 40 as Price continues consolidating, if ADX can form a trough as Price continues up it would be bullish. If Price is able break out above $1941, it will likely retest the 50/50 uptrend line from February 2017 at $2140. However, if Price breaks down here then it will likely retest $1711 minor support before potentially falling lower (lower trendline of the Bull Flag at $1600). Mental Stop Loss: (one close below) $1711.

Bull trap on BTC!!!In this video i am explaining where i think we are going to go from here and also i'm looking at the 4 hourly, daily, weekly and monthly chart.
This is my first video and i hope you'll like it. Also i'm sorry for my speaking mistakes, I'm trying to improve my english.
What do you think about my first video and analysis ?
Feel free to leave a comment.
If you like my ideas please follow me and like because you can always find something interesting on my profile, i am new to Treadingview but i have 6 years expirience in trading.
DON'T SELL YOUR CRYPTO
BTC TO THE MOON!!!

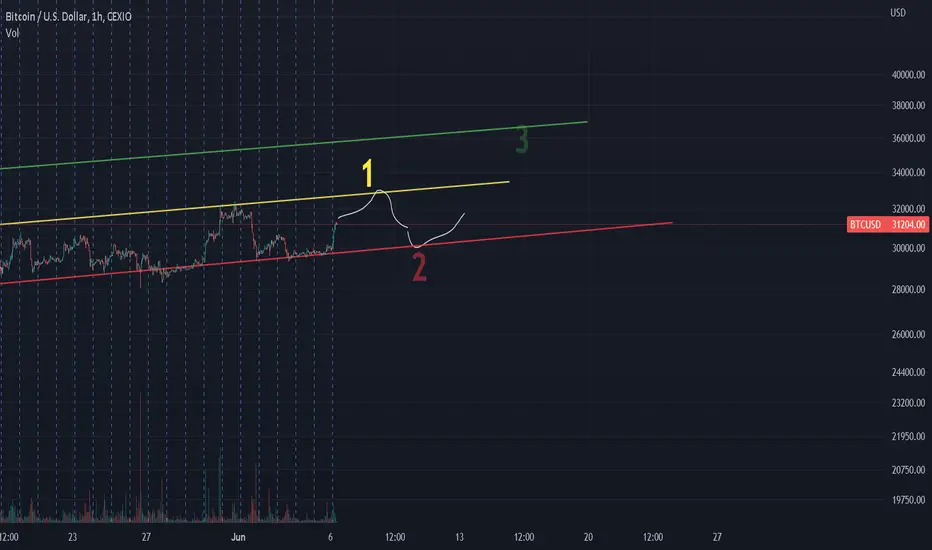
Local corection in June (3)Another option is how a correction can take place if sales are stronger towards the support line.
Bounces on the news or on glimpses of unjustified optimism.

Local correction in June (2)Same thing but from a slightly different angle.
No matter how you look at it, a rebound is quite likely.
So far, I do not expect a collapse on such fear.
BTC/USD Daily Neutral BullishBTC/USD Daily neutral with a bullish bias. *SELL OFF WATCH. Price has been testing $30k for twenty eight consecutive sessions now*. Recommended ratio: 51% BTC, 49% Cash. Price is currently back to trading in the second largest supply/demand zone just below $30507 resistance and is also testing the 50/50 uptrend line from March 2017 as support at $29.5k for a twenty fourth consecutive session. Volume remains Moderate (low) and has been shrinking for five consecutive sessions now (which implies that a breakout or breakdown is pending); it is currently on track to favor buyers three out of the past four sessions if it is able to close today in the green. Parabolic SAR flips bearish at $28.5k, this margin is mildly bearish. RSI is currently testing the uptrend line from 01/22/22 at 45 as resistance after bouncing from 42.41 support. Stochastic continues to test 55.55 support for a third consecutive session and is currently on the verge of a bullish crossover. MACD remains bullish and is currently trending up slightly at -920; the next resistance is at 312.67 and the next support at -1435. ADX is currently trending down slightly and beginning to form a trough at 32 as Price continues to consolidate at $30k; this is mildly bullish. If Price is able to break out (and close) above $30507, the next likely target is a test of the 50 MA at ~$34k as resistance. However, if Price breaks down here then it will likely fall fairly quickly to $24180 minor support before potentially falling lower to $20k. Mental Stop Loss: (tight stop - one close below) $29k.

Accumulation Zone!$BTC is more than 50% off from its ATH. Time to accumulate and keep stacking and stacking and ignore all the FUD and negativity surrounding Bitcoin. I set 3 target levels i believe we will reach within several months. This bear market is an opportunity to capitalize on people's miscalculations due to their fomo. A continue short is inevitable. The bottom wont be here for another several months or so. Only the patient one wins.

ETH/USD Daily TA Neutral BearishETH/USD Daily neutral bearish. *BREAKOUT WATCH, ETH is on day 24 of trading within a Bull Flag.* Recommended ratio: 40% ETH, 60% Cash. Price is currently testing $1711 minor support as it is approaching twenty five consecutive sessions of trading within a Bull Flag (bottom of the Flag is currently at $1650). Volume remains Moderate (low) and has been fairly balanced between buyers and sellers recently (indicating consolidation). Parabolic SAR flips bullish at $2000, this margin is neutral at the moment. RSI is currently trending sideways at 36.91 support. Stochastic is currently forming a trough at 55 just above 46.76 support; a break above 59 would result in a bullish crossover. MACD remains bullish and is currently trending sideways at -158; a break below -180 would result in a bearish crossover. ADX is currently trending down slightly at 42 as Price is testing $1711 minor support, this is neutral at the moment. If Price is able to defend support (minor) at $1711, the next likely target is a retest of the upper trendline of the Bull Flag at ~$1900. However, if Price breaks down here, it will likely retest the lower trendline of the Bull Flag at $1650. Mental Stop Loss: (two consecutive closes above) $1941.

What is the lowest possible price for bitcoin?Ask yourself what is the lowest possible price for bitcoin?
20000? 15000? Theoretically, the price will be - 0.
I'm not saying that there will be such a price, but if there is a panic in the market, keep this in mind.
By the way, how much is Terra Luna now?
Keep in mind that bitcoin was worth exactly zero at first.
And the correction will probably drag closer to that number as well.
You may start to panic.
In May 2010, 10 thousand bitcoins were equal to $40-$50 (an American bought two pizzas for 10 thousand bitcoins).
That is, a person sold 10 thousand bitcoins and he actually just gave them away. It is clear that not all of his bitcoins.
Perhaps he had 100 thousand bitcoins and he did not feel sorry for selling them. That is, there are people who have a bunch of these bitcoins.
Many years have passed, but in fact nothing has changed globally, everything except the value of bitcoin.
I can't take and buy anything with bitcoin, there are just a bunch of people who want to sell it for more.
I took 2009 as a starting point and drew trend lines from zero.
At first, we don't have prices until we sold two pizzas for 10,000 bitcoins. Then the price started to rise sharply.
As you can see, each subsequent wave of the trend has less strength.
In fact, if you look at the real from afar, bitcoin has not yet hit the real bear market, where the next wave will cover the bottom of the previous one.
But as the trend fades, it can happen and the next wave could rewrite the 3000 low.
Perhaps this will not happen and bitcoin will hold the 3000 level or be higher than it, but look at the trend.
Looks like waves 1, 2, 3 are fixing now.
Now look at the volume in 2015 and 2020-2022. Someone is now quietly fixing and distributing bitcoins,
At the same time, there are no serous purchases and panic sales. Everything is still ahead!

#Ethereum is the dominant #Crypto network Around 500 dollars give or take 50 dollar either side is what I am looking for this Bear Market bottom.
Upon which the chart will look great going forward. And the much vaunted flippening will have a great chance of occurring in the next cycle.
@TheCryptoSniper
#HVF

IOTA/USDT - Complex overview for USD altcoinsIOTA / USDT (Binance) - A comprehensive look at the trend of altcoins in USDT pairs
IOTA is a token that was among the first in my portfolio in 2018. Overall, this is probably one of my first purchases ever, so I always have a bit of nostalgia in this chart. It is not fundamentally bad at all, but at the same time it has not yet delivered a revolution on the Internet in a similarly broad-spectrum Internet of Things (IoT). However, I don't want to write specifically about this pair, but it seems to me to be a good example of an average altcoin in terms of chart.
👌🏻The current altcoin market takes three forms:
1. - Charts such as HNT, STX, SOL, BNB. They recorded tough corrections, but their growth in the previous bullrun was so impulsive that even such a tough market correction failed to send them to long-term PoC structures and their long-term up-trend is maintained (including Bitcoin).
2- Charts like IOTA - Despite strong growth during the last run, they failed to get prices above their ATH and the current market situation sent them to the historically strongest Point of Control levels (in the case of IOTA - $ 0.285)
3. Newer charts like MINA, DYDX and others - haven't warmed up in the market for a long time, they have managed to make nice impulsive structures, but their chart has not yet experienced a bear market. This puts them at a disadvantage, as the structure lacks long-term PoCs as in the case of IOTA or BTC. It is these last 2 types of charts that are beginning to suggest that perhaps due to the influence of LUNA, perhaps only the macroeconomic situation, USDT pairs will have to create longer-term accumulation zones (about 1 year) before a possible next bull run.
👍🏻Still, the vast majority of long-term charts are in sharply declining bullish patterns (most in falling wedges). Although the slope and pattern may indicate the end of the correction, and following a hard pump breakout, it makes more sense to the exact opposite. Of course, strong pumps can come and we will see 100-200% growth in the market again, we will probably have to wait for a new trend to start.
- This view may be one of the most basic things on the market and that is CYCLE. Each cycle on each asset of the international financial world takes place in 3 phases. Uptrend / Downtrend and subsequent consolidation. The condition of the enormously declining altcoins is beginning to indicate the bottom. Personally, it would make sense to me to create one short-term low in the form of a wick, which would come after the SL and liquidators of the currently recruited longs. However, I would venture to say that there will be an area of LONG-TERM BOTTOM.
❕Current prices for HODL perspective are more than luxurious, we didn't even dream about it half a year ago, and therefore the period of the coming months is more than suitable for the accumulation of favorites for long-term (HODL) positions. As in every market, only the meaningful will survive, so choose projects that have a product / ecosystem or global implementation. My modest estimate (of course it could be wrong) is that in the next year there will be a chance to take 100-200% profits on the altcoins several times, but we will probably have to wait for some more significant bull run and REAL alt season, maybe up to one year.
✅ Gradually, after creating a new low, I will start to accumulate the HODL portfolio on a large scale. At the same time, we will use this drop to gain middle-term positions with targets of 50-200% and we will try to use the lower volatility on HTF for LTF trades to multiply the USDT portfolio before the re-green year, which could come about 1 year before the halving (the one for so far it is published on August 12, 2024). As a result, we will focus our strategy on next summer.
1D chart:

ETH/USD Daily Neutral BearishETH/USD Daily neutral with a bearish bias. *Fed is on day 2 of decreasing the balance sheet, Jamie Dimon says JPMorgan is bracing for an 'economic hurricane' , St. Louis Fed President Bullard suggests cuts may be possible in 2023 or 2024 once inflation comes down and there is widespread unanimity in both the Fed and Congress that inflation is the number one priority (hence the frontloading funds rate hikes this year). However, not all is bearish considering Ethereum has launched a new beacon chain on the Ropsten testnet and first trial of The Merge is expected on June 8th .* Recommended ratio: 40% ETH, 60% Cash. Price is currently trending down at $1850 after being rejected by the upper trendline of the Bull Flag from 05/12/22 at $1941 resistance; the next support is at $1711. Volume remains moderate and is currently on track to break break a two day streak of seller dominance if it can close today in the green. Parabolic SAR flips bullish at $2019; this margin is neutral at the moment. RSI is currently trending up slightly at 39.67 after bouncing from 36.91 support. Stochastic crossed over bearish in today's session and is currently trending down at 70 after being rejected by 80.69 resistance on the first test. MACD remains bullish and is currently trending up slightly at -160; the next resistance is at -90.80. ADX is currently trending down and beginning to form a trough at 43 as Price is falling; this is neutral at the moment. If Price is able to bounce here ($1850), it will likely retest the upper trendline of the Bull Flag at $1941 resistance. However, if Price continues to fall here then it will likely retest the lower trendline of the Bull Flag at $1711 minor support (and potentially lower). Mental Stop Loss: (two consecutive closes above) $1941.

CRYPTO.COM +200% Crypto.com an exchange token has been following a specific fractal that has been seen in the 2018-2019 bear market for bitcoin.
This of course is purely speculation and shouldn't be taken seriously until we breakout of the descending channel, I do believe however that we are coming to an end for this years bear market and personally this is when I will be dollar cost averaging into coins that have big upside potential... CRO being one of them
Not financial advice DYOR.

BTC/USD Daily TA Neutral BullishBTC/USD Daily TA neutral with a bullish bias. *SELL-OFF WATCH* . *For the first time in history, the DOJ charged former OpenSea Head of Product Nate Chastain for Insider Trading with NFTs while he was at OpenSea. That headline surely didn't go over well with the crypto community.* Recommended ratio: 51% BTC, 49% Cash. Price is currently retesting the 50/50 uptrend line from March 2017 at $29691 as support and risks flipping the bias bearish if it closes below $30k in today's session. Volume remains moderate (low) and is currently on track to break the four day streak of buyer dominance if it can close today in the red. Parabolic SAR flips bearish at $27500, this margin is neutral at the moment. RSI is currently testing the uptrend line from 01/22/22 at 42.41 support after being rejected by the descending trendline from January 2021 at 52. Stochastic crossed over bearish in today's session and is currently trending down at 83 as it approaches a retest of 77.95 support. MACD remains bullish and is beginning to form a peak at -1135; it is still technically testing -1435 resistance. ADX is currently trending down at 36 and is beginning to form a trough as Price fell back down below $30k, this is mildly bearish. If Price is able to bounce from the 50/50 uptrend line from March 2017 (~$29.6k) then it will have to close above $30507 in order to continue a rally and potentially retest the 50 MA at ~$34.5k. However, if Price breaks down below the 50/50 uptrend line then it will likely test $24180 minor support before potentially falling lower. Mental Stop Loss: (tight stop - one close below) $29186.

AAPL/USD Daily TA Neutral BullishAAPL/USD Daily neutral with a bullish bias. *With China loosening their Covid-19 restrictions/lockdowns and planning QE (via a digital Yuan airdrop ) in the coming weeks, fears regarding supply chain constraints' potential negative effect on Apple product demand for their next market cycle is starting to subside. Additionally, Apple announced a new $90b share buyback program and a dividend increase of 7% . However, Big Tech is not out of the rubble yet so it's a bit premature to get too bullish at the moment.* Recommended ratio: 60% AAPL, 40% Cash. Price is currently testing $149.05 minor resistance (which is also the largest supply/demand zone on record) as the 50 MA is on the verge of crossing below the 200 MA (which would form a Death Cross); it should be noted that even though the 50 MA is so close to crossing over, it is a lagging indicator and therefore can reject the crossover at the very last second. Volume remains high (moderate) and is currently on track to break a three day streak of buyer dominance if it can close today in the red. Parabolic SAR flips bearish at $133; this margin is mildly bearish at the moment. RSI is currently trending down slightly at 48, just below 57.58 resistance; the next support is at 35.61. Stochastic remains bullish at 98 and is currently on the verge of testing max top. MACD remains bullish and is currently trending up at -4.36 after bouncing off of the ATL at -6.69; the next resistance is at -2.36. ADX is currently trending down at 23.71 as Price is surging, this indicates that either a temporary retracement or a trend reversal is underway and is thus mildly bullish. If Price is able to flip $149.05 minor resistance to support, then the next likely target is a test of $157.42 resistance. However, if Price breaks down here, it will likely increase the odds of a Death Cross significantly and have Price retest $138.46 support (which would coincide with the lower trendline of the channel from January 2019). Mental Stop Loss: (one close below) $146.82.

BTC/USD Daily TA Cautiously BullishBTC/USD Daily cautiously bullish. *Bear Market Rally is underway and $30k support appears to be the short-medium term bottom.* Recommended ratio: 75% BTC, 25% cash. Price is currently breaking out above $30507 resistance after bouncing from the 50/50 uptrend line from March 2017 at $29.5k; it was testing this uptrend line for twenty consecutive sessions. Volume remains moderate (low) and surged yesterday as Price broke out to the upside (invalidating a descending triangle). Parabolic SAR flips bearish at $27120, this margins is neutral at the moment. RSI is currently testing a critical resistance at the descending trendline from January 2021 (51) after reclaiming the uptrend line from January 2022 at 44 as support; if it can break above the descending trendline from January 2021, it will likely test the uptrend line from November 2018 as resistance at 54. Stochastic remains bullish and is currently trending up at 99.75 as it quickly approaches a test of max top (101). MACD remains bullish and is currently trending up at -1206; it is still technically testing -1435 resistance. ADX is currently trending down at 37 as Price is trending up, this indicates that a reversal or retracement is underway and is mildly bullish. If Price is able to continue surging, the next likely target is a test of the 50 MA at ~$35k. However, if this surge was actually a Dead Cat Bounce/Bull Trap then a retest of $30507 support and the uptrend line from March 2017 at $29.5k is likely (with potential to fall much lower). Mental Stop Loss: (one close below) $30k.

Where is the crash everybody keeps telling me about?... I don't see it! If there is going to be a crash we have a lot further to go. Don't you think?

Where will be the BTC Bottom?It's been roughly a bear market for a while now, and where will be the bottom is a hot topic these days. In my opinion, BTC has still room to drop until the real capitulation happens; therefore I can imagine a classic 80% Drop from its all-time high which is arguably in confluence with some powerful levels, including two long time frame Fib levels.
Of course, in the end, the market will surprise us all.
