Why Traders Freeze: The Psychology Behind Not Cutting LossesFirst up: let’s address the elephant in the room. Loss aversion — that great human flaw. From the moment your ancient ancestor decided to poke a saber-toothed tiger to see what happens, the brain has been hard-coded to avoid pain at all costs.
Loss aversion is literally in your DNA — studies show people feel the sting of a loss twice as intensely as the pleasure of an equivalent gain.
When you see that trade slip into the red, your rational brain may say, “Cut it, the setup is invalid, live to trade another day.” But your emotional brain — the one still grunting in a cave — is screaming, “It might come back! Hold! HOOOLD!” So you sit, frozen.
🌱 Hope: The Most Expensive Four-Letter Word
Hope is the silent killer of trading accounts. You think you’re being patient as you decide to give the trade “room to breathe.”
But what you’re really doing is outsourcing your exit strategy to technical tools, news headlines, and anything that’s not your own choice, hoping something will rescue your losing position.
This is how tiny losses can turn into portfolio ruin. Just ask anyone who’s held a small-cap memecoin down 90% because the “team has potential.”
🧊 Analysis Paralysis: When the Chart Becomes a Maze
Another reason traders freeze? Overanalysis. One bad candle and suddenly you’re toggling between the 1-minute, 5-minute, and daily chart like you’re hacking into the Pentagon. And your trendlines? You’re probably drawing them wrong .
More data rarely leads to more decisive action. It just feeds your brain conflicting signals until you’re convinced you see a bounce that isn’t there. Meanwhile, the loss grows. And grows. And then you’re back to hope. Rinse, repeat.
😬 The Ego Monster: Admitting You’re Wrong
Here’s the harsh truth: cutting a loss means admitting you were wrong. For traders, whose entire identity can hinge on being “smart money,” that feels like public humiliation. The ego monster wants you to be right more than it wants you to be profitable.
So instead of taking the small L, you’ll cling to the trade because closing it out would force you to look in the mirror and say, “I was wrong and I need to do better.”
🏴☠️ From Risk Management to Revenge Trading
Once you’ve frozen long enough, you reach the next stage of the bad-losing cycle: revenge trading . Now you’re not just trying to recover your loss; you’re out to punish the market for “taking” your money.
Spoiler alert: the market doesn’t know you exist, and it certainly doesn’t care. Maybe this is the gambler’s mindset disguised as a “strategy?”
📉 Blame the Tools? Not So Fast
Some traders love to blame outside factors like the Economic calendar or their indicators when they freeze. “My RSI didn’t signal this! The MACD betrayed me!” Indicators are just tools — they don’t make decisions for you. You do.
Hiding behind tools means you refuse to take accountability. It’s a convenient excuse that can keep you stuck in the same losing habits. Better to master the one tool that matters: your discipline .
✂️ The Beauty of the Hard Stop
All hail the hard stop — the trader’s seatbelt. It’s not attractive, it’s mechanical, but it’s often the only thing standing between you and a potentially blown-up account.
The reason some traders can survive the market for decades isn’t because they’re never wrong — it’s because they’ve learned to make their stops non-negotiable.
A stop-loss is you telling your brain, “Hey, I’m not smarter than the market, so I’ll automate the decision before I get emotional.” It takes the agony out of cutting a loss because you’ve already decided on the outcome before your lizard brain can intervene.
⚖️ Small Losses Are the Cost of Doing Business
Want to feel better about cutting that loss? Think of it as your tuition fee. Every trader pays a certain cost to the market — it’s the cost of playing the game. No one gets every trade right. The pros just get better at losing small.
Those big-shot money spinners you look up to? They didn’t build their empire by never losing. They’re pros at getting out when they’re wrong. The difference between a pro and a blow-up isn’t the winning trade — it’s the ruthless discipline on the losing ones.
🧘♂️ Finding Comfort in Discomfort
There’s no magic trick to make loss-cutting feel good. It always stings. But you can train your brain to see a small loss as a win for your long-term survival. Write it down. Journal the trade . Log the emotion. Over time you’ll realize that the trades you exit early rarely haunt you.
🏁 Face the Fear, Keep the Account
And finally, freezing in front of a loss doesn’t protect you — it likely means you’ll pay more than you should. Next time your gut says, “Maybe it’ll come back…” ask yourself: “Do I want to be right, or do I want to trade another day?”
Your job is to trade well and stay in the game for as long as possible.
Your turn, traders : what’s your biggest “should’ve cut it sooner” horror story? Drop it below — we promise not to say we told you so.
Beyond Technical Analysis

One last squeeze and NAS100 could explode into the next rallyThe NAS100 is currently coiling within a tight consolidation range, showing signs of tension building up. After a strong push upward, price has been moving sideways in a narrowing structure. This build-up around the high, a compression of buyers and sellers in a low-volatility squeeze could be an indication that we could use. This kind of price action typically signals that buyers are gaining control, squeezing out sellers with each dip.
The lack of deep pullbacks combined with increasingly shallow sell-offs shows fading bearish momentum. Which is often typical during a buildup phase before a breakout. If buyers can push price above with a strong close, it could trigger breakout momentum and lead to a continuation of the larger bullish trend.
Ideally, if price reacts positively and forms bullish confirmation, it would set up a solid continuation entry, with upside potential toward the next target of 23.400.
Until then, bulls are watching closely for signs of commitment. The breakout is yet to be confirmed, but the squeeze is on, and the pressure is building.
What will happen next?
Just sharing my thoughts for the charts, this isn’t financial advice. Always confirm your setups and manage your risk properly.
Disclosure: I am part of Trade Nation's Influencer program and receive a monthly fee for using their TradingView charts in my analysis.

What is the key that makes you start trading?
Hello, traders.
If you "Follow", you can always get new information quickly.
Have a nice day today.
-------------------------------------
HA-Low, HA-High indicators are indicators created for trading on Heikin-Ashi charts.
Therefore, they are determined by Heikin-Ashi's Open, Close, and RSI values.
If the RSI indicator value is above 70 when the candle starts to rise and then falls on the Heikin-Ashi chart, the HA-High indicator is generated.
If the RSI indicator value is below 30 when the candle starts to rise and then falls on the Heikin-Ashi chart, the HA-Low indicator is generated.
Therefore, rather than judging the rise and fall with your eyes, you can judge the rise and fall transitions with more specific criteria.
If you look at a regular chart, you can see that there are many rise and fall transition points, unlike the Heikin-Ashi chart.
The Heikin-Ashi chart has the effect of reducing fakes.
Therefore, it has a higher reliability than judging with a regular chart.
The biggest disadvantage of the Heikin-Ashi chart is that it is difficult to know the exact values of the Open and Close values.
Therefore, the HA-Low, HA-High indicators are used to accurately and quickly identify the Open and Close values by indicating the rising and falling transition points of the Heikin-Ashi chart on a general chart.
-
The Heikin-Ashi chart uses the median.
Therefore, the HA-Low indicator corresponds to the median when it leaves the low range, and the HA-High indicator corresponds to the median when it leaves the high range.
If the HA-Low indicator is generated and then receives support, there is a high possibility that an upward trend will begin, and if the HA-High indicator is generated and then receives resistance, there is a high possibility that a downward trend will begin.
Therefore, the HA-Low, HA-High indicators are used in basic trading strategies.
However, since the HA-Low and HA-High indicators are intermediate values, if the HA-Low indicator resists and falls, there is a possibility of a stepwise decline, and if the HA-High indicator supports and rises, there is a possibility of a stepwise rise.
Therefore, to compensate for this, the DOM (60) and DOM (-60) indicators were used.
The DOM indicator is an indicator that comprehensively evaluates the DMI + OBV + MOMENTUM indicators.
When these indicators are above 60 or below -60, the DOM (60) and DOM (-60) indicators are created.
In other words, the DOM (60) indicator corresponds to the overbought range and indicates the end of the high point.
The DOM (-60) indicator corresponds to the oversold range and indicates the end of the low point.
Therefore, when the HA-Low indicator resists and falls, the actual stepwise decline is likely to start when it falls below DOM (-60).
On the other hand, when the HA-High indicator is supported and rises, the actual step-up trend is likely to start by rising above DOM (60).
This compensates for the shortcomings of the HA-Low and HA-High indicators.
-
There is no way to be 100% sure in all transactions.
Therefore, if the motivation to start a transaction is clear, it is only worth challenging the transaction.
Finding that motivation and deciding how to start a transaction that suits your investment style is the trading strategy and the core of trading.
-
Thank you for reading to the end.
I wish you successful trading.
--------------------------------------------------

EURUSDHello Traders! 👋
What are your thoughts on EURUSD?
Following its recent rally, EURUSD has reached a key resistance zone, which also aligns with a trendline. The pair failed to break above this area and has been rejected.
Given the weak momentum and bearish reaction, we do not expect a breakout at this stage.
Instead, we anticipate some consolidation around the resistance, followed by a downward move toward the specified support level.
Don’t forget to like and share your thoughts in the comments! ❤️

CAD/CHF: Break, Retest and Go?The market is in a strong downtrend, moving inside a visible steep channel. Price recently pulled back into a previous support-turned-resistance zone. This move appears corrective in nature, with sellers likely waiting for signs of exhaustion before re-entering in the direction of the existing trend.
Now price is reacting to the resistance zone and rejecting further upside, suggesting potential continuation lower. Ideally if price retests without closing significantly above it and forms bearish price action confirmation, it would provide a high-probability short setup: pin bars or bearish engulfing candlesticks right at retest level would help confirm the signal.
From there, continuation toward the middle of the channel becomes likely. The target projection sits near the 0.57300 level. If price fails to break lower and instead closes above the resistance zone, the setup becomes invalid and would indicate potential reversal.
In short, sellers are watching for a break and retest, aiming to ride the move down to target of near 0.57300. The downtrend would be maintained as long as price respects the current resistance and shows more signs of bearish strength.
Just sharing my thoughts for the charts, this isn’t financial advice. Always confirm your setups and manage your risk properly.
Disclosure: I am part of Trade Nation's Influencer program and receive a monthly fee for using their TradingView charts in my analysis.

Bitcoin Expecting Bullish FormationBitcoin could be triggered by negative news from the U.S. regarding tariffs, which may create market uncertainty and push investors toward risk-off or alternative assets like crypto.
Currently, Bitcoin is reacting to the decline caused by fundamental negative data, but bullish sentiment remains alive as buyers attempt to hold key support zones. The focus now shifts to the psychological resistance near 110K
You may find more details in the chart.
Ps support with like and comments for more better analysis.
How to use Session Profiles for Day TradingHey whats up traders, in reveal cheat code for day trading by using session profiles. It's powerful concept. If correctly applied with HTF trend it will allows you to join running train path the right time.
Dont forget to follow me. I release such articles every Monday.
🧠 What Are Session Profiles?
A session profile describes the typical price structure and narrative during a market session — from open → high/low → close.
In Forex, we focus on:
• Asian Session
• London Session
• New York Session
Each session can act as either a reversal or continuation of the previous session(s).
📈 Why They Work
Markets are engineered to:
• Run stops (above highs or below lows)
• Fill inefficiencies (fair value gaps or imbalances)
CLS prefer to move price during specific times — the active hours around session opens. This is where liquidity is high and slippage is minimal, making it ideal for executing large orders.
So, session profiles help us map out when and where these manipulations are most likely to happen.
✅ Why You Should Use Them
Session profiles help you:
• Avoid low-probability trades in dead sessions
• Focus on high-probability narratives
• Anchor your execution models to context
But remember: they are not an entry model. You still need:
• A higher timeframe bias
• A mechanical entry model
• A system for risk and trade management
🔁 How to Use Session Profiles
Use the previous session(s) to anticipate the next one.
• For London session → analyze the Asian session
• For New York session → analyze Asian + London sessions
You’re looking for:
1. Manipulations into key levels
2. Displacement (price moves away strongly)
3. Change in order flow (e.g. OB,on M5 ,15 or H1)
4. Remaining liquidity targets (draw on liquidity)
📊 Session Profile Types with Chart Logic
1. 🔄 London Continuation Profile
Conditions:
• Asia session already made a manipulation into a key level
• Price displaced away from that level
• CIOD / OB on M15 or H1 before London open
Example:
• H1: Asia runs stops above H1 high into a fair value gap (key level)
• Displacement confirms intent
• At London open, price retraces into M15 premium (PD array) and continues in the same direction
Invalidation: the manipulation high/low from Asia session
Narrative: Asia did the manipulation → London does the continuation.
2. 🔁 London Reversal Profile
Conditions:
• Asia session consolidates near a higher timeframe key level
• London open initiates the manipulation into the key level
• Displacement + M15 BOS after manipulation
Example:
• H1: Asia consolidates under daily FVG
• London opens, price runs Asia high into that FVG
• M15 breaks down → clean short setup
• Target: higher timeframe draw on liquidity (e.g., previous day low)
Invalidation: the London session high (manipulation point)
Narrative: London performs the manipulation → price reverses.
3. 🔄 New York Continuation Profile
Conditions:
• Asia + London already created a clear manipulation and displacement
• London has not reached the final draw on liquidity
• London is not overextended (e.g., <70 pips move)
• New York opens with structure intact for continuation
Example:
• H1: London makes a reversal from a key level and displaces lower
• Draw on liquidity (e.g., previous day low) still untouched
• NY opens and continues the sell-off, retracing briefly into M15 imbalance before expanding lower
Invalidation: manipulation level from London
Narrative: London set the direction → NY finishes the move.
4. 🔁 New York Reversal Profile
Conditions:
• No clear London profile (no key level touched, no strong CHoCH)
• NY opens and manipulates into a key level (e.g., daily OB, FVG)
• Clear M15 or H1 CHoCH or BOS confirming reversal
• Asia + London lows still intact (liquidity available below)
Example:
• H1: No strong setup in London
• NY opens, price spikes into daily OB and takes out London highs
• M15 structure shifts → sell targeting London + Asia lows
Invalidation: NY session manipulation high
Narrative: London was noise → NY takes control and reverses.
🔁 Visual Structure Flow
Before applying any session profile, confirm:
1. High-probability trading conditions (e.g., key level proximity, market open, liquidity available, Red News)
2. Bias in place (HTF (D1 and Weekly direction must be known)
Then:
→ Check for valid session narrative
→ Select the correct session profile
→ Wait for the stop run of H1 / H4
→ Is there enough room for the move to key level
→ If we are still in first half of session you can enter. If its close the end of session skip it.
→ Apply your entry and risk model.
→ Dont be greedy look for 2:1 RR trade and get out.
🔁 How to enter ?
if bearish - You always want enter above H1 I H4 candle after LTF CIOD
If bullish - You always want to enter bellow H1/ H4 after LTF CIOD.
Use Order block to enter the market here is how to identify it correctly
Remember:
Never sell low / Never buy High... wait for stop run / Liquidity sweeps. If you dont know where is the liquidity - you will be liquidity.
Hope this brings clarity to your trading.
Done on the Tradenation Charts
Disclosure: I am part of Trade Nation's Influencer program and receive a monthly fee for using their TradingView charts in my analysis.
"Adapt what is useful, reject what is useless, and add what is specifically your own."
— David Perk aka Dave FX Hunter ⚔️

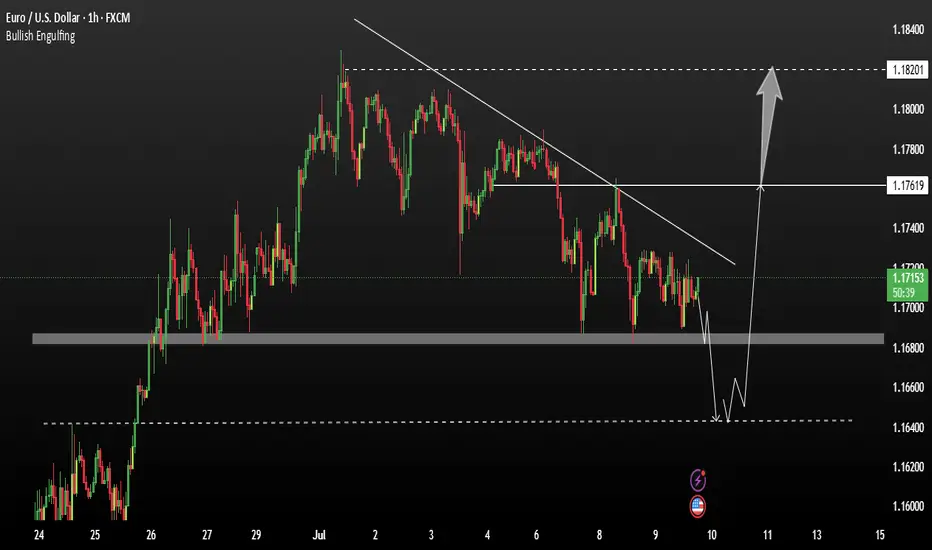
EURUSD Could leading Bullish correctionEURUSD has shown significant bullish momentum after breaking its previous structure. The pair is now undergoing a local corrective phase, which is healthy within an overall upward trend.
Currently, the price remains in a bullish model, suggesting that the correction may be short-lived before a continuation toward the key resistance zone.
Resistance zone 1.17620 / 1.18220
Support Level 1.16800 1.17450
A false breakdown below the identified support level could trigger renewed buying interest, shifting market sentiment in favour of bulls and potentially accelerating the next upward leg.
Ps Support with like and comments for more better analysis Thanks.
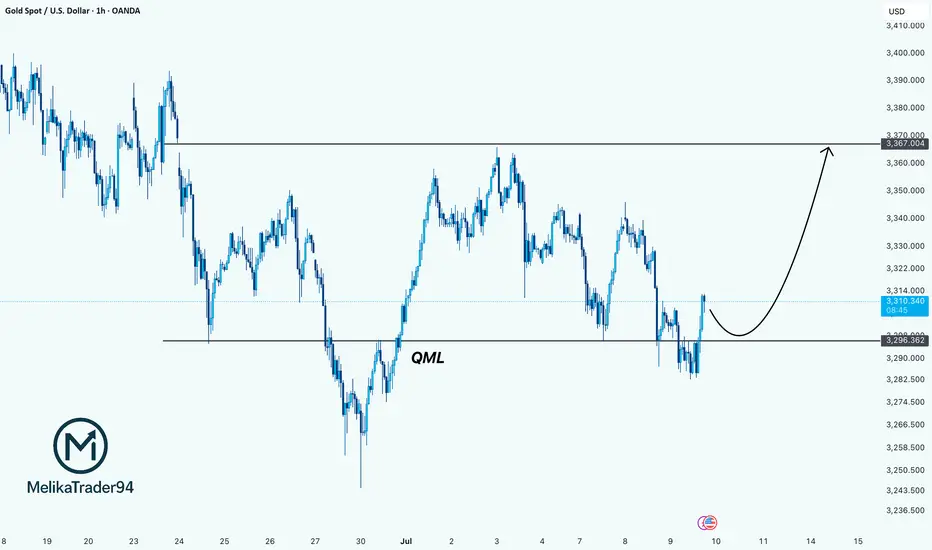
Gold Looks Bullish: technical and fundamentalHi Guys!
Gold is starting to flash major bullish signals, and this time, it’s not just about the chart. The technical setup is clean, but we’re also seeing fundamental tailwinds that could fuel a bigger move.
Let’s break it down
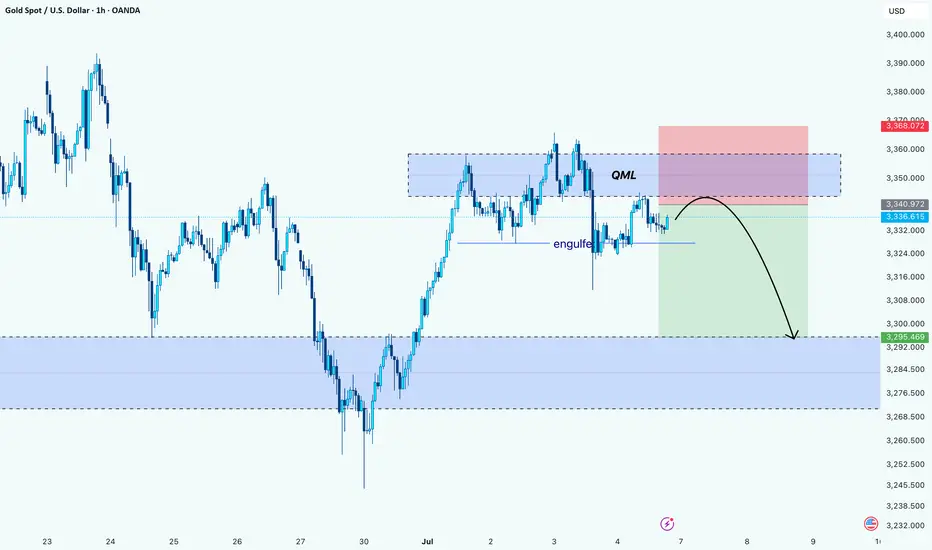
1. Technical Setup: The QML Reversal Is In Play
On the 1H chart, Gold is showing a textbook Quasimodo (QML) reversal pattern. Price made a lower low, then reversed up to break structure, and now it’s pulling back and respecting the key QML zone around $3,296.
This zone has turned into strong support. As long as we stay above it, the structure suggests a continuation toward $3,367 — a clean upside liquidity target and the previous high.
Strategy: Look for pullbacks into $3,296 for potential long entries with targets around $3,367 or higher.
2. Fundamental Tailwinds: Why Gold Is Gaining Strength
The fundamentals are stacking up in Gold’s favor right now. Here’s what’s fueling the move:
- Weakening USD & Rate Cut Expectations
With the Fed increasingly signaling rate cuts by late 2025, the US dollar is losing steam. Lower interest rates reduce the opportunity cost of holding non-yielding assets like Gold, making it more attractive to investors. Traders are already pricing this in.
- Softening Economic Data
Recent U.S. data, including weaker-than-expected job growth and declining manufacturing numbers, points to a slowing economy. That puts more pressure on the Fed to pivot dovish, which historically sends Gold higher.
- Central Bank Demand
Global central banks (especially in Asia) continue to accumulate physical Gold as part of their long-term reserve strategy. That institutional demand provides strong support at lower levels.
Technical + Fundamental = Strong Bullish Bias
We’re seeing a solid confluence here:
Chart says long (QML + bullish structure)
Macro says long (dovish Fed + weaker dollar + safe haven demand)
Drop your thought here!
ETH Pullback Before Next Rally? Hello guys!
Ethereum is currently testing a strong resistance zone around the $2,678 level, which has previously acted as a key barrier. Price action has been climbing steadily within an ascending channel, indicating a clear bullish trend in play.
However, since ETH is right at the resistance, we could see a short-term correction or pullback toward the $2,560–$2,580 support range (highlighted zone), which also aligns with the midline of the channel and previous consolidation structure.
If this support holds, a healthy bounce from this area would likely push ETH toward the next bullish target around the $2,760–$2,800 zone, which sits near the upper boundary of the current channel.

BTC – Bullish Continuation Ahead ?Bitcoin has been trading within a well-defined rising channel since mid-2023, respecting both upper and lower bounds beautifully.
After each impulsive move, we’ve seen healthy corrections followed by bullish continuations — a classic market structure in play.
🟦 Accumulation Zone: After a long accumulation phase, BTC kicked off a strong bullish cycle.
🟥 Correction Phases: Each major move was followed by a red correction zone before resuming the uptrend.
🟧 Current Phase: BTC is consolidating just below the upper channel boundary. A breakout above this zone could confirm the next bullish wave toward $140K+.
🔵 Key Observations:
Structure remains intact within the channel
Previous breakout zones now acting as support (blue arrows)
Continuation patterns are forming, signaling potential upside
🏹As long as the orange zone holds, BTC remains in a bullish structure, and a breakout would likely push us to new highs.
📍Will history repeat and BTC continue its journey toward the upper channel boundary? Let’s wait for confirmation!
💬 What’s your bias here? Are you bullish or waiting for a deeper pullback?
📚 Always follow your trading plan regarding entry, risk management, and trade management.
Good luck!
All Strategies Are Good; If Managed Properly!
~Richard Nasr

Gold (XAU/USD): Playbook in ActionHello guys!
We’ve seen a textbook QML (Quasimodo Level) setup play out beautifully on gold. Price pushed into a key supply zone and formed a QML structure, followed by a clean engulfing of the previous demand. confirming smart money involvement. As expected, the target of that QML has now been hit, tapping into the major demand zone below.
After the deep sweep and reaction from demand, price retraced upward into a potential lower high area. Based on structure and liquidity dynamics, two potential scenarios are in play:
We’re executing a two-step plan here:
Step 1: Short position from the QML + supply area, aiming for the next blue demand zone. Liquidity has been taken above the high, confirming the setup.
If we get a clean reaction near the blue area, that’s our signal to flip long. We expect a pullback toward $3310 area.

XAUUSD setup selling ideas h4Disruptive Gold Analysis – 4H Chart Perspective
Symbol: XAU/USD 🥇 | Timeframe: 4H
Date: July 9, 2025
⸻
🔁 Scenario Disruption: Potential Bullish Reversal
✅ While the original analysis shows a bearish continuation setup with consolidation under resistance and breakdown towards multiple downside targets, a disruptive view considers a false breakdown or support flip scenario.
⸻
🔁 Alternative Viewpoint:
📍 Current Price Action:
Price is testing the support zone (~3,280–3,290) which has held multiple times in the past.
🟢 Disruption Possibility:
1. Bullish Fakeout Trap Setup:
• Price may create a false breakdown below support to trap sellers.
• A quick recovery and breakout above the consolidation highs (~3,310–3,320) would invalidate the bearish continuation.
2. Resistance Flip Setup:
• If the market reclaims above 3,320, we may see a bullish push towards the key resistance zone at 3,360–3,380.
• This could evolve into a range breakout bullish trend continuation toward previous highs.
⸻
🔄 Disruption Targets:
• 📈 Immediate Upside Target: 3,320
• 📈 Breakout Target: 3,360
• 📈 Extended Bullish Target: 3,400+
⸻
⚠️ Invalidation Level:
If price closes below 3,270, then the original bearish scenario remains intact, with continuation toward 3,240 → 3,200 → 3,140.

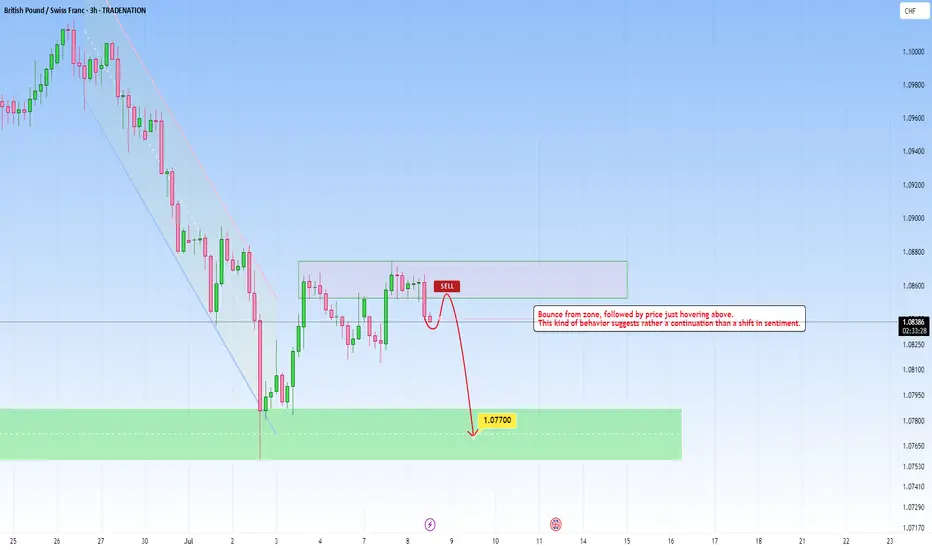
GBPCHF - Continuation Setup towards 1.0770GBPCHF recently descended with strength, and I’ve been watching to see how price reacts here.
Price now hovers above and this is a great indication for us to use for possible continuation move, that could send price into the 1.0770 level.
But if price breaks above with momentum, then I’ll back off the bearish bias and reassess, and I’d consider the continuation idea invalidated, with potential for further upside.
Just sharing my thoughts for the charts, this isn’t financial advice. Always confirm your setups and manage your risk properly.
Disclosure: I am part of Trade Nation's Influencer program and receive a monthly fee for using their TradingView charts in my analysis.
AUDUSD 4H: Sell Zone Confirmed📉 AUDUSD Analysis – Current Trend & Trade Opportunity
Hello Traders,
I’ve prepared an updated analysis for the AUDUSD pair.
At the moment, AUDUSD has shifted out of its previous bullish structure and has now entered a bearish trend. Based on this shift, I’m planning to enter a limit sell trade at the level shared below:
🔹 Limit Sell Entry: 0.65232
🔹 Stop Loss: 0.65576
🔹 Targets:
• TP1: 0.64591
• TP2: 0.64591
• TP3: 0.63738
🔸 Risk/Reward Ratio: 4.27
Considering the trend reversal, I’m looking to open a position from these levels.
I meticulously prepare these analyses for you, and I sincerely appreciate your support through likes. Every like from you is my biggest motivation to continue sharing my analyses.
I’m truly grateful for each of you—love to all my followers💙💙💙

Gold’s Trap Above QML: Bearish Play UnfoldingHello Guys!
Gold appears to be forming a textbook Quasimodo reversal setup after printing a lower high into a key supply zone. Price aggressively tapped into the QML area (around 3,350–3,360), where sellers previously stepped in, and we’re now seeing signs of rejection.
The engulf zone marked earlier confirms bearish intent. It broke structure and flipped momentum. Price is currently retesting below that engulf level, likely as a last attempt to grab liquidity before heading down.
The projected move suggests a drop toward the next significant demand zone around 3,295–3,285, where the price previously found a strong bullish reaction.
Bias: Bearish below QML
Target: 3,295 zone
Invalidation: Above 3,368 (high of supply zone)
Your Biggest Trading Enemy Isn’t the Market It’s YouWhy do traders get liquidated right at the peak of confidence?
Is capital safety defined by charts or by our inner world?
Let’s dig deeper. The real threat doesn’t come from the market. It comes from within.
Hello✌
Spend 3 minutes ⏰ reading this educational material.
🎯 Analytical Insight on Litecoin:
BINANCE:LTCUSDT has recently formed a reliable inverse head and shoulders pattern near a strong support zone 📉. This technical setup indicates a potential upside of approximately 9%, targeting $95 in the near future 🚀. Traders should watch for confirmation and manage risk accordingly.
Now , let's dive into the educational section,
🧠 The Mind: The Most Dangerous Indicator in the Market
Before the market empties your wallet, it hijacks your mind.
You may think you’re entering a trade using your indicators, but more often than not, it’s your emotions pushing the buttons. Tools are just the excuse.
When you feel absolutely certain and think this time is different, that’s when you’ve probably entered the danger zone. The market thrives on exploiting emotional certainty.
Truth is, many losses come not from poor analysis but from repeating bad decisions out of anger, revenge, or stubbornness. If you don’t protect yourself from your own behavior, no strategy can protect your capital.
🧨 Overconfidence: The Greatest Liquidator
One of the most destructive feelings in trading is confidence without validation
After a few consecutive wins, your brain flips the switch and you feel invincible
Overconfidence tricks you into skipping stop-losses, overleveraging, ignoring timeframes, or ditching your strategy altogether. The end result is all your hard-earned profits vanish in a single emotionally-driven trade.
Confidence should be earned trade by trade, not assumed after a few lucky runs.
📉 TradingView Tools: Real Support or Mental Trap?
Let’s be real. Tools are powerful only if used with clarity
Try the Bar Replay feature to stress-test your setups without live risk
Use the Long Short Position tool to visualize your actual risk reward, not the one your ego wants to see
Set Alerts so that your entries are data driven, not emotion driven
These tools are your allies. But just like a sharp knife, they can cut the cook too. The problem isn’t the tool. It’s always the hand using it.
🪤 If It Feels Right, It’s Probably a Trap
One of the most common cognitive biases traders face is mistaking emotions for data
You might see price touch support, but deep down, you’re still haunted by that last failed bounce, so this time, you enter out of revenge. Or maybe everyone online is screaming pump and FOMO kicks in
At that moment, you’re not thinking. You’re gambling
The market doesn’t care how you feel. It only cares whether you’re reacting emotionally because that’s the easiest liquidity
🧩 Not Trading Is a Trade
Especially in crypto, traders with patience often outperform those who force constant action
Someone who watches charts for three days without entering may end up ahead of the one jumping into five trades a day
Discipline in waiting is a skill. Sometimes, the most profitable decision is simply doing nothing
Pro traders strike rarely but with precision. The rest is surveillance, not execution
🧠 Good Trading Means Being Rational in the Moment
Here’s what separates losers from winners
Losers make a decision and then look for justification
Winners seek solid logic then make a decision
If your mind is unstable, even the best setup can lead to chaos
But a clear mind can extract gold from even the simplest charts
🧬 Final Thought
If you're serious about protecting capital, start with protecting your mindset
Open positions, stop losses, and chart entries matter, but without internal stability, none of them will save you
In truth, the riskiest place for your capital is not the market. It’s you
✨ Need a little love!
We pour love into every post your support keeps us inspired! 💛 Don’t be shy, we’d love to hear from you on comments. Big thanks , Mad Whale 🐋
📜Please make sure to do your own research before investing, and review the disclaimer provided at the end of each post.

TOTAL2 Moving Averages · This Bull Market Will Change Your LifeMarch 2024 signaled the end of a bullish cycle. After this month, the Cryptocurrency market went bearish. TOTAL2 index went bearish. As it was bullish, it traded above all the moving averages plotted on this chart. As it went bearish, all the moving averages broke as support but one, MA200. The back line on the chart.
MA200 works as support and denotes the broader and bigger cycle. As long as the action happens above this indicator, the market is growing thus bullish long-term. If the action moves below, the bears are in and winning.
Another strong moving average is EMA89, blue on this chart.
When TOTAL2 was bearish it managed to close only briefly below this level. One week and the next week back green. August 2024 and September 2024 TOTAL2 found support at MA200 and EMA89. As soon as these indicators were confirmed as support, we saw the development of a new bullish wave.
The altcoins market grew in November leading to a peak in December 2024. Here the same pattern repeats. TOTAL2 went from bullish to bearish. While it was bullish, it traded above all of the moving averages: EMA8, EMA13, EMA21, EMA55, EMA89 & MA200. As it turned bearish, all these moving averages were tested as support, all of them broke but one, MA200.
In April 2025 MA200 was tested as support and holds. As long as TOTAL2 trades above this level, we know the bigger broader market bias remains bullish. Bullish confirmed. As soon as this level was tested we had a small recovery above all moving averages, until May. Then a retrace led to a test of EMA89 as support and this level holds.
When TOTAL2 trades above all the moving averages, bullish confirmed.
TOTAL2 is now trading above EMA8, EMA13, EMA21, EMA55, EMA89 and MA200 on the weekly timeframe. Ultra-bullish and ready to grow.
Just as the December 2024 high was a higher high compared to March 2024, the late 2025 high will be a higher high vs December 2024. We are in a rising trend and this is confirmed because MA200 always holds as support.
Now that this level has been confirmed, we can expect additional growth. Instead of a single month of bullish action as it happened in late 2024, we can expect a minimum of 3 months of continued growth. In total, we will have at least 6 months, and then some more.
Because it is unexpected, this bull market will change your life, forever. You will receive more benefits and more blessings than anything you can ever imagine. All your hard work will pay-off. You will be rewarded for your patience, persistence and continued support.
Namaste.

Analyzing the Market with Fundamental and Technical AnalysisAnalyzing the Market with Fundamental and Technical Analysis
In addition to technical analysis, it's important to consider fundamental factors that could influence the market. News releases, economic reports, and central bank decisions can significantly impact price movements.
Fundamental Analysis:
Keep an eye on major economic indicators like NFP, CPI, and interest rate decisions. These factors can drive the market and change its trend direction.
Technical Analysis:
Use tools like EMA, Fibonacci, and Price Action to confirm the trend and identify entry points.
For daily updates and comprehensive market analysis, join my MMFLowTrading TradingView channel, where I combine both technical and fundamental analysis to give you the most accurate insights.
Conclusion:
Identifying market trends in one day doesn’t have to be complicated. By using the right tools like EMA, Fibonacci, and Price Action on TradingView, you can make better trading decisions every day. To take your trading to the next level, join my MMFLowTrading TradingView channel for daily updates, real-time trend analysis, and expert trading signals.
Ready to start trading with precision? Join my MMFLowTrading TradingView channel today for daily market insights and trading setups. Stay updated with real-time analysis, get actionable trading signals, and take your trading skills to the next level. Follow me now on TradingView!
Two interesting FX technical strategies under close watchWhile the US dollar is the weakest major currency on the foreign exchange (FX) market this year 2025, and the question of its low point arises, two other currencies seem important to me to put under close watch for this month of July: the Pound Sterling (GBP) and the Hong Kong dollar (HKD). To begin with, you can reread our latest analysis below (by clicking on the chart), which raises the question of a possible future low point for the US dollar on the FX.
The British pound, which was buoyed by positive momentum at the start of the year, is now facing fiscal and bond risks that are weakening it. At the same time, the Hong Kong dollar is testing the solidity of its parity mechanism with the greenback, forcing the local monetary authority to step up interventions to preserve its credibility. The EUR/GBP rate could be a good strategy for hedging against the risk of a fall in sterling. As for the USD/HKD rate, the upper end of the PEG could once again provide good resistance for a trading strategy.
1) Sterling is under pressure from UK bond yields, and the EUR/GBP rate presents an interesting chart configuration
The EUR/GBP rate, a barometer of confidence in the British currency, could come under upward pressure if UK budget fears persist. Tensions intensified after Keir Starmer's Labour government abandoned several budget-saving measures, deepening an already worrying deficit. As a result, yields on 30-year British government bonds jumped 19 basis points in a single session, their biggest rise since April, triggering a sharp decline in the pound. This context is reminiscent of the episodes of 2022 under Liz Truss, when British fiscal credibility wavered sharply. In the short term, the prospect of an autumn tax hike by Chancellor Rachel Reeves could fuel volatility.
From a technical analysis point of view, the EUR/GBP rate is following an underlying uptrend, and the guarantor of this trend is support at 0.8250. We must therefore keep a close eye on the evolution of British long rates and tax announcements, which will condition the trajectory of the EUR/GBP rate. If British debt continues to worry the market, then the EUR/GBP rate could continue its rise towards resistance at 0.90. Breaking support at 0.8250 would invalidate this chart scenario.
2) The USD/HKD rate is testing the upper end of the PEG defended by the Hong Kong monetary authorities
The USD/HKD rate is once again testing the upper limit of the “peg” set between 7.75 and 7.85 HKD per US dollar. Since the end of June, the weakness of local interest rates, with the one-month Hibor falling to 0.86%, i.e. almost 350 basis points below the cost of the dollar, has encouraged speculative positions against the Hong Kong dollar. To defend parity, the Hong Kong Monetary Authority (HKMA) intervened on several occasions, repurchasing a total of 59 billion Hong Kong dollars and significantly reducing the liquidity of the banking system. The latest operation, for HK$29.6 billion, is testimony to the extent of the pressure on the peg.
For traders, this context offers short-term technical opportunities, by playing the bounces near the upper limit of the convertibility band. Nevertheless, the persistence of a high interest-rate differential between the United States and Hong Kong raises the risk of prolonged tension. In recent years, the Hong Kong Monetary Authority has always succeeded in preventing the 7.85 resistance level from being breached, but caution and risk awareness are required before using this resistance for FX trading strategies.
DISCLAIMER:
This content is intended for individuals who are familiar with financial markets and instruments and is for information purposes only. The presented idea (including market commentary, market data and observations) is not a work product of any research department of Swissquote or its affiliates. This material is intended to highlight market action and does not constitute investment, legal or tax advice. If you are a retail investor or lack experience in trading complex financial products, it is advisable to seek professional advice from licensed advisor before making any financial decisions.
This content is not intended to manipulate the market or encourage any specific financial behavior.
Swissquote makes no representation or warranty as to the quality, completeness, accuracy, comprehensiveness or non-infringement of such content. The views expressed are those of the consultant and are provided for educational purposes only. Any information provided relating to a product or market should not be construed as recommending an investment strategy or transaction. Past performance is not a guarantee of future results.
Swissquote and its employees and representatives shall in no event be held liable for any damages or losses arising directly or indirectly from decisions made on the basis of this content.
The use of any third-party brands or trademarks is for information only and does not imply endorsement by Swissquote, or that the trademark owner has authorised Swissquote to promote its products or services.
Swissquote is the marketing brand for the activities of Swissquote Bank Ltd (Switzerland) regulated by FINMA, Swissquote Capital Markets Limited regulated by CySEC (Cyprus), Swissquote Bank Europe SA (Luxembourg) regulated by the CSSF, Swissquote Ltd (UK) regulated by the FCA, Swissquote Financial Services (Malta) Ltd regulated by the Malta Financial Services Authority, Swissquote MEA Ltd. (UAE) regulated by the Dubai Financial Services Authority, Swissquote Pte Ltd (Singapore) regulated by the Monetary Authority of Singapore, Swissquote Asia Limited (Hong Kong) licensed by the Hong Kong Securities and Futures Commission (SFC) and Swissquote South Africa (Pty) Ltd supervised by the FSCA.
Products and services of Swissquote are only intended for those permitted to receive them under local law.
All investments carry a degree of risk. The risk of loss in trading or holding financial instruments can be substantial. The value of financial instruments, including but not limited to stocks, bonds, cryptocurrencies, and other assets, can fluctuate both upwards and downwards. There is a significant risk of financial loss when buying, selling, holding, staking, or investing in these instruments. SQBE makes no recommendations regarding any specific investment, transaction, or the use of any particular investment strategy.
CFDs are complex instruments and come with a high risk of losing money rapidly due to leverage. The vast majority of retail client accounts suffer capital losses when trading in CFDs. You should consider whether you understand how CFDs work and whether you can afford to take the high risk of losing your money.
Digital Assets are unregulated in most countries and consumer protection rules may not apply. As highly volatile speculative investments, Digital Assets are not suitable for investors without a high-risk tolerance. Make sure you understand each Digital Asset before you trade.
Cryptocurrencies are not considered legal tender in some jurisdictions and are subject to regulatory uncertainties.
The use of Internet-based systems can involve high risks, including, but not limited to, fraud, cyber-attacks, network and communication failures, as well as identity theft and phishing attacks related to crypto-assets.

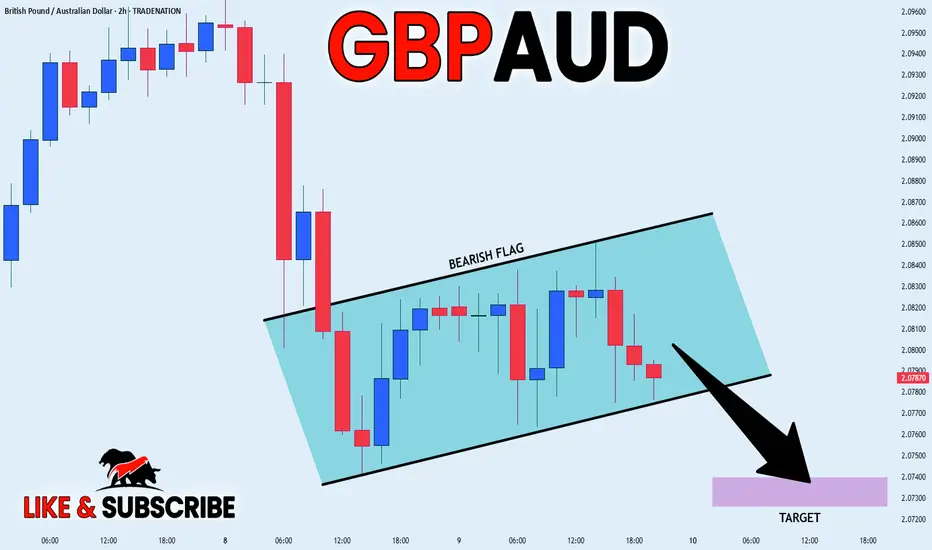
GBP_AUD BEARISH FLAG|SHORT|
✅GBP_AUD is going down now
And the pair has formed
A bearish flag pattern
Which makes me bearish biased
And after the breakout
I believe we will see bearish continuation
SHORT🔥
✅Like and subscribe to never miss a new idea!✅
Disclosure: I am part of Trade Nation's Influencer program and receive a monthly fee for using their TradingView charts in my analysis.
XAU/USD SHORT UNTIL DAILY LOWWaiting for price action to give me a swing high formation or a shift in market structure in my Point Of Interest (POI) and i will have the opportunity going short on Gold with my Target on the draw of liquidity on daily Timeframe with Take profit as follows
Take profit 1 - 3278.84
Take profit 2 - 3270.80
Take profit 3 - 3262.06
And Stop loss @ Swing High
Disclaimer: This is not an investment idea or financial advice. All information provided is for educational and informational purposes only. I am not a licensed financial advisor, and any decisions you make based on this content are done at your own risk. I will not be held responsible or liable for any losses, damages, or risks—financial or otherwise—that may arise from your trading or investment activities. Always do your own research and consult with a qualified financial professional before making any investment decisions.

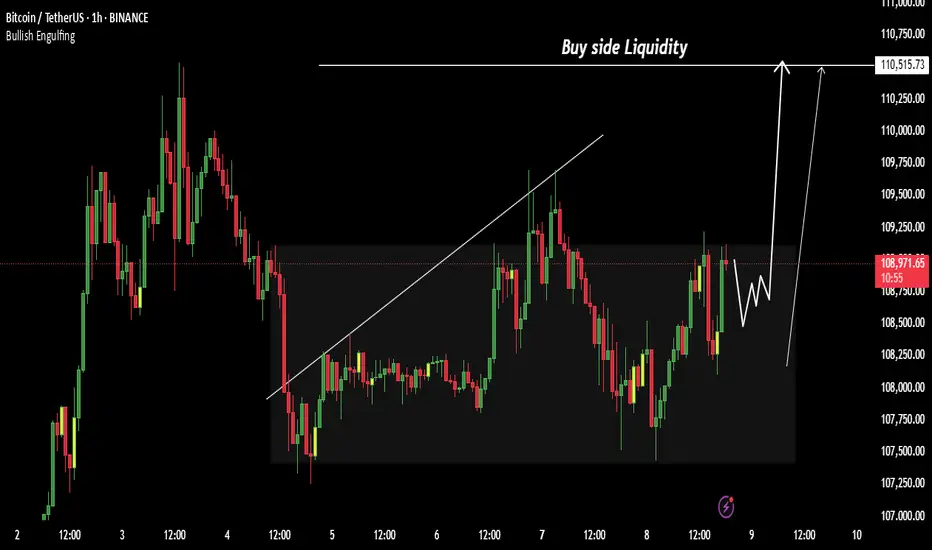
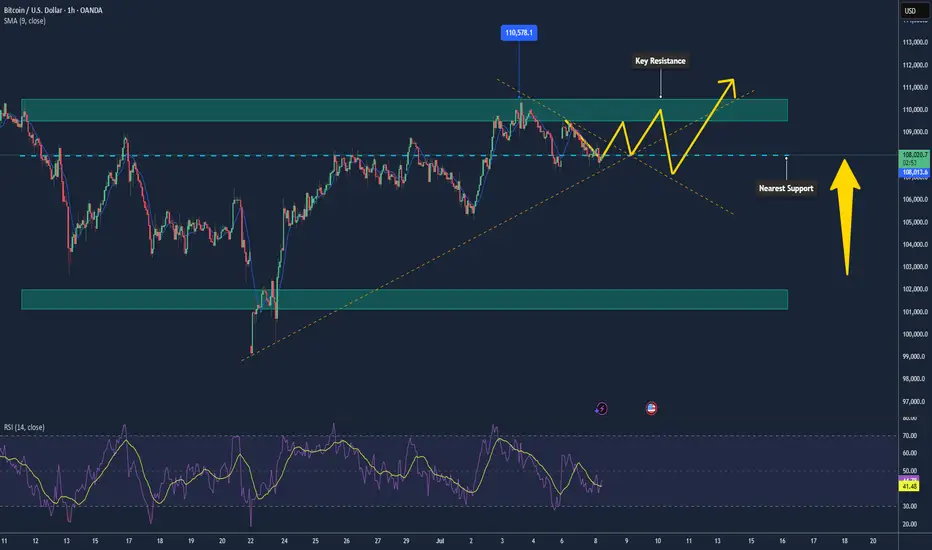
Bitcoin Ranging Below $110k – Poised for a Breakout📊 Market Overview:
Bitcoin is consolidating around $108–109k, reflecting indecision as investors await clearer signals. Institutional ETF inflows remain strong, and recent moves from 2011-era dormant wallets sparked concern but no major sell-off. Positive ETF news or supportive crypto policies could propel the next move upward.
📉 Technical Analysis:
• Major resistance: $109,500 – $110,500
• Nearest support: $108,000; secondary support at $102,000
• EMA09 (1 h): Price is above the 20 EMA and has reclaimed the 200 SMA on the 1 h chart, signaling a technical rebound
• Candlestick / Volume / Momentum: A mild bounce from $108k with low volume; Bollinger Bands show a mid-range price, hinting at sideways action .
📌 Outlook:
Bitcoin may remain range-bound between $108k and $110k. A breakout above $110.5k with strong volume could push toward $112k–115k. Conversely, a break below $108k might trigger a dip toward $102k.
Suggested Trading Strategy
SELL Bitcoin/USD at: 109,000 – 110,000
🎯 TP: 108,000 / 105,000
❌ SL: 110,800
BUY Bitcoin/USD at: 108,000 – 107,500
🎯 TP: 109,500 / 112,000
❌ SL: 107,000
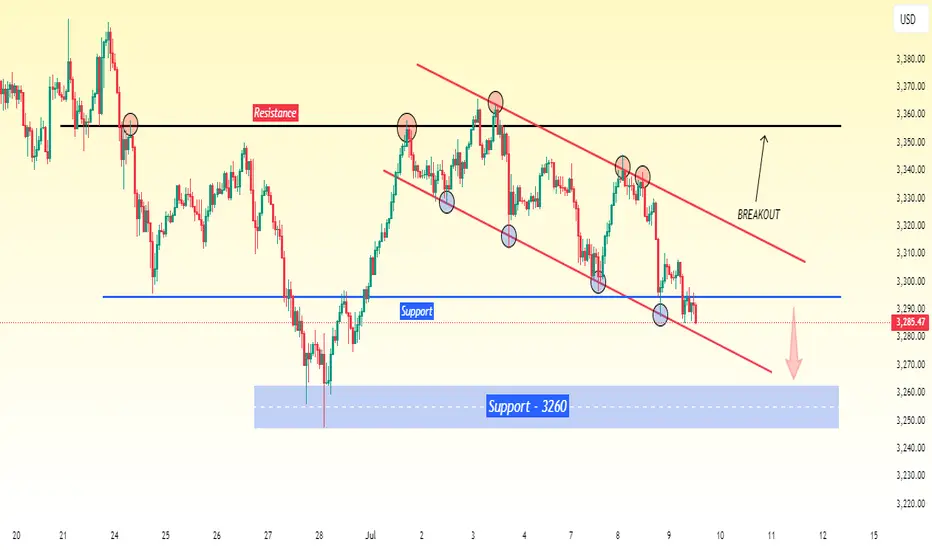
Gold Price Holds Within Channel - Watching for Channel BreakGold is currently moving within a downward sloping channel, reflecting a period of controlled price movement.
If the price continues to follow the channel, it may trend lower in the short term, with the next key support level seen around $3260.
Alternatively, a breakout above the upper boundary of the channel may signal a shift in momentum, opening the way for further upside.
Technical Levels to Watch:
Support: $3260
Resistance: Channel top (watch for breakout confirmation)
Outlook: Continuation within the channel suggests further downside, while a breakout could shift momentum in favor of buyers.