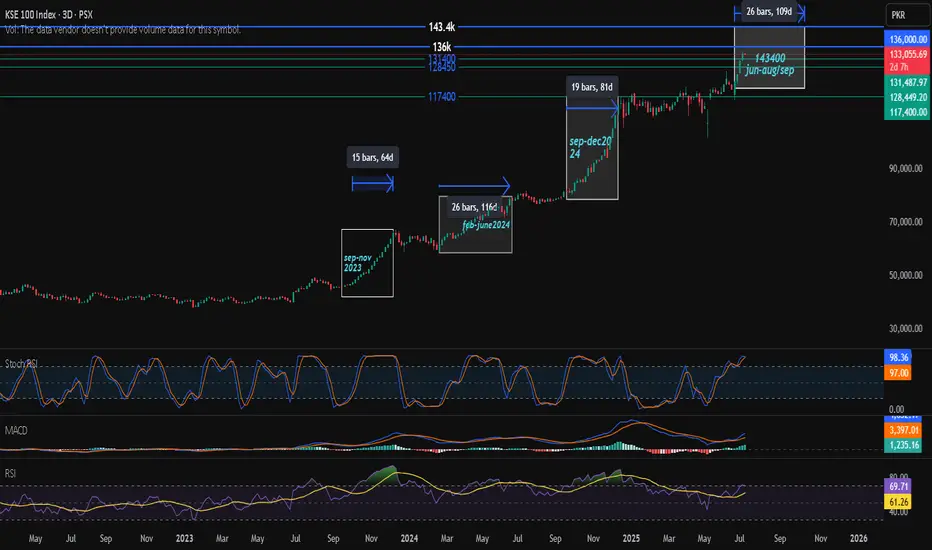
kse 100 indexKSE 100 index has started fresh rally this week. It is expected to break136k sooner after being range bound or taking some correction it will move toward 143k after the news of rate cut. if rate cut not announced then this momentum could slow down or index can take heavy correction but it will ultimately rise till 143k. all the other indicators support this move.
Beyond Technical Analysis
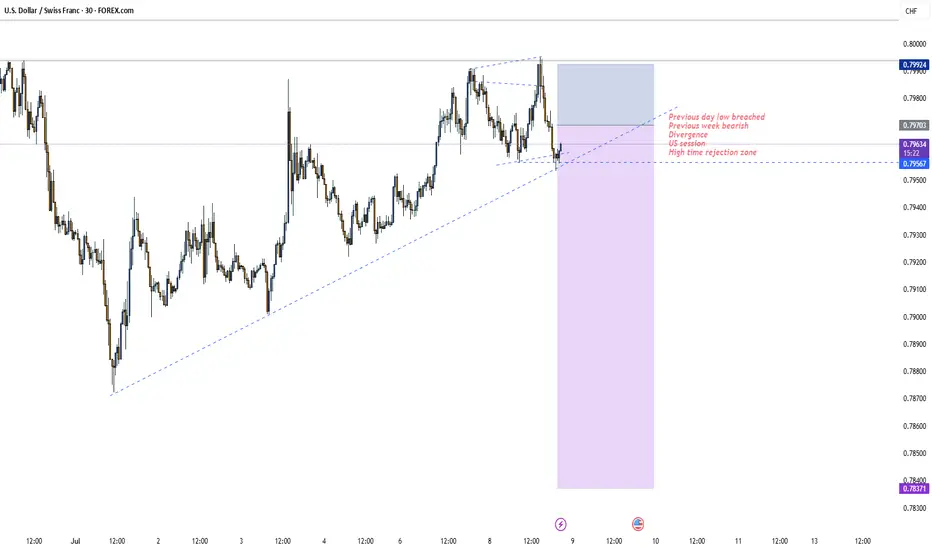
BuyHigher Time Frame Reject Level
Bullish Previous Week
Market Structure Shift Bullish
Asian Session
Trade
Manage
Smile

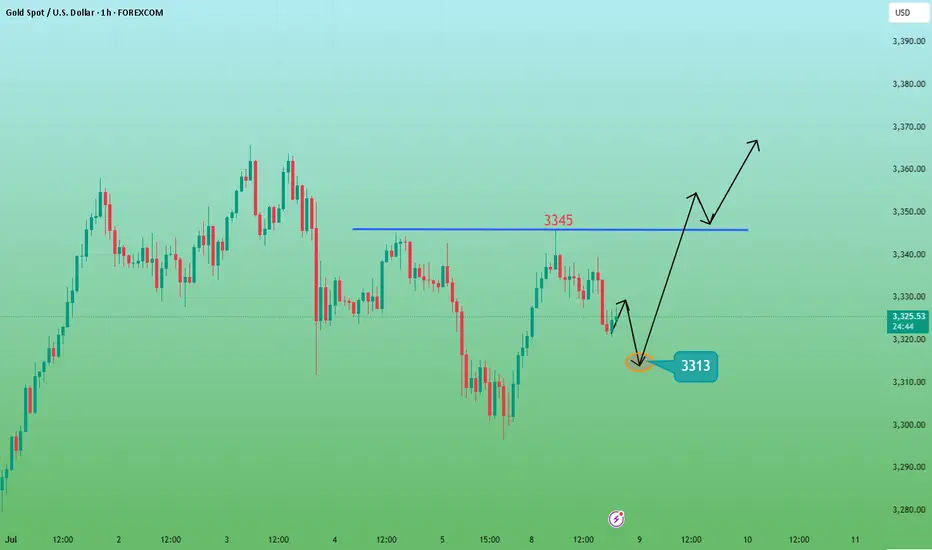
Gold Ranges at $3,330–$3,335 – Ready for the Next Move📊 Market Overview:
Gold is currently trading around $3,330–$3,335/oz, supported by a softer US Dollar and cautious sentiment ahead of key US labor data. According to TradingView, gold is consolidating in a tight range, reflecting market indecision while awaiting a clear breakout signal.
📉 Technical Analysis:
• Key resistance: $3,345–3,350 – a strong supply zone that recently rejected price.
• Nearest support: $3,320–3,330 – multiple bounce points observed here.
• EMA09: Price is hovering around the 09 EMA on both 1h–4h timeframes → neutral/slightly ranging.
• Candlestick / Volume / Momentum:
o A “bearish flag” pattern appears to be forming, suggesting potential for a downside breakout.
o Weak buying volume during upward moves signals limited bullish strength.
📌 Outlook:
• Gold may continue to consolidate between $3,330–$3,345.
• A break above $3,345 with strong volume could open the path to $3,360–$3,380.
• A break below $3,330 could lead to further correction toward $3,300–$3,320.
💡 Suggested Trading Strategy:
SELL XAU/USD at: 3,343 – 3,345
🎯 TP: 40/80/200 pips
❌ SL: 3,355
BUY XAU/USD at: 3,330 – 3,327
🎯 TP: 40/80/200 pips
❌ SL: 3,320

Gold LongsSolid daily structure for Gold heading into the holiday weekend. Bullish going into next week if price closes bullish on the week.
Daily discount SSL swept and closed back inside the range on Monday. Daily OB confirmed on Tuesday. FVG created and inversion fvg confirmed on Wednesday.
Anticipating Thursday to possibly pull back and offer a prime continuation to the upside. I'd like to see the inversion be respected. Price can wick into the BISI but I don't want to see price close below the BISI. That's a red flag.
Targeting Equal Highs.

Copper is finding it's way to 5.5555...Hi all trading lovers and copper buyers...
Seems that copper is continuing its uptrend targeting 5.5555...
PLEASE NOTE THAT IS ONLY AN ANALYSIS...
MARKET IS BASED ON POSSIBILITIES AND UNCERTAINTIES...
#Forex #Trading #Analysis #Copper #Chart #Spike #Wedge #Uptrend

AUD_NZD SWING SHORT|
✅AUD_NZD has been growing recently
And the pair seems locally overbought
So as the pair is approaching a horizontal resistance of 1.0920
Price decline is to be expected
SHORT🔥
✅Like and subscribe to never miss a new idea!✅
Disclosure: I am part of Trade Nation's Influencer program and receive a monthly fee for using their TradingView charts in my analysis.

Daily Analysis- XAUUSD (Wednesday, 9th July 2024)Bias: No Bias
USD News(Red Folder):
-None
Notes:
- No exact bias
- Looking for price to reject
0.5 & 0.382 fib level
- Potential BUY/SELL if there's
confirmation on lower timeframe
- Pivot point: 3280 , 3330
Disclaimer:
This analysis is from a personal point of view, always conduct on your own research before making any trading decisions as the analysis do not guarantee complete accuracy.

FARTCOIN — Choppy Zone, Support Buy Setup1. Choppy price action likely until sale is done
2. Buy on retest and bounce from 1D support ($0.90)
3. Only long above support, stop below $0.90

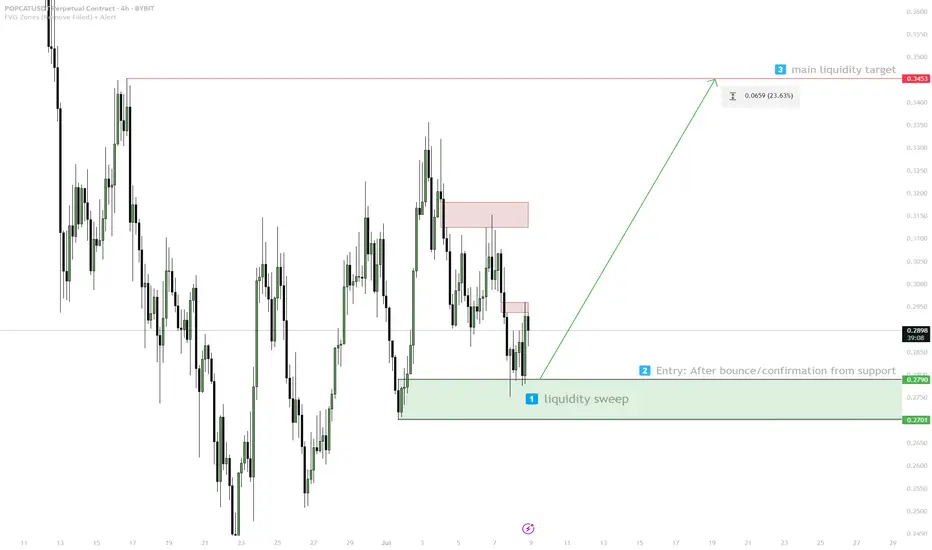
POPCAT — Liquidity Target Play1. Watch for sweep/liquidity grab in 0.270–0.279
2. Enter on confirmed bounce
3. Target: 0.3453 (liquidity zone)
4. Stop: below 0.270 — invalid
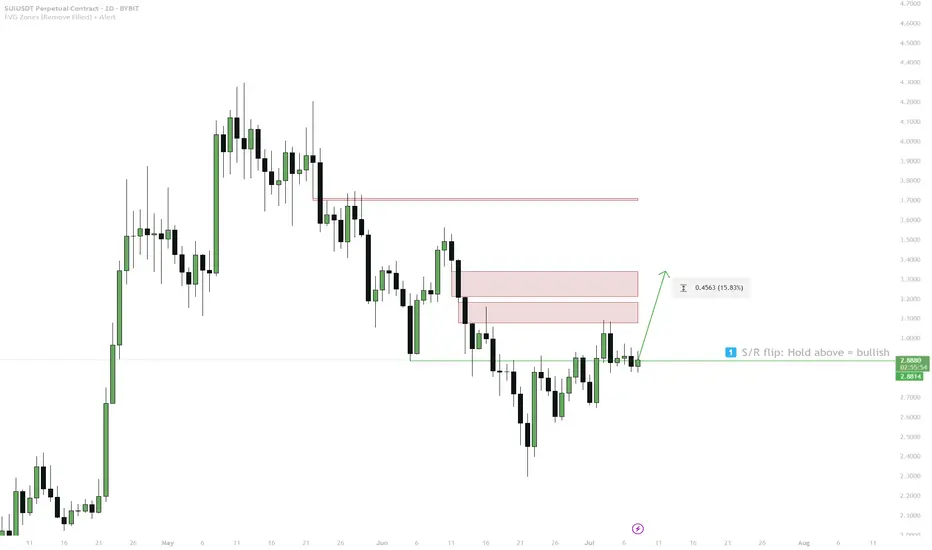
SUI — 1D S/R Flip & FVG Target1. Hold above 1D S/R + BOS (blue box) = bullish bias
2. Entry: Only long above blue box
3. Target: 3.32 (FVG)
4. Stop: Below blue box = invalid
Carvana Leading Auto Retail – Outpacing LAD & AN-Financial Performance & Momentum:
Carvana reported a record-breaking adjusted EBITDA of $488M in Q1 2025, up $253M YoY, with an EBITDA margin of 11.5% (+3.8pp YoY). The company's strong operational efficiency positions it as a leader in the auto retail industry, nearly doubling the margins of competitors like Lithia Motors (LAD) and AutoNation (AN).
- Competitive Positioning & Growth Outlook:
Carvana’s EBITDA quality is superior due to lower non-cash expenses, enhancing long-term sustainability. The company expects sequential EBITDA growth in Q2 and targets 13.5% EBITDA margins within 5-10 years.
-Peer Comparison:
- Lithia Motors (LAD): EBITDA margin at 4.4% (up from 4% YoY), facing tariff-related headwinds that could impact pricing and demand.
- AutoNation (AN): SG&A as a percentage of gross profit rose to 67.5% in Q1, expected to stay between 66-67% in FY 2025, pressuring margins further.
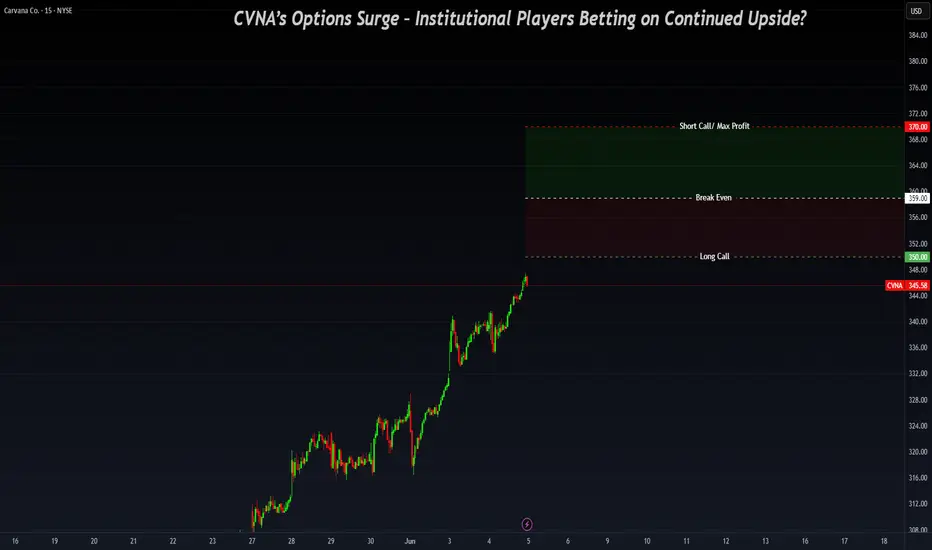
-Options Flow & Institutional Activity - Key Levels: $350/$370
Recent institutional flow activity indicates strong positioning around $350/$370 strikes, potentially signaling a vertical spread in play rather than outright selling:
1️⃣ Momentum Confirmation:
- CVNA has strong upside momentum following its Q1 results, reinforcing a bullish outlook for near-term price action.
- Institutional traders may be accumulating bullish vertical spreads rather than unwinding positions.
Vertical Spread Setup ($350/$370 Strikes)
- Long Call ($350 Strike) → Signals expectations for further upside.
- Short Call ($370 Strike) → Caps max profit while reducing cost.
- Breakeven Price: $359 → CVNA must close above $359 for profitability.
Profit & Risk Zones
- Above $370: Maximum profit achieved.
- Between $359-$370: Partial profit zone (spread remains in play).
- Below $359: Spread loses value, making recovery dependent on extended upside momentum.
UBER longBroken long term resistance, retested, and once again pushed 20 day Donchian Channel.
Turtles are coming out of their shells taking UBER to the new ATHs.
Long term hold.

SellPrevious day low breached
Previous week bearish
Divergence
US session
High time rejection zone
Trade
Manage
Smile
HYPE — Targeting Liquidity Below Monday Low1. While below Monday low — bearish, target liquidity
2. TP1: 35.34
3. TP2: 30.60
4. Above Monday low = scenario invalid

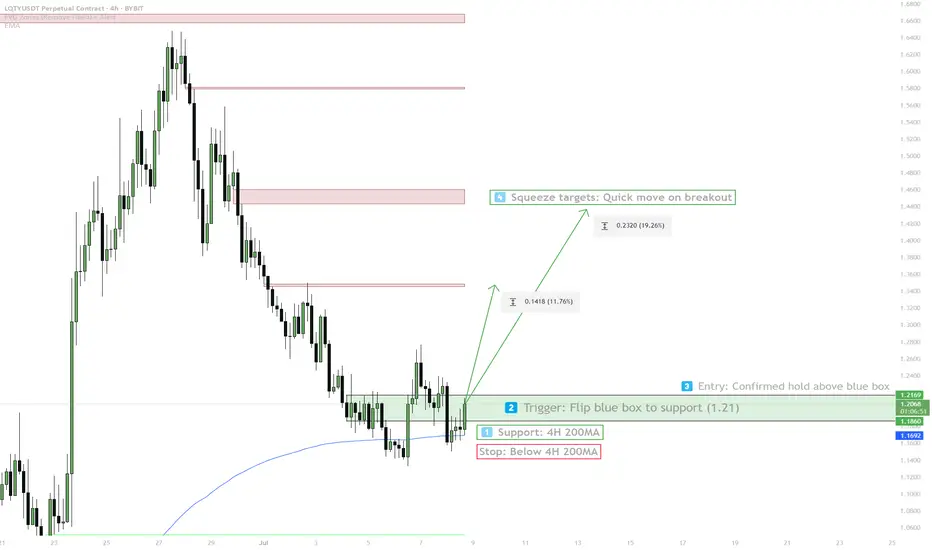
LQTY — 4H 200MA Hold & Squeeze Trigger1. Price holds above 4H 200MA
2. Flip blue box (1.21) to support for entry
3. Entry: Confirmed hold above blue box
4. Squeeze target: Quick move higher
5. Stop: Below 4H 200MA
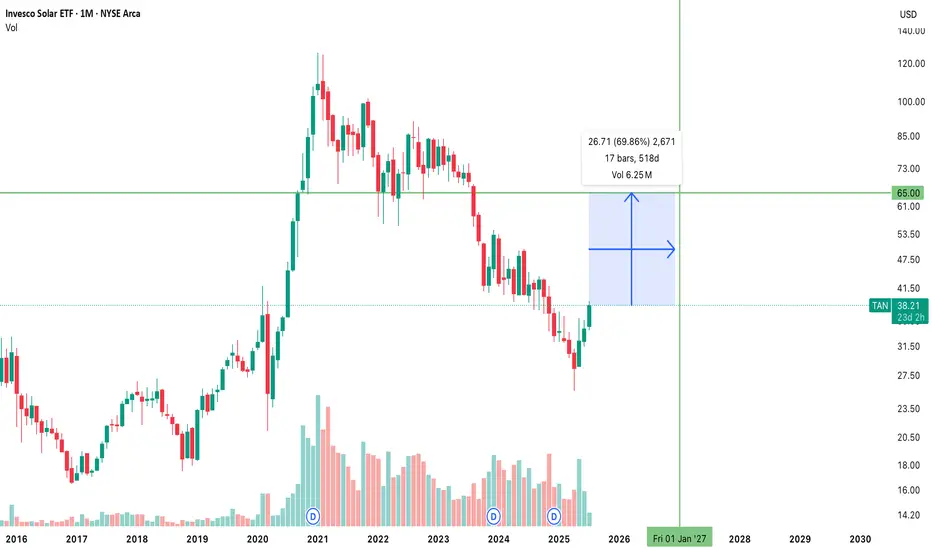
$TAN $65 STRIKE CALLS EXPIRING JAN 15, 2027 (17 MONTHS AWAY)WILL THIS PRINT???
AMERICA WILL RUN INTO A POWER CRISIS 2025-2035
The U.S. power grid is nearing a breaking point as AI, robotics, and data centers drive unprecedented electricity demand. By 2030, data centers could consume 9% of U.S. power, doubling from 2023, with AI queries alone using 10x the energy of a Google search. Robotics and manufacturing add further strain. The grid, however, is unprepared—aging infrastructure, permitting delays, and labor shortages hinder upgrades. Virginia and Texas already face shortages, with grid connection wait times up to 7 years. Renewables can’t scale fast enough without $720B in grid investments. Tech giants’ carbon-neutral goals may falter, relying on fossil fuels. Without urgent action—faster permitting, workforce growth, and innovations like microgrids—power shortages could cripple AI progress and the digital economy.
They can drill baby drill, but the private sector has solar. Tesla should be in this ETF. The US gov't may even print more billions and pump into this sector. ITS BLOODY OBVIOUS.
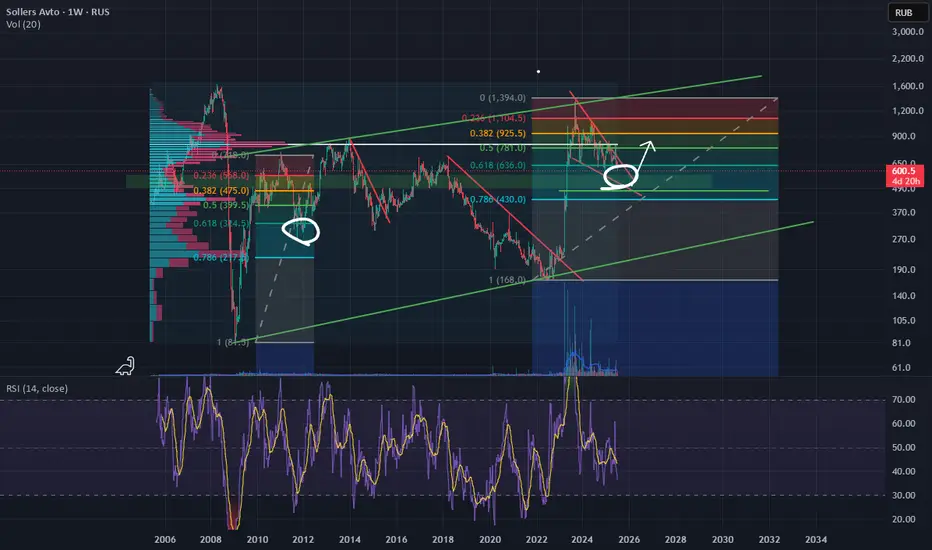
CVI LONGWant to hold this yearly fib level. Has been sideways for years. Hoping for breakout to upside. Will hold if we triple bottom.

The best-looking HTF meme chart, hands down is $PENGUThe team behind the crypto mascot accomplished a lot over the last couple of weeks, and the TA is showing;
- CBOE filing for PENGU ETF
- Appeared at @Nasdaq
- Listed on @eToro
- Listed on @RevolutApp
- Listed on @Official_Upbit
- Listed on @WebullGlobal Pay
- @NASCAR Partnership
- PEZ x Pudgy Penguins Partnership
- Miles & More Partnership
- @PenguClash reached 2M+ on waitlist
- 1B views per day
All this and much more!
@pudgypenguins are doing it the right way 🐧

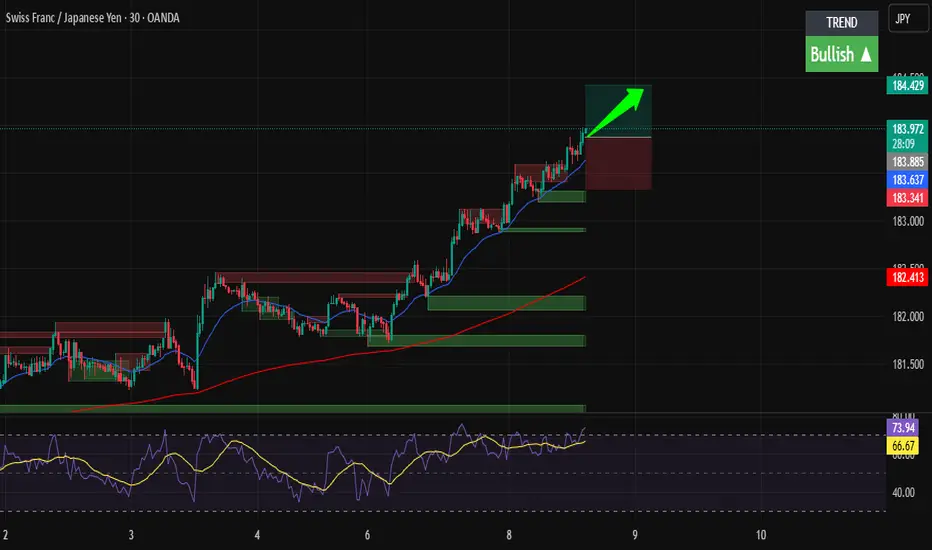
CHF/JPY in Strong Uptrend – Clear Buy Opportunity!Hi traders!, Analyzing CHF/JPY on the 30-minute timeframe, price is currently continuing a strong bullish trend, breaking above recent consolidation and showing momentum to the upside.
🔹 Entry: 183.429
🔹 Take Profit (TP): 184.429
🔹 Stop Loss (SL): 183.341
Price is respecting the 21 EMA and riding it upwards, indicating strong bullish momentum. The RSI is also in the overbought zone, but still climbing, which confirms buyer strength. This setup aligns with the trend continuation and offers a favorable risk-to-reward ratio.
A breakout above the minor resistance and the clear structure of higher highs and higher lows support the bullish idea. Watch for possible reactions near 184.429, where price may face short-term resistance.
⚠️ DISCLAIMER: This is not financial advice. Every trader is responsible for their own decisions and risk management.
XAUUSD NY SESSION FLOW – JULY 8→ 9 , 2025"Structure doesn’t lie. Price answered exactly where we expected it to."
Hey traders 👋
Let’s set the record straight after today’s precision bounce. We saw textbook price action across all sessions — Asia triggered the short from our 3344–3351 HTF supply, and both London and New York followed through with no hesitation, driving price down to 3287.
But here’s the key point:
🧨 3287 was just 10 pips above our clean 3286–3280 buy zone.
No mitigation. Just a front-run.
That’s what real liquidity does — grabs what it needs before the crowd gets in. Our zone is still valid… just untouched.
🔍 HTF BIAS & STRUCTURE UPDATE
📆 Daily Bias:
Structure is still bearish — lower highs, CHoCH, and soft RSI.
EMAs 5/21 are flat. No power for bulls unless 3351 breaks.
⏰ H4 Bias:
New lower high confirmed after rejection from our 3344–3351 zone.
Trend is still bearish unless we reclaim 3330+ with conviction.
Liquidity is driving movement, not news.
🕐 H1 Flow:
Bounce from 3287 = engineered reaction before real demand
Price now hovering above 3306, forming mid-structure
No trade in the middle. Let’s work the edges.
🎯 TODAY’S SNIPER ZONES
🔻 SELL ZONES
1. 3325–3330
Nearest short trap. OB + inefficiency + H1 rejection base.
If price returns, watch M15/M30 for CHoCH or BOS → entry.
2. 3344–3351
Our major HTF supply. Asia already reacted from top half.
If revisited, this zone remains the high-probability rejection zone.
3. 3380–3394
Premium OB + imbalance pocket.
Untouched zone far above — if tapped late in the week, watch for liquidity sweep → clean reversal potential.
🟢 BUY ZONES
1. 3297–3300
NY session bounce zone. Price tapped 3297 → pushed to 3306.
Still live for intraday reentry if price retests and confirms with BOS.
2. 3286–3280
Our true demand base. Price front-ran it by 10 pips — didn’t mitigate.
Still valid, still reactive. Don’t delete this zone.
3. 3263–3255
Last line of support. Deep zone — only comes into play if 3280 fails with conviction.
✅ EXECUTION REMINDERS
Price is hovering mid-range → don’t force entries
Only act if structure reacts at the edges (3325 or 3286)
3380–3394 may be a late-week trap if bulls get overconfident
📌 If this breakdown helped, hit 🚀 and drop a comment:
👉 Are you stalking 3325… or waiting for 3286 to finally wake up?
Let structure talk. You just execute.
GoldFxMinds 💭🔥
📢 Disclosure:
This analysis is based on the Trade Nation TradingView feed. I’m part of their Influencer Program and receive a monthly fee.
⚠️ Educational content only — not financial advice.

Will gold continue to fall?Judging from the current trend of gold, it is weak in the early trading and continues to break lows in the European trading. Then there will be a second bottoming action in the US trading. Pay attention to the 3330 and 3335 areas for short selling before the US trading. Pay attention to the two support levels of 3318-3315 below. The market changes in real time, and it is recommended to operate in real time according to my prompts before the trading!
Copper Cup & Handle Formation - Confirmed by Half-Yearly CloseIn a recent interview, Kevin Warsh, a former Member of Board of Governors Federal Reserve said: “External shocks like wars, pandemics, and supply chain disruptions may cause a spike in prices, that's not inflation. That's more like the weather. Inflation's more like the climate.
Weather refers to the day-to-day state of the atmosphere. A storm may come, but it will eventually pass.
Climate is the long-term average of weather patterns, typically measured over 30 years or more. If the underlying causes of climate change are not addressed, they are likely to affect future weather — for example, storms may become more unpredictable, occur more frequently, and intensify when they happen.
Going back to the financial markets. Have we address the underlying causes of inflation climate today? If not, then with every war or rumors of war or tariff or any unwelcome surprises.
They are likely to become even more volatile than before, some more bullish and the others more bearish.
What is the real cause of inflation climate the world is facing? Debt. At every pit stop, I will keep checking if there’s any chance that U.S. debt might start trending downward. If it does, my existing strategies would have to change. But for now, I’m maintaining these strategies. Here are some examples:
With fears of inflation still in sight, stocks have become more volatile. Since inflation hit a high of 9% in 2022, we’ve seen stock market swings widen.
With fears of inflation, bonds are under pressure. The drop in U.S. bonds wasn't triggered by the “Liberation Day” tariff announced on 2nd April alone. In fact, bonds peaked in 2020 and broke below their main uptrend support when inflation hit 9%.
With fears of inflation are also driving commodities higher — from “weather” to “weather,” so to speak. I’ve been covering gold, bitcoin, silver, and soybean oil. Today, copper looks interesting to me. Let’s dive into the technical. I find the half-year chart particularly interesting.
On this half yearly chart. We can see as the close on 30th June, copper settled firmly, closed above its $4.44 resistance that has been tested for years. This study indicates that copper could be at the beginning of an uptrend. I will be looking out for buying-on-dips opportunities whenever they arise.
What Began Well, Grew Risky — Yet Opportunity Awaits. Besides debt, there are two other key elements that may trigger fears of inflation from time to time. What do you think they are?
I would like to hear your thoughts on this.
Video version:
Mirco Copper Futures
Ticker: MHG
Minimum fluctuation:
0.0005 per pound = $1.25
Disclaimer:
• What presented here is not a recommendation, please consult your licensed broker.
• Our mission is to create lateral thinking skills for every investor and trader, knowing when to take a calculated risk with market uncertainty and a bolder risk when opportunity arises.
CME Real-time Market Data help identify trading set-ups in real-time and express my market views. If you have futures in your trading portfolio, you can check out on CME Group data plans available that suit your trading needs www.tradingview.com
Trading the Micro: www.cmegroup.com
www.cmegroup.com

Weekly CRT on XauusdBuy the dip bros
The gold will fly
Just find entry and keep buying
Retracement, buy
buy
buy
buy and buy
Don't go to far trying to sell the market
The real direction is up
Confluences for buy:
20 day ipda range sweep of the previous day low
Weekly CRT
CRL was swept
1 hour cisd
Targeting CRH and ATH
