NIO Charging UpNIO looking 🔥
Up up up — this weekly dip is a gift.
Strong support holding, volume picking up, and momentum building.
This is a textbook buy point on the weekly.
Charging up for the next run. ⚡️
Beyond Technical Analysis

TSLA Go! Up up up! 🚀
This is a weekly buy point — the dip is looking real pretty 👀
Patience pays. Loading up before the next leg up.

Bullish Breakout from Falling Wedge | Upside Potential Ahead!Market Overview:
The Bitcoin (BTC/USD) 4-hour chart is displaying a Falling Wedge pattern, a well-known bullish reversal structure. This indicates that the downtrend is weakening, and a potential breakout could lead to a strong upside move.
🔹 Key Technical Analysis
1️⃣ Falling Wedge Formation & Breakout
Bitcoin has been trading inside a falling wedge, marked by lower highs and lower lows, signaling a contraction in volatility.
A breakout above the upper trendline of the wedge is forming, suggesting a bullish reversal and the start of an uptrend.
Falling wedges typically lead to a rally equal to the height of the pattern, giving a measured move target of $114,334.
2️⃣ Price Action & Confirmation Levels
A clean breakout above $87,000 would confirm bullish momentum.
If price successfully retests the wedge’s upper boundary and holds support, further bullish continuation is expected.
The psychological level of $100,000 could act as an interim resistance before the final target is reached.
3️⃣ Upside Target & Resistance Zones
The measured move suggests a potential rally towards $114,334, aligning with previous resistance zones.
This target represents a 30.55% gain from the breakout level.
Traders should watch for pullbacks and retests as part of the breakout confirmation.
📈 Trading Plan - Long Setup
🔹 Entry: Look for a confirmed breakout above $87,000, or a retest of support.
🔹 Stop Loss: Below $84,000, protecting against false breakouts.
🔹 Take Profit: $100,000 - $114,334 (previous resistance & measured move target).
🔹 Risk-Reward Ratio: Strong bullish setup with favorable upside potential.
🛑 Risk Factors to Consider
⚠️ A failed breakout and a drop below $83,000 would invalidate the bullish setup.
⚠️ External factors such as macroeconomic events, regulatory news, and BTC ETF developments could influence volatility.
Final Thought
The breakout from the falling wedge signals a potential bullish continuation for Bitcoin, with targets set around $114,334. Traders should watch for confirmation above $87,000 and manage risk accordingly.

Buy BitcoinThe idea that Bitcoin (BTC) and Ethereum (ETH) tend to go up around 70 days after global liquidity (M2) increases is based on how liquidity drives risk asset prices—especially in speculative markets like crypto. Here's a breakdown of why this happens, particularly with the 70-day lag:
🔍 What is M2 Global Liquidity?
M2 includes:
Cash
Checking deposits
Savings accounts
Other near-money assets
When global M2 increases, it usually means central banks are easing (e.g., lowering rates, injecting liquidity), which tends to:
Increase money supply
Lower the cost of capital
Make riskier assets more attractive
💸 Why Does BTC/ETH React to M2?
Crypto = High-Beta Asset Class
BTC and ETH are risk-on assets, meaning they thrive when:
Investors are optimistic
There's more disposable capital floating around
Liquidity Flows Down the Risk Curve
When liquidity enters the system:
It first boosts safe assets (e.g., bonds, large-cap stocks)
Then mid-cap equities
Finally flows into speculative plays like crypto
Crypto’s Reaction is Delayed (~70 Days)
This 70-day lag happens because:
Institutions take time to reallocate capital
Retail follows after they see initial market strength
It takes time for M2 to affect sentiment, demand, and actual buying
📊 Empirical Backing
Analysts like Arthur Hayes, Macro Alf, and others have noted:
BTC price often correlates with global M2, with a lag of 60–90 days
Crypto tends to front-run rate cuts, but lags money supply changes
⏱️ Summary: Why the 70-Day Lag?
Cause Effect
Global M2 rises Money becomes more available
Institutions adjust portfolios Risk-on flows begin
Investors re-enter crypto Demand for BTC/ETH increases
~70 days later BTC/ETH prices begin to climb

XAG/USD Bullish Setup - Falling Wedge Breakout Towards TargetChart Overview
Asset: Silver / U.S. Dollar (XAG/USD)
Timeframe: 1-hour (1H)
Date and Time: Published on April 2, 2025, at 11:17 UTC
Publisher: GoldMasterTraders on TradingView
Current Price (at the time of the chart):
Open: 33.82300
High: 33.89005
Low: 33.79435
Close: 33.88880
Change: -0.05780 (-0.20%)
Price on the Right Axis: The price scale ranges from approximately 32.80000 to 35.25000, with the current price around 33.88880.
Chart Elements and Technical Analysis
1. Candlestick Price Action
The chart displays a 1-hour candlestick representation of XAG/USD, showing price movements from late March to early April 2025.
Trend Context:
Prior to the formation of the pattern, the price experienced a sharp rally from around 32.80000 (March 21) to a high near 34.60000 (March 27). This indicates a strong bullish trend.
Following this rally, the price entered a consolidation phase, forming lower highs and lower lows, which is characteristic of the Falling Wedge pattern.
Recent Price Action:
On April 2, the price appears to have broken out of the wedge pattern, closing above the upper trendline with a strong bullish candle. The current price of 33.88880 is above the breakout level, suggesting a potential continuation of the uptrend.
2. Chart Pattern: Falling Wedge
Pattern Identification:
The chart highlights a Falling Wedge pattern, a bullish chart pattern that can act as either a reversal or continuation pattern. In this case, given the preceding uptrend, it’s likely a continuation pattern.
A Falling Wedge is characterized by two converging trendlines:
Upper Trendline (Resistance): Connects the lower highs, sloping downward.
Lower Trendline (Support): Connects the lower lows, also sloping downward but at a less steep angle than the upper trendline.
The wedge started forming around March 27, after the price peaked near 34.60000, and continued until the breakout on April 2.
Pattern Dynamics:
The narrowing range between the trendlines indicates decreasing selling pressure and a potential buildup of buying interest.
Falling Wedges typically resolve with a breakout to the upside, as the price breaks above the upper trendline, signaling a resumption of the prior trend (bullish in this case).
Breakout Confirmation:
The price broke above the upper trendline of the wedge on April 2, with a strong bullish candle closing at 33.88880. This breakout is a key signal for a potential upward move.
The breakout level appears to be around 33.85000–33.90000, and the price is currently holding above this level, which is a positive sign for bulls.
3. Key Support and Resistance Levels
Support Level:
A horizontal support zone is marked around 33.58553 (approximately 33.58–33.60).
This level acted as a significant support during the wedge formation, with the price bouncing off this zone multiple times (e.g., on March 28 and March 31).
The support level aligns with the lower boundary of the wedge, reinforcing its importance as a key area of buying interest.
Resistance Level:
A resistance zone is marked around 34.60000 (approximately 34.60–34.80).
This level corresponds to the high reached on March 27, before the wedge formation began. It represents a significant barrier where selling pressure previously emerged.
After the breakout, the price is expected to test this resistance as part of the bullish move.
Target Level:
The target for the breakout is projected at 34.82470 (approximately 34.82).
This target is likely calculated using the standard method for wedge patterns: measuring the height of the wedge at its widest point (from the highest high to the lowest low within the pattern) and projecting that distance upward from the breakout point.
The target of 34.82470 is just above the resistance zone, suggesting that a break above 34.60000 could lead to further upside toward this level.
4. Stop Loss and Risk Management
Stop Loss:
The stop loss is suggested below the support level at 33.58553.
Placing the stop loss below this level ensures that if the breakout fails and the price falls back into the wedge, the trade is exited with a controlled loss.
The distance from the breakout level (around 33.90000) to the stop loss (33.58553) is approximately 0.31447, which represents the risk on the trade.
Risk-Reward Ratio:
The chart indicates a risk-reward ratio of 0.9467 (2.80% / 9,469.7).
The potential reward is the distance from the breakout level (33.90000) to the target (34.82470), which is approximately 0.92470, or a 2.80% gain.
The risk is the distance to the stop loss (0.31447), making the risk-reward ratio approximately 2.94:1 (0.92470 / 0.31447), which is favorable for a trading setup.
5. Additional Annotations
Arrows and Labels:
A blue arrow labeled “Falling Wedge” points to the pattern, clearly identifying it for viewers.
A green arrow labeled “Support Level” points to the 33.58553 zone, indicating where buyers have stepped in.
A red arrow labeled “Resistance Level” points to the 34.60000 zone, highlighting the next significant barrier.
A blue arrow labeled “Target” points to 34.82470, showing the projected price objective.
A blue arrow labeled “Stop Loss” points to 33.58553, indicating the risk management level.
Price Labels on the Right Axis:
The right axis shows key price levels, with the current ask price at 33.89900 (red) and bid price at 33.88558 (black), reflecting the live market spread.
Trading Setup Breakdown
Based on the chart, here’s the detailed trading setup:
Entry:
Position: Long (buy) XAG/USD.
Entry Point: The setup suggests entering after the price breaks out above the upper trendline of the Falling Wedge, which occurred around 33.85000–33.90000 on April 2.
Confirmation: The breakout is confirmed by a strong bullish candle closing above the trendline, with the current price at 33.88880, slightly below the high of 33.89005 but still above the breakout level.
Traders might wait for a retest of the breakout level (now acting as support) for a safer entry, though this isn’t explicitly suggested in the chart.
Stop Loss:
Level: Place the stop loss below the support level at 33.58553.
Rationale: This placement protects against a false breakout. If the price falls back below the wedge’s upper trendline and breaches the support, the bullish thesis is invalidated, and the trade should be exited.
Risk: The distance from the entry (33.90000) to the stop loss (33.58553) is 0.31447, or approximately 0.93% of the entry price.
Take Profit/Target:
Level: The target is set at 34.82470.
Rationale: This target is derived from the height of the wedge projected upward from the breakout point. It also aligns with a logical extension beyond the resistance at 34.60000.
Reward: The distance from the entry (33.90000) to the target (34.82470) is 0.92470, or approximately 2.80% of the entry price.
Risk-Reward Ratio:
The risk-reward ratio is approximately 2.94:1, which is attractive for a trading setup. For every unit of risk (0.31447), the potential reward is nearly 3 units (0.92470).
Trade Management:
Trailing Stop: Once the price approaches the resistance at 34.60000, traders might consider trailing the stop loss to lock in profits, especially if the price shows signs of stalling.
Partial Profit Taking: Some traders might take partial profits at the resistance level (34.60000) and let the remaining position run toward the target.
Broader Market Context
Trend Analysis:
The broader trend before the wedge was bullish, as evidenced by the rally from 32.80000 to 34.60000. The Falling Wedge, therefore, acts as a consolidation within this uptrend, and the breakout suggests a continuation of the bullish trend.
The price action after the breakout will be critical. A strong move toward 34.60000 with high volume would confirm the bullish momentum.
Volume and Momentum:
The chart doesn’t display volume or momentum indicators (e.g., RSI, MACD). However, a typical confirmation of a Falling Wedge breakout includes:
Volume: An increase in volume on the breakout candle, indicating strong buying interest.
Momentum: A bullish signal from indicators like RSI (e.g., moving above 50 or 70) or MACD (e.g., a bullish crossover).
Traders should check these indicators to validate the breakout’s strength.
Market Factors:
Silver prices are influenced by factors like U.S. dollar strength, interest rates, inflation expectations, and geopolitical events. On April 2, 2025, traders should consider:
U.S. Dollar Index (DXY): A weakening dollar typically supports higher silver prices.
Economic Data: Key releases like U.S. non-farm payrolls, inflation data, or Federal Reserve statements around this time could impact silver.
Geopolitical Events: Any risk-off sentiment (e.g., due to global tensions) could drive safe-haven demand for silver.
Potential Risks and Considerations
False Breakout:
If the price fails to hold above the breakout level (33.85000–33.90000) and falls back into the wedge, the setup is invalidated. The stop loss at 33.58553 mitigates this risk.
Resistance at 34.60000:
The resistance level has previously capped the price, and there’s a risk of rejection at this level. Traders should watch for bearish price action (e.g., a shooting star or bearish engulfing candle) near 34.60000.
Market Volatility:
Silver can be volatile, especially on a 1-hour timeframe. Unexpected news or economic data could lead to sharp price swings, potentially triggering the stop loss prematurely.
Timeframe Limitations:
This is a short-term setup on a 1-hour chart, so the target might be reached within hours to a couple of days. However, intraday noise could lead to choppy price action, requiring active trade management.
Conclusion
The TradingView chart by GoldMasterTraders presents a well-structured bullish trading setup for XAG/USD based on a Falling Wedge pattern. The price has broken out above the wedge’s upper trendline on April 2, 2025, signaling a potential move toward the target of 34.82470. Key levels include support at 33.58553 (where the stop loss is placed) and resistance at 34.60000, which the price must overcome to reach the target. The setup offers a favorable risk-reward ratio of approximately 2.94:1, making it an attractive trade for short-term traders.
However, traders should confirm the breakout with additional indicators (e.g., volume, RSI) and monitor broader market conditions, as this chart is a snapshot from April 2, 2025, and market dynamics may have evolved since then. If you’d like to search for more recent data on XAG/USD or check the outcome of this setup, I can assist with that!

Gold (XAU/USD) Bullish Breakout: Next Target $3,181?"Key Observations:
Current Price: Gold is trading at $3,127.450 at the time of the chart.
Trend: The chart exhibits a strong uptrend, with higher highs and higher lows.
Support Levels: Several support levels are marked in the $3,010 - $2,999 range, extending down to around $2,906.
Resistance and Target:
The immediate price range is highlighted, suggesting possible consolidation.
A breakout above this range could lead to a target around $3,181.
Chart Annotations:
A retracement (red structure) indicates a short-term correction before continuation.
A breakout structure (black lines) suggests a previous significant upward movement.
The range and possible continuation are marked, indicating that the price may consolidate before attempting to reach the target.
Trading Perspective:
If price holds above the range, we may see bullish continuation towards $3,181.
A break below support levels could signal a deeper pullback towards $3,010 or lower.
This chart suggests a bullish outlook, with potential for more upside if momentum continues. Traders might look for confirmations before entering long positions.

(ETH/USD) Breakout from Falling Wedge – Bullish Momentum Ahead?Ethereum (ETH/USD) Breakout from Falling Wedge – Bullish Momentum Ahead?
This 4-hour Ethereum chart shows a breakout from a falling wedge pattern, a bullish reversal formation. The price has started forming higher lows, signaling potential upside movement. The projected target is around $2,411, indicating a significant recovery.
A successful retest of the breakout level could confirm further upward momentum. Traders may consider long positions while monitoring resistance levels.
📌 Key Levels:
Support: ~$1,879
Target: ~$2,411
Resistance Zones: $2,100 - $2,200
Would you like me to refine this further? 🚀

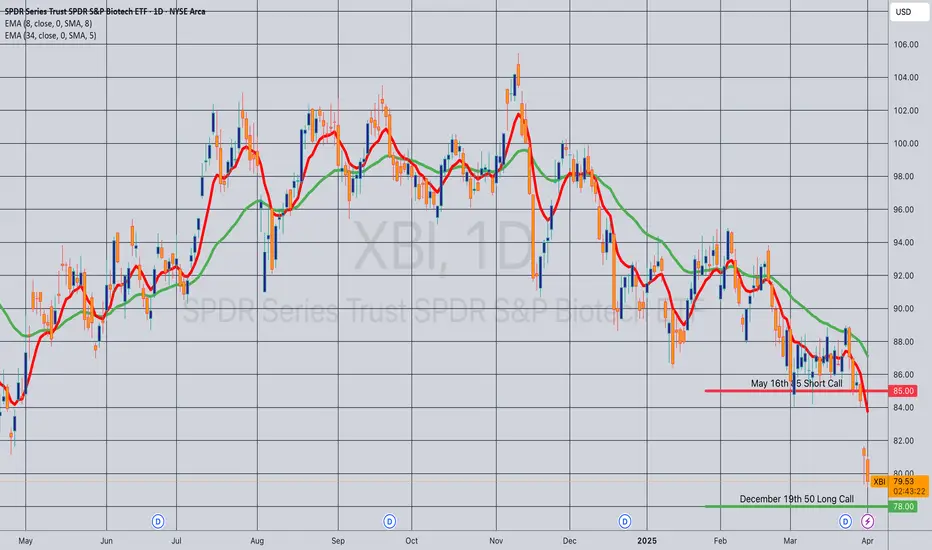
Opening (IRA): XBI May 16th -85C/December 19th 50C LCD*... for a 29.50 debit.
Comments: Adding to my XBI position at or near 52-week lows, buying the back month 90 delta and selling the front month -30 delta that pays for all of the extrinsic in the long. (The 50C is depicted at a higher strike so that it fits on the chart).
Metrics:
Buying Power Effect: 29.50
Max Profit: 5.50
ROC at Max: 18.64%
50% Max: 2.25
ROC at 50% Max: 9.37%
Will generally look to take profit at 50% max and/or roll out short call to reduce downside break even.
* -- Long call diagonal.
Gold and Elliott Wave Theory.Wave 2(Green) was a Zigzag and we should expect a Flat correction for a Wave 4. An A Wave forms shortly after Wave 3 was formed and a Wave B should follow. B's have 3 waves-- two impulses and one corrective-- and in this case Wave A was a simple Wave that was corrected by a Flat for B(Black). Our last impulse is a 5 Wave move and is marked in Black. We are currently on Wave 4 which will be a Flat because 2 was a zigzag. We are currently on the last phases of the B wave(Blue) that comes before a C(Blue) also a 4(Black) in this case. A retest at the 261.8% would spark a Wave 4.

short term long oppertunityit looks like we have settled for a bit and ready to start moving towards TP 1 in the new cycle I just opened a long position that ,i will be looking to sell between may 7th and may 18th

The Coming Bitcoin Death CrossThe Bitcoin daily price chart will likely show a death cross within the next week. In the above chart, I have extended both the 50-day and 200-day SMAs based on their current trajectory. The result shows that they will intersect on or around the 7th of April.
Even though the death cross seems inevitable, does that necessarily mean that the bullish phase of this market cycle is over? In my opinion, it is still a little too early to make that call. We only have to look back at the previous market cycle for an example where a death cross didn't lead to the death of the market cycle.
Looking at the chart above, we can see that Bitcoin experienced a death cross following the first peak in April 2021. About three months later, a golden cross formed, which led to the final market cycle peak in November 2021. We can also see that in this current market cycle, there have been two other instances where death crosses have occurred. Both were followed two to three months later by golden crosses, which ended consolidation phases and led to substantial price increases over the following months.
As I see it, there are now two possible scenarios for this market cycle.
The first is that Bitcoin's price peak on January 20th was the market cycle peak, and Bitcoin is now in the bear market phase of this market cycle.
The second scenario is that the peak for this market cycle has not yet occurred, and we will we will see a similar outcome as the two previous death cross-golden cross occurrences earlier in this market cycle.
I am also still watching the Stochastic RSI indicator on the monthly chart. What I have noticed is that when the Stochastic RSI reading has dropped substantially below the "20" level, that has signaled that the previous price peak was the peak of that market cycle.
Looking at this chart, we can see that the Stochastic RSI is currently at 11.31 however, this can change. If the price of BTC can substantially increase over the next few weeks, it is possible that when April's monthly candle closes, the Stochastic RSI reading could be back over the "20" level.
If, however, the Stochastic RSI reading is substantially below the "20" level when the April candle closes, then based on previous history, I would have to conclude that Bitcoin's price peak on January 20th was the market cycle peak.
I am trying to remain hopeful that the bullish phase of this market cycle will resume at some point while still keeping an open mind to other possibilities.
What are your thoughts? Do you agree, or is my analysis flawed?

BTC/USD Bullish Breakout from Rectangle PatternOverview:
The chart represents Bitcoin's price action against the US Dollar on the 1-hour timeframe, highlighting a Rectangle Pattern Breakout with a well-structured trade setup. This analysis will break down the pattern, key levels, and possible trading scenarios.
1️⃣ Chart Pattern Breakdown – Rectangle Consolidation
The price has been moving within a rectangle pattern (range-bound movement), where Bitcoin found support at lower levels and faced resistance at the upper boundary.
Rectangle Pattern: A continuation/consolidation pattern where price fluctuates between horizontal resistance and support before breaking out.
Curve Formation: The price action within the rectangle also forms a rounding bottom, indicating a potential shift from bearish to bullish sentiment.
Breakout Confirmation: BTC has broken out from the rectangle, suggesting bullish momentum.
2️⃣ Key Technical Levels
🔹 Support Level ($84,110)
This zone has acted as a strong demand area, preventing the price from falling further.
Buyers consistently stepped in at this level, making it a significant psychological floor for Bitcoin.
🔹 Resistance Level ($86,850 - $87,000 Zone)
This level had previously rejected upward movements, leading to multiple price pullbacks.
After the breakout, this area is expected to act as a new support level upon a retest.
🔹 Target Price ($89,931 – Next Resistance Zone)
If the breakout sustains, the next key target for bulls is around $89,931, based on prior resistance zones and technical projections.
🔹 Stop Loss ($84,110 – Below Support Zone)
A stop loss below the support zone ensures risk management in case of a false breakout.
3️⃣ Trading Strategy & Execution
📌 Entry Point – After price confirms the breakout above the rectangle’s resistance. Traders should wait for:
A pullback and retest of the broken resistance, which should now act as support.
A strong bullish candle confirming continuation.
📌 Take Profit (TP) – $89,931, based on historical resistance levels and price projection from the rectangle range.
📌 Stop Loss (SL) – Placed at $84,110, below the rectangle’s previous support zone to minimize downside risk.
📌 Risk-to-Reward Ratio (RRR) – The setup offers a favorable RRR, meaning potential profits outweigh the risks.
4️⃣ Market Sentiment & Additional Factors
✔ Bullish Outlook – The breakout signals strong buying interest and potential upside continuation.
✔ Volume Confirmation – Traders should monitor volume spikes during the breakout to confirm institutional participation.
✔ Economic Events & News – External factors like macroeconomic data or Bitcoin-related news can impact price action.
Conclusion – BTC/USD Trading Setup
Pattern Identified: Rectangle Pattern Breakout
Current Trend: Bullish breakout from consolidation
Trade Type: Long position (Buy setup)
Key Levels:
✅ Support: $84,110
✅ Resistance: $86,850 - $87,000
✅ Target: $89,931
✅ Stop Loss: $84,110
🔥 Final Thought : Bitcoin has broken out of a key consolidation range, signaling a bullish move towards $89,931. Traders should wait for confirmation and manage risk accordingly! 🚀📈

Silver (XAG/USD) - Bearish Breakdown from Rising Wedge!Market Overview:
The Silver (XAG/USD) 1-hour chart reveals a Rising Wedge pattern, which is a well-known bearish reversal formation. This suggests that the recent bullish trend is losing momentum, and a breakdown could lead to a significant price decline.
🔹 Key Technical Analysis
1️⃣ Rising Wedge Formation & Breakdown
The price has been moving within a rising wedge, characterized by higher highs and higher lows but with weakening momentum.
A breakdown has occurred, confirming the bearish structure as the price has failed to sustain higher levels.
Historically, when a rising wedge breaks to the downside, price tends to drop by the same height as the wedge itself, which aligns with our projected target zone.
2️⃣ Price Action & Retest Possibility
After the breakdown, a retest of the broken wedge support (now resistance) around $33.50 - $33.80 could provide a potential short-selling opportunity.
If price fails to reclaim the wedge support, further downside pressure is expected.
3️⃣ Downside Target & Support Zone
The measured move suggests a decline towards the $31.00 - $30.60 region, which coincides with a strong historical support zone.
This area is highlighted as a potential profit-taking level for short trades.
📉 Trading Plan - Short Setup
🔸 Entry: Look for a rejection from the $33.50 - $33.80 zone (previous wedge support, now resistance).
🔸 Stop Loss: Above $34.00 to protect against false breakouts.
🔸 Take Profit: $31.00 - $30.60 (previous demand area).
🔸 Risk-Reward Ratio: Favorable setup, ensuring proper risk management.
🛑 Risk Factors to Consider
⚠️ If Silver regains strength and breaks back above $34.00, it could invalidate the bearish breakdown and shift momentum back to the upside.
⚠️ Macroeconomic events such as inflation data, Fed speeches, or geopolitical factors could influence price action unpredictably.

XAUUSD Head & Shoulders Breakdown – Bearish Target Ahead?This chart represents a detailed technical analysis of Gold Spot (XAU/USD) on the 1-hour timeframe with a structured trade setup based on a Head and Shoulders (H&S) reversal pattern. Below is an in-depth explanation of the chart components, price action, and trade strategy.
1️⃣ Key Chart Patterns and Analysis
A. Head and Shoulders Pattern (Bearish Reversal)
This is a well-known bearish reversal pattern that signals a potential trend change from bullish to bearish. It consists of three peaks:
Left Shoulder: A rise followed by a temporary pullback.
Head: The highest peak in the pattern, showing strong buying pressure before reversal.
Right Shoulder: A smaller rise compared to the head, indicating weakening bullish momentum.
B. Neckline (Support Level) and Breakdown Confirmation
The neckline (horizontal support level) is drawn across the lowest points between the shoulders.
A break below the neckline confirms the reversal, triggering a bearish move.
The chart suggests price is at the neckline zone, preparing for a breakdown.
2️⃣ Trendline and Support/Resistance Analysis
A. Uptrend Trendline Break
The price was following a strong ascending trendline (dotted black line).
A trendline breakout has occurred, indicating potential trend reversal.
This supports the bearish bias further.
B. Resistance and Support Levels
Resistance Level: Marked at the top of the Head region, which aligns with previous price rejection zones.
Support Levels:
First support (TP1 - 3,053.269): This is the first potential take profit level.
Second support (TP2 - 3,030.556): The next target if price continues downward.
3️⃣ Trade Setup & Risk Management
A. Entry Point (Short Position)
Sell (Short) after the neckline breakout, ensuring bearish momentum is confirmed.
B. Take Profit (TP) Targets
TP1: 3,053.269 (Initial support target).
TP2: 3,030.556 (Stronger support zone, deeper profit target).
C. Stop Loss Placement
Stop Loss: 3,150.726 (Above the resistance zone).
This is a logical stop-loss placement, allowing price fluctuations without prematurely stopping the trade.
4️⃣ Overall Market Sentiment & Trade Bias
Bearish Bias: Due to the formation of the Head and Shoulders pattern, trendline breakout, and weakening bullish momentum.
Confirmation Needed: A strong bearish close below the neckline increases probability of downward continuation.
5️⃣ Final Thought – A High-Probability Trade Setup
If neckline breaks, the trade is valid with potential for a 3%+ downside move.
If price holds above the neckline, the pattern may fail, leading to reconsidering trade execution.
This structured risk-managed approach ensures a strategic entry, controlled risk, and maximized profit potential. 📉🔥 Let me know if you need further refinements! 🚀


GBP/USD Trend Before and After Tariff Announcement✍ ✍ ✍ GBP/USD news:
➡️ The US dollar is showing weakness against the British pound ahead of Trump's tariff announcement. The pair is currently trading near the 1.3000 level, following weak macroeconomic data released during the US trading session on Tuesday. The ISM Manufacturing PMI fell to 49 in March from 50.3 in February, while the JOLTS Employment Number fell to 7.56 million in February from 7.76 million in January. Both figures were below analysts' expectations. The strong ADP data still failed to stop the pair's short-term rally
➡️ US President Donald Trump will announce the new tariff regime at 20:00 GMT on Wednesday.
➡️ US Treasury Secretary Scott Bessent said late Tuesday that the tariffs announced on Wednesday will be the highest level yet imposed. Countries will then have the opportunity to take steps to lower these tariffs, he added.
Personal opinion:
➡️ GBP/USD will find it difficult to break out to the 1.3000 zone as buyers are waiting and evaluating the tariff policy.
➡️ Moreover, RSI is close to overbought territory and buying momentum is slowing down
➡️ In short, this pair will move within the trend line and may break down to 1.2870 after the tariff news is announced
➡️ Analysis based on resistance - support levels and Pivot points combined with EMA to come up with a suitable strategy
Plan:
🔆Price Zone Setup:
👉Sell GBP/USD 1.2970 - 1.2980
❌SL: 1.3010 | ✅TP: 1.2930 - 1.2890
FM wishes you a successful trading day 💰💰💰

GBPJPY still bullish view
OANDA:GBPJPY in first analysis RES zone reached, what's next here is still bullish for expect. First analysis attached, currently price is in ASCENDING CHANNEL. Technicals are still bullish to see.
SUP zone: 192.500
RES zone: 195.900, 196.900

XAUUSD 1H Head & Shoulders Pattern and Quasimodo!This 1-hour Gold (XAU/USD) chart presents a Head and Shoulders pattern forming near the 3,124 level, indicating a potential bearish reversal. The structure consists of:
Left Shoulder – A peak followed by a retracement.
Head – The highest point in the formation.
Right Shoulder – A lower high, confirming the pattern.
Additionally, a Quasimodo pattern is forming, reinforcing bearish sentiment if price fails to sustain above 3,139. A breakdown below the neckline suggests a potential move toward the projected target zone at 3,039.
Key Levels & Trade Plan
📍 Resistance: 3,139 (Quasimodo level)
📉 Support Levels: 3,107 – 3,085 – 3,039 (Main target)
📊 Bearish Confirmation: Break below the neckline (~3,120)
🎯 Target Zone: 3,039
A clean breakdown below the neckline could accelerate bearish momentum, aligning with the projected drop of approximately 62.7 points (-2.02%). Bulls need to reclaim 3,139 for any invalidation of this bearish outlook. Keep an eye on price action confirmation before entering trades.

Bitcoin (BTC/USD) Reversal? Rising Wedge Breakdown Signals Sell! The chart suggests a potential bearish move after a rising wedge pattern breakdown.
Key Observations:
Rising Wedge Breakdown:
BTC formed a rising wedge, which is a bearish reversal pattern.
The price has broken down from this wedge, indicating a potential downtrend.
Support and Resistance Levels:
Resistance Zone: Around $88,188 – $88,792, marked as a key level where selling pressure may increase.
Support Zone: Around $85,368 – $84,226, where buyers may step in.
Target: $81,429 – $81,258, a strong support level where price could drop.
Bearish Setup:
The chart suggests a sell opportunity near resistance, expecting a downward move toward the target zone.
Trading Idea:
Entry: Sell near $88,000 after confirmation.
Target: $81,429 – $81,258 (support zone).
Stop-Loss: Above $89,991 (resistance zone).
This setup suggests Bitcoin could decline further, making it a potential short trade opportunity. However, traders should watch for confirmation and overall market sentiment before executing trades.

TRADING PLAN: USDJPY LONG TRADE SETUP Given the bullish sentiment in UJ today, and the successful liquidity grab at the London session low, we'll take a long position. Our initial target is a 1:1 risk-reward ratio, followed by a 1:2 ratio after securing some profits.

EURCHF bullish view
OANDA:EURCHF in first analysis price in moment is make break of crucial zone, at end soon after price is start testing zone again and its make bullish push, currently here now still bullish we can exepct for next periods.
SUP zone: 0.95400
RES zone: 0.96400

Just broke through a high liquidity zone!!It just broke through a high liquidity zone!!
The marked line is the arrival point.
We still have plenty of profit-making possibilities left, so be patient.
Wait for a good pullback with the corresponding manipulation to find a good re-entry!!
If the market goes without us, it's better to take a loss where we don't know what we're doing.
Note: (A fairly crowded zone is always a liquidity zone.)
Keep it simple!
If you liked it, don't forget to follow me!

Gold fooling us again!!Very interesting structure in the gold dollar!
There is complete indecision in the market.
It's right in the middle of two high liquidity zones.
Here's a brief outline of what I'm expecting.
Don't forget that patience always pays off.
Keep it simple!
If you liked it, don't forget to follow me!

Tariff highlights, gold price up or down ?⭐️GOLDEN INFORMATION:
Gold prices (XAU/USD) find support from dip-buyers during the Asian session on Wednesday, pausing the previous day’s pullback from a fresh record high. Investors continue to seek shelter in safe-haven assets amid uncertainty surrounding US President Donald Trump’s sweeping reciprocal tariffs and their potential repercussions on the global economy.
Additionally, escalating geopolitical tensions provide further support for bullion. Mounting concerns over a potential US recession, coupled with growing expectations of additional Federal Reserve (Fed) rate cuts, fuel demand for the non-yielding yellow metal.
⭐️Personal comments NOVA:
Gold price is still in a very stable uptrend, market tariff information waiting for the next price increase fomo
⭐️SET UP GOLD PRICE:
🔥 ATH : SELL 3173 - 3175 SL 3180
TP: 3165 - 3150 - 3140
🔥BUY GOLD zone: $3058 - $3060 SL $3053
TP1: $3070
TP2: $3080
TP3: $3090
🔥BUY GOLD zone: $3106 - $3108 SL $3103 scalping
TP1: $3113
TP2: $3118
TP3: $3125
⭐️Technical analysis:
Based on technical indicators EMA 34, EMA89 and support resistance areas to set up a reasonable BUY order.
⭐️NOTE:
Note: Nova wishes traders to manage their capital well
- take the number of lots that match your capital
- Takeprofit equal to 4-6% of capital account
- Stoplose equal to 2-3% of capital account
