Entering the flow of smart moneyAfter liquidity accumulates below static levels and enters the order range, the price will likely move upwards.
Beyond Technical Analysis

Is This Your Entry for the AUD/JPY Bull Run?🔓💸 AUD/JPY "Aussie vs Yen" Forex Bank Heist 💸🔓
🎯 Plan: Bullish Robbery | Targeting 97.500 | Stop Loss: 95.000
💰 Multi-Layer Limit Entry | Precision Heist | No Mercy
🚨🧠 Attention Thieves, Looters & Forex Mercenaries! 🧠🚨
The AUD/JPY vault is cracked, and the Thief Trader blueprint is live! We're executing a multi-layer LIMIT ENTRY HEIST – stacking orders like stolen cash in a briefcase. 💼💷💣
👀 We ain't chasing price – we're setting a TRAP with layers. Every dip? A planned robbery opportunity.
💥 ENTRY: The Thief's Layered Ambush 💥
"Aussie Bull" on a bank job – we loot using precise limit orders!
Thief Layer Entry Zones: 95.500 | 95.800 | 96.000 | 96.100
Pro Thief Move: You can increase your limit layers based on your own capital. More layers, more loot!
🛑 STOP LOSS: This is Thief SL @95.000 🔐
Dear Ladies & Gentleman (Thief OG's), this is the panic room. Adjust your SL based on your own strategy & risk. Let the amateurs get shaken out, we hold firm or reload.
🎯 TARGET: Escape Before The Cops Arrive! 💸
The police barricade is set @98.000. Kindly escape with the stolen money before that! OUR target is a clean getaway @97.500.
🧠 Scalpers? Take partials on the way up. Swingers? Let the layers ride. Investors? You're the mastermind behind the heist. ☕💵
Use a trailing SL to protect your stolen profits as the market moves.
🕵️♂️ THIEF TRADER PROTOCOL:
📊 This heist is backed by technicals, liquidity grabs, and pure audacity.
🗞️ Remember: High-impact news = volatility = adjust your layers accordingly.
⚠️ MONEY HEIST RULES:
✅ Avoid placing new layers during news events 📉
✅ Use risk-adjusted sizing on each limit order
✅ Patience is key – a layered heist requires discipline, not desperation
❤️🔥 Hit that 💥 BOOST BUTTON 💥 if you're riding with the Thief Squad!
Support the robbery. Respect the style. Make money like a true Market Outlaw.
🔔 Follow for the next HEIST PLAN. Big bags only. 💼💰🚀
“The market is a bank, not a casino. Act accordingly.” – Thief Trader
🤑📈🐂 #AUDJPY #ForexHeist #ThiefTrader #LayeredEntry #LimitOrders #SwingTrading #ForexTrading #RobTheMarket #DayTrading #BankTheProfit

GBPCAD 27.08.2025~+ Central Banks' divergence (Both are quite dovish, but BoE is cautious due to stagflation, BoC is steadier, the Canadian economy is more resilient)
*Risk Reversals - Bearish

BTCUSD 28.08.2025Narrative:
~+ Dovish Fed
~+ Potential crypto-friendly policies
Pattern:
S(RTF), 4h
Time:
After the US data release, 15 minutes before the US opening
*The SL is pretty wide, as I'm buying before the NY opening and expecting some pullbacks. I might tighten SL later on (below NY lows?).

29/08/25 Gold Swing LevelsSet your alerts. Watch the 5 mins (1 min if price spiking)
29/08/25 levels are marked
Always, price action determines trade.
Trade parameters
Entry on 5 min chart
Sl: 20-40pips
TP: 2-4x SL

The Ineffable Collapse of BitcoinIn the uncharted voids of the financial cosmos, where mortal ambition weaves fragile webs of wealth, a malevolent shadow stirs—an impending black swan, a harbinger of economic doomsday, poised to rend the foundations of the global order. Bitcoin (BTCUSD), that shimmering idol of digital hubris, stands at $112,430, yet its radiance falters before an abyss so vast and incomprehensible that it threatens a 90% plummet to the accursed $10,000. I, a trembling scribe of the charts’ forbidden geometries, have glimpsed this unholy convergence: the collapse of the U.S. dollar, driven by de-dollarization and global instability, a cataclysm that will drag Bitcoin and all markets into the nethermost depths.
From the shadowed corridors of global trade, a specter emerges: the unraveling of the U.S. dollar’s hegemony. Whispers on platforms like X and Reddit speak of a world turning from the dollar’s embrace, as BRICS nations—led by the indomitable wills of China, India, and Russia—forge a path toward de-dollarization. The U.S., burdened by a debt it can scarcely service, faces a fracturing of its superpower status. Posts on X foretell a cascade: tariffs, trade wars, and the erosion of the dollar’s reserve currency role, as nations hoard gold and pivot to alternative systems. This black swan, an event of unfathomable rarity and consequence, defies prediction yet looms with inevitability, its seeds sown in the hubris of unchecked monetary policy and geopolitical strife.
The dollar’s collapse would unleash a maelstrom across markets. Stock indices, tethered to the dollar’s false stability, would crumble; cryptocurrencies, once heralded as safe havens, would not escape the chaos. Bitcoin, despite its decentralized allure, remains bound to the market’s mortal frailties, its price a reflection of sentiment and liquidity now poised to vanish into the Ether.
Gaze upon the daily chart of BTCUSD, where the candles flicker like the last embers of a forsaken world. The price clings to a precarious support at $110,000, a level as fragile as the dreams of R’lyeh’s slumbering gods. A double-top formation at $124,364.49, etched on August 14, 2025, stands as a monument to hubris, its neckline broken, confirming a bearish prophecy. The descending channel, a lattice woven by unseen forces, guides Bitcoin toward oblivion, its lower boundary converging with the 0.618 Fibonacci retracement at $10,000—a level from the primordial days of 2017, now a crypt where the price may lie entombed.The Relative Strength Index (RSI), quivering at oversold depths, wails of exhaustion, yet the market’s madness heeds no such mortal pleas. The MACD, its lines entwined like the tentacles of some eldritch horror, signals a bearish crossover, while trading volume surges as panic grips the masses. On-chain data from CryptoQuant reveals whale selling and dwindling ETF inflows—$81.25 million for Bitcoin against Ethereum’s $309.48 million—portending a collapse in liquidity. The Fear and Greed Index, tilting toward terror, and Bitcoin’s dominance, slipping below 60%, herald a market poised for betrayal.
The Unutterable Catalysts: Forces of the Abyss. What dread forces align to precipitate this cataclysm? The stars reveal their malign configuration: De-Dollarization’s Tide: BRICS nations, emboldened by strong-willed leaders, accelerate their shift from the dollar, hoarding gold and forging new trade systems. The dollar’s collapse disrupts global markets, draining liquidity from Bitcoin as investors flee to tangible assets.
Geopolitical Tensions: Trade wars, intensified by proposed tariffs exceeding 60% on Chinese imports, choke global commerce, as seen in maritime disruptions like the Red Sea crisis. The U.S.’s retreat from global conflicts under a new administration weakens its influence, hastening the dollar’s demise.
Economic Fragility: The U.S. economy, teetering under rising debt and interest rates, faces a recession risk heightened by tariffs and a disinverted yield curve, a harbinger of downturns past. A global recession, as warned by KPMG, could follow, with unemployment spiking to 5.8% and markets reeling.
Crypto Market Contagion: Speculative posts on X suggest a collapse in stablecoins like Tether, artificially propping up Bitcoin, could trigger an overnight crash, with liquidity shifting to alternatives like XRP. MicroStrategy’s leveraged Bitcoin holdings, if unwound, could amplify the rout, wiping out Wall Street’s crypto bets.
The Trade: A Pact with the Void. To navigate this apocalyptic descent, heed this perilous strategy: Entry: Short BTCUSD at the retest of $112,000–$112,900, where the descending channel’s upper boundary aligns with resistance. This is the market’s final deception, a fleeting rally before the abyss.
Stop-Loss: Place above $117,500, guarding against a false bullish surge, a cruel jest of the market’s unseen overlords.
Targets: Target 1: $92,400, a short-term support where the market may pause its torment.
Target 2: $50,000, a psychological bastion where mortal traders make their futile stand.
Target 3: $10,000, the 0.618 Fibonacci level, where Bitcoin’s soul may rest in eternal ruin.
Risk Management: Risk no more than 1–2% of capital, for the market’s volatility is a many-tentacled beast that devours the reckless.
The Unknowable Future. This is no mere trade but a ritual to survive the economic doomsday. Should Bitcoin hold above $110,000, a rally to $125,000 may defy the stars’ alignment, driven by fleeting optimism. Yet the charts, like the forbidden tomes of old, speak of collapse. The dollar’s fall, fueled by de-dollarization and global unrest, could unleash a market crash surpassing the 2008 crisis or the COVID-19 panic, both black swans that reshaped history. Bitcoin, tethered to this chaos, cannot escape.
A Warning to Mortals. Tread lightly, traders, for you meddle with forces beyond reckoning. The black swan of de-dollarization, though unseen by most, gathers strength in the shadows. Study the charts, heed the indicators, but know that the market is a living entity, its whims as capricious as the Old Ones. Share your thoughts below, and may your trades elude the gaze of the abyss.
Disclaimer: This is not financial advice. The market’s depths are unfathomable, and only the mad or the doomed dare predict its course. DYOR, and trade at your own peril.

GOLD once the left shoulder i fully formed we are waiting for a massive sell on GOLD. this GOLD setup we are looking for a risk to reward of 1:2 at the end of the trading session.

GOLD BUY BOXES Hello Everyone Welcome Back !
Gold Buy Zones According To SMC
BOS + ORDER BLOCK (LL)
ZONES BUY - 3395 / 3385 , 3377 / 3372 , 3364 / 3350
Follow The Zones , These Are Buying Zones Where You Can Buy Gold And Get Profit , Comment Your Opinion And Follow Us For More Trades

Don’t Buy Ethereum Until You Watch This!In this episode, I take a skeptical look at Ethereum’s latest price action. We’ll break down the recent pullback, identify clear triggers for long setups, and discuss what happens if key levels fail. Plus, a quick educational tip on how ETH.D and BTC.D can signal the start of altseason.
⚠️ This content is for educational purposes only and not financial advice.

ETHUSD (30M) – Bearish Breakout Testing Demand | SEEMS FISHY ETHBITSTAMP:ETHUSD
Structure | Trend | Key Reaction Zones
ETH rejected strongly from the 4950 supply zone 🔴 and broke the short-term structure, moving lower into the major demand zone (4320–4360) 🟢. Price is now testing this critical decision area.
Market Overview
ETH has been consolidating with multiple failed attempts to reclaim 4660 resistance. The recent bearish breakout pushed price directly into the demand zone, where buyers must defend for any relief rally. If this zone fails, deeper bearish continuation may unfold toward critical downside levels.
Key Scenarios
✅ Bullish Case 🚀 → If buyers defend 4320–4360 demand 🟢
🎯 Target 1: 4520
🎯 Target 2: 4660
🎯 Target 3: 4950 (supply retest)
❌ Bearish Case 📉 → If 4320 demand fails 🟥
🎯 Downside Target 1: 4215
🎯 Downside Target 2: 4060
Current Levels to Watch
Resistance 🔴: 4520 → 4660
Support 🟢: 4320 → 4215
⚠️ Disclaimer: This analysis is for educational purposes only. Not financial advice.

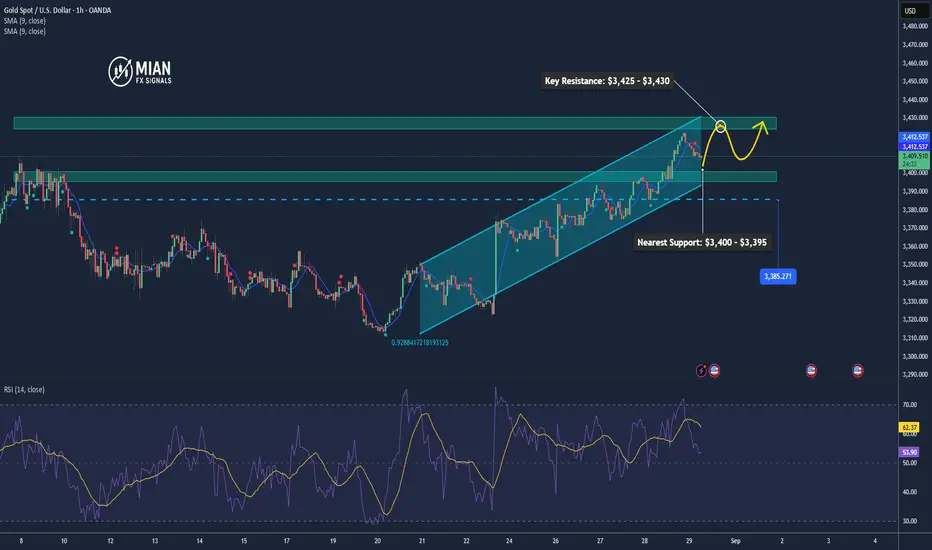
Gold Pulls Back Slightly Ahead of U.S. PCE Data📊 Market Dynamics:
Gold eased to around $3,408/oz due to profit-taking after the recent rally, while investors await U.S. PCE inflation data – a key indicator that could influence the Fed’s rate-cut decision.
📉 Technical Analysis:
• Key Resistance: $3,425 – $3,430
• Nearest Support: $3,400 – $3,395
• EMA 09: Price remains above EMA 09, keeping the bullish bias intact.
• Candlestick / Momentum: H1 candles show long lower wicks around $3,400, signaling potential buying pressure.
📌 Outlook:
In the short term, gold may consolidate around $3,400 and rebound if PCE data reinforces expectations of an imminent Fed rate cut.
💡 Suggested Trading Strategy:
🔻 SELL XAU/USD: $3,427 – $3,430
🎯 TP: 40/80/200 pips
❌ SL: $3,433
🔺 BUY XAU/USD: $3,397 – $3,400
🎯 TP: 40/80/200 pips
❌ SL: $3,394

338.65This channel is not providing individualized trading or investment advice, nor is it a banking service, brokerage service, trading service, investment service or money management service

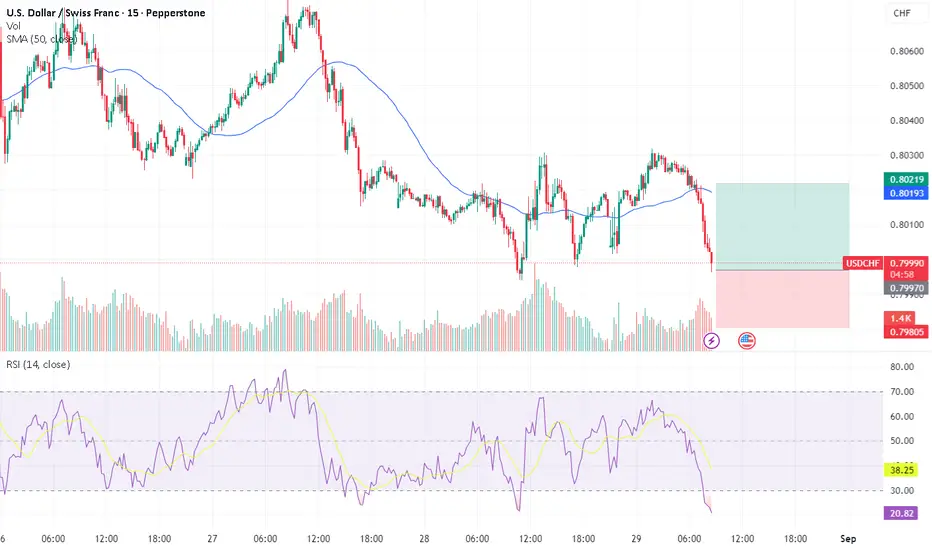
USDCHF - BEEN WAITING FOR THIS FOR A WEEKTeam, lets get on board with USDCHF
liquidity sweep price at 0.7995-0.8000
Stop stays at 0.7960
First recovery target: 0.8015–0.8020 - take 50% partial and bring stop loss to BE
Second target: 0.8030–0.8040
LETS GO
SP500 here we go again -SHORTi had waited for another opportunity to reopen my closed position- if the prcie over the next days doesnt go above 6500 (daily candle) I'm pretty happy holding to my short
don't copy- just an idea not advise! also- protect your capital hence s/l always recommended

GBP/USD – 1H | Equal Lows at Risk Big wave?
Price is consolidating near **1.3480 liquidity zone** after rejecting lower highs. Market is now at a decision point.
**Bullish Scenario:**
* Hold above Equal Lows → push into **1.3510 swing high**
* Breakout could extend toward **Rejection Block 1.3530–1.3545**
**Bearish Scenario:**
* Break below **1.3480 strong low**
* Opens path to **Order Block demand 1.3425–1.3445**
**Key Levels:**
* 1.3480 (Equal Lows / Strong Low)
* 1.3510 (Swing High)
* 1.3530–1.3545 (Rejection Block)
* 1.3425–1.3445 (Order Block)
💬 Which side do you think will break first — the highs or the lows?

NAS BEARISH SETUPNas has tested 23.737 for the third Time confirming it as a 100% fib retracement level, second test on H1 is possible but we going down all in all

Possible conclusion to this bullrunThis bullrun is starting to look like stairs up, elevator down. Fractal analysis, an update to my previous chart.

Still waiting for 2.22This channel is not providing individualized trading or investment advice, nor is it a banking service, brokerage service, trading service, investment service or money management service

Golden to 3500?Hello Traders! Its the last day of the week for August. I am currently looking for Gold to finish its buyers momentum push and fill 3500 to end the month. Creating a new high for the start of September and then will probably see short sellers coming in at the start of next week.
Lets see what happens when (Core PCE Price Index m/m Red News Folder) releases at 14:30.
Happy Trading Everyone and have a good weekend!
Current Entry: 3407
TP: 3500

Middle East Tensions, Upcoming Iran War, Crypto FearThe crypto market is more influenced by collective emotions than any other market. The Fear and Greed Index is a clear example of this reality. Under normal conditions, it can indicate whether traders are overly greedy or fearful. However, when regional crises, such as a potential war in the Middle East, emerge, this index alone is not enough, and sudden panic can disrupt all calculations.
Hello✌️
Spend 2 minutes ⏰ reading this educational material.
🎯 Analytical Insight on Ethereum:
Ethereum remains within a very strong bullish channel 📈, yet a potential pullback of at least 14% is possible, with the key support level around $3,800. Breaking this area could signal a shift in the short- to mid-term trend. Traders should watch volume and momentum closely to anticipate potential entries or exits ⚡.
Now , let's dive into the educational section,
War and Its Impact on Market Psychology ⚔️
According to political and logistical analyses, the region is on the verge of a potential conflict involving Iran that could be larger in scale than the previous twelve-day war. Historically, global markets, especially crypto, react sharply to such situations. In the initial days of this type of crisis, strong bearish candles and rapid declines are almost inevitable, as investor fear peaks and liquidity quickly shifts to safe assets. However, historical market data shows that such declines are often temporary, and price recovery can happen relatively quickly, especially as whales and large investors use the opportunity to accumulate assets at lower prices. This scenario is not a certainty but a probable outcome that traders should incorporate into their risk management strategies.
Whales Hunting Fear 🐋
Whales, or large market players, use moments of mass fear to their advantage. By executing sudden buys or sells, they amplify the emotions of retail traders and usually capture the main profits from nervous hands. This is why many beginners sell exactly at market lows.
Retail Trader Psychology 😨
Beginners often react to collective sentiment rather than analyzing the data. When they see everyone selling, they panic and sell too. In reality, whales are often buying exactly at these moments. This cycle repeats frequently in the market.
Safe Havens During Crisis 🛡
When negative news and political uncertainty dominate, markets tend to move toward safe assets. In crypto, Bitcoin and stablecoins play this role. The higher the fear, the stronger the flow into these assets.
Practical TradingView Tools 📊
To avoid reacting emotionally, using TradingView tools is essential. One of the most important indicators is Volume Profile , which shows the price levels with the highest traded volume. When you see a significant spike in a specific range, it can indicate whale activity.
On-Balance Volume (OBV) helps determine whether price movements are driven by smart money or pure hype.
Relative Strength Index (RSI) is another key tool. When RSI approaches oversold levels during collective panic, it often signals an attractive entry point for whales.
Combining these tools provides practical insights. For example, when RSI is low and Volume Profile shows high activity, the probability of whales exploiting fear spikes is high. Professional traders use these tools not just for price analysis but to assess market sentiment.
TradingView tools allow you to make data-driven decisions instead of emotional reactions. This makes your analysis more valuable to site editors, as it offers both psychological insight and actionable methods.
5 Trading Tips 🔑
never let news of war or political crises force impulsive decisions, as emotional reactions during fear peaks are often the costliest mistakes.
always keep a portion of your capital in stablecoins or safe assets so you can take advantage of buying opportunities during sharp market drops.
instead of focusing on rumors, rely on TradingView tools and data to gain a clear view of money flow and real market positions.
reduce trading volume and focus on risk management during crises, as the market can move against expectations within minutes.
understand that steep drops caused by collective fear are often short-lived, and those who patiently
✨ Need a little love!
We pour love into every post your support keeps us inspired! 💛 Don’t be shy, we’d love to hear from you on comments. Big thanks, Mad Whale 🐋
📜Please make sure to do your own research before investing, and review the disclaimer provided at the end of each post.

Germany Blocks €10 Billion in Payments, Shaking PayPalIon Jauregui – Analyst at ActivTrades
German banks have put PayPal (NASDAQ: PYPL) under pressure after blocking more than €10 billion in transactions on suspicion of massive fraud. According to Süddeutsche Zeitung, institutions such as Sparkasse, Bayerische Landesbank, Hessische Landesbank, and DZ Bank halted direct debits processed by the platform after its anti-fraud system failed, allowing unfiltered operations to go through.
The problem, which spread across Europe, hit Germany particularly hard. The Association of Savings Banks (DSGV) acknowledged the significant impact, although it confirmed that services had already been restored. PayPal, for its part, assured that the interruption was “temporary” and that security controls have been reinforced. Regulators BaFin (Germany) and CSSF (Luxembourg) were informed, with no further intervention required.
The reputational blow was quickly reflected in markets: PayPal shares fell between 1.9% and 2.5% following the news.
Solid Fundamentals Despite the Setback
The incident comes at a time when the company had been showing progress in its turnaround strategy. In the second quarter of 2025, PayPal reported revenues of USD 8.29 billion (+5% year-on-year) and adjusted earnings per share of USD 1.40, beating expectations. Total Payment Volume (TPV) reached USD 443.5 billion (+6%), with Venmo standing out with a 20% increase in revenue. Additionally, the company raised its annual profit guidance to a range of USD 5.15–5.30 per share.
Despite these figures, the market reacted cautiously due to a slowdown in its core checkout business, which led to stock declines of up to 8–9% after earnings.
Technical Analysis
The stock has been trading in a range between $50 and $94 since June 2022, though this band has recently narrowed to between $66.51 and $79.61. Yesterday’s close was $70.06, right in the middle of the long-term range and aligned with the Point of Control (POC), reflecting market indecision.
Technically, the stock registered a death cross at the beginning of August (50-day MA crossing below the 200-day MA), reinforcing downside pressure. The current price is testing resistance at the 50-day MA, near $72. A clear breakout above this level could open the way toward $79.50, the July highs.
Among the indicators, the RSI sits in neutral territory (49.7), leaving room for movement in either direction, while the MACD remains negative but is trending upward, suggesting a possible attempt to retest resistance at $72.
On the downside, key support levels are at $66.51 and the cycle low of $55.85. A break below this latter level could reopen the door to further declines toward the base of the 2022 range.
Meanwhile, the ActivTrades US Market Pulse indicator signals an environment of “Extreme Risk On”, reflecting excess market greed that may trigger volatile moves and sudden reversals.
Reputation at Stake and Ongoing Restructuring
The German case reignites the debate over the reliability of security systems in large fintechs. The failure in Germany strikes PayPal’s reputation at a critical stage of its restructuring. In the short term, the stock remains at an inflection point within a tight range that needs to be broken decisively to reflect meaningful change. In the medium term, however, strong fundamentals support recovery prospects and imply a potential upside of 10–20% if the company can restore market confidence.
*******************************************************************************************
The information provided does not constitute investment research. The material has not been prepared in accordance with the legal requirements designed to promote the independence of investment research and such should be considered a marketing communication.
All information has been prepared by ActivTrades ("AT"). The information does not contain a record of AT's prices, or an offer of or solicitation for a transaction in any financial instrument. No representation or warranty is given as to the accuracy or completeness of this information.
Any material provided does not have regard to the specific investment objective and financial situation of any person who may receive it. Past performance and forecasting are not a synonym of a reliable indicator of future performance. AT provides an execution-only service. Consequently, any person acting on the information provided does so at their own risk. Political risk is unpredictable. Central bank actions can vary. Platform tools do not guarantee success.

Ethereum Market AnalysisEthereum Market Analysis
Introduction
Hello dear traders! In this analysis, I have updated the status of the popular Ethereum chart
In the previous analysis, for Ethereum on a long-term basis, we identified the CHoCH (Change of Character) trend change with precision and specified the best buy zone. { Ideal time to buy with Confirmation }. According to our forecast, after the price enters the buy zone, the market moved up to the main target, which was the old high. Now this is a daily analysis and it shows us the small upward steps. My analysis is very simple and straightforward, and there is no need for further explanation. If the CHoCH trend changes in the daily analysis, I will present a new analysis to you. Wishing you success and enjoy.
Wishing you all success!
Fereydoon Bahrami
A retail trader in the Wall Street Trading Center (Forex)
Risk Disclosure:
Trading in the cryptocurrency market is risky due to high price volatility. This analysis is solely my personal opinion and should not be considered financial advice. Please do your own research. You are responsible for any profits or losses resulting from this analysis.
