EUR/GBP Bearish Retest – Downtrend Continuation Below 0.8300Chart Analysis & Trade Setup:
The EUR/GBP 2-hour chart highlights a strong downtrend with a descending trendline acting as resistance. The price recently tested a key horizontal resistance zone near 0.8300, rejecting it for a potential continuation lower.
Technical Breakdown:
📉 Descending Trendline: The price has respected the trendline resistance, marked by two key rejection points (black and red arrows).
📊 Support Turned Resistance: The previous support near 0.8300 has now flipped into resistance after a breakdown.
🔄 Bearish Retest Formation: Price is expected to retest 0.8300 before continuing the downtrend.
📌 Bearish Outlook: If the price holds below 0.8300, we can expect further downside toward new lows.
Trade Plan:
✅ Entry: Consider a short position near 0.8290 - 0.8300 on bearish confirmation.
🎯 Target 1: 0.8220 (Previous low).
🎯 Target 2: 0.8180 (Next key support zone).
🛑 Stop Loss: Above 0.8325, to protect against an invalidation of the bearish setup.
Conclusion:
EUR/GBP remains in a clear downtrend, with a bearish rejection at 0.8300 acting as a key trigger for further downside. Traders should watch for a clean retest before entering short positions.
📊 Bearish Retest in Play – EUR/GBP Targets Lower Levels! 🚀
Beyond Technical Analysis

SOXX 3d, 1H 2025NASDAQ:SOXX is painting what I think is a topping pattern. I am expecting this to pull a similar move to AMEX:ARKK back in Q4 2021.
If this plays out how I see playing out, I could see this revisiting the $180 area in the next 4-5 months.
For reference:

$QQQ Getting Over Sold?NASDAQ:QQQ I am stalking a bounce on the Q’s. From an intraday high (all time high) to an intraday low on this chart is about 6.2%. I would expect at least a dead cat bounce in the short term, but the market may not deliver for me. Having said that, I have an alert set on this 30-minute chart on the Downtrend line. “If” that triggers, I will go to a 5- or 10-minute chart to see if there is a good risk reward entry. And if I take the trade, it will be meant to be a day trade (of which I am not a fan) but it could turn to a swing trade “if” it gives me at least a 2% cushion.
I know I have a lot of "ifs" on this one, but isn't that the way it is?
I had posted another chart on the NASDAQ:QQQ index with a link below. I had said in that one that a pullback to the 510 “area” would not negate the longer-term uptrend. But one must be open to all outcomes.

EUR/USD Bullish Reversal Setup – Key Support at 1.0330-1.0367Overview:
The EUR/USD 8-hour chart presents a bullish reversal scenario, with price retracing after breaking an ascending channel. The market is approaching a critical Fibonacci retracement zone (1.0367 - 1.0330), which aligns with a strong support level. A bullish rebound from this area could push price towards the supply zone near 1.0700.
Key Technical Analysis:
Rising Wedge Breakdown: Price recently broke below the ascending wedge, signaling a short-term bearish move.
Fibonacci Retracement: The 0.5 (1.0367) and 0.618 (1.0330) levels act as potential reversal zones.
Support Zone: The market is approaching a demand area where buyers are likely to step in.
Reversal Expectation: A bullish bounce from the Fibonacci zone could lead to a strong move back toward the previous resistance area (1.0700 - 1.0750).
Trade Plan:
📌 Entry: Look for a long position near 1.0367 - 1.0330 after bullish confirmation.
🎯 Target 1: 1.0500 (Short-term resistance).
🎯 Target 2: 1.0650 (Intermediate target).
🎯 Target 3: 1.0700 - 1.0750 (Major resistance).
🛑 Stop Loss: Below 1.0300 to minimize risk.
Conclusion:
EUR/USD is testing a crucial Fibonacci support zone, and if buyers step in, a strong rally toward 1.0700 is likely. Traders should watch for bullish confirmations before entering long positions.
📈 Bullish Bias – Watch for a Reversal from Key Support! 🚀

XAUUSD strong down opportunity soon 1. Trendline Validity
The current trendline is drawn as a downward channel. However, are there enough touches to validate it as a strong trendline? Sometimes, trendlines can be subjective and might not hold.
2. Support & Resistance Strength
The chart marks a "strong selling zone" at resistance, but does it have historical significance? If this level hasn’t been tested multiple times, it might not be as strong.
The support area is expected to hold, but gold is volatile. Is there a fundamental reason supporting a bounce from there?
3. Alternative Scenarios
What if gold breaks out of the downtrend instead of continuing lower? A breakout above resistance could invalidate the bearish expectation.
Instead of a clean bounce at support, price could consolidate sideways or even break below.
4. Fundamental Factors
Are there any upcoming economic events (such as FOMC meetings, CPI reports, or geopolitical tensions) that could disrupt this technical setup?

USDCHF Bearish Rejection from Premium Zone LiquidityTarget0.8793Overview:
The USD/CHF 4-hour chart displays a well-defined Wyckoff Distribution pattern, suggesting a bearish continuation. Price has rejected from an extreme Premium Zone (0.8990 - 0.9050), indicating that sellers are regaining control. The market is now poised for a potential decline toward unmitigated liquidity levels near 0.8793, which serves as the next key support.
Key Technical Analysis:
Buying Climax: The market experienced an aggressive bullish move before forming a Buying Climax (BC), which trapped late buyers.
Sign of Weakness (SOW): A major SOW (Sign of Weakness) confirms bearish intent, with price struggling to sustain above key resistance.
Change of Character (CHoCH): A confirmed shift from bullish to bearish structure, reinforcing the downtrend.
Extreme Premium Zone: The rejection from 0.8990 - 0.9050 acts as a strong supply area where institutions have placed sell orders.
Liquidity Hunt & Retest: The price recently swept liquidity near 0.8990 and is now testing a previous support zone, which is likely to turn into resistance.
Trade Plan:
📌 Entry: Short near 0.8990 - 0.9000 after a retest confirmation.
🎯 Target 1: 0.8800 (Key psychological level).
🎯 Target 2: 0.8793 (Unmitigated liquidity).
🎯 Target 3: 0.8735 (Deeper bearish target).
🛑 Stop Loss: Above 0.9050 to minimize risk.

#XAUUSD 15m#XAUUSD Update:
Price is approaching a key supply zone around 2,887 - 2,890. If price taps into this area and shows signs of rejection, it could provide a solid shorting opportunity. Watch for bearish confirmation before entering.

Keep it simple - set and forget !!1. Accumulate when prices are between 78,000 and 85,000.
2. Sell a portion when prices hit 120,000 to 130,000 - probably this cycle top.
3. Start accumulating again when prices drop to 57,000 to 67,000 for the next cycle.
4. Set price alerts and let it go – don’t worry about checking constantly!
This way, you can stick to the plan without stressing over every price change.
There’s no such thing as getting rich overnight for the average person. Achieving great things takes time and effort. Success is a journey, not a shortcut!!!
NFA

USD/JPY Bearish Reversal Key Resistance & Fibonacci Target ZonesOverview:
This USD/JPY daily chart shows a potential bearish reversal setup after a break below key support and trendline structure. The pair has recently dropped below a critical demand zone (highlighted in green), which has now turned into resistance. The price is currently attempting a pullback, and a potential rejection from the resistance zone aligns with Fibonacci retracement levels, indicating a continuation of the downtrend.
Key Levels & Technical Analysis:
Previous Support Turned Resistance: The green zone represents a significant past support area that has now become resistance after a breakdown.
Trendline Break: The upward trendline that supported price action for several months has been broken, confirming bearish momentum.
Fibonacci Retracement Levels:
0.382 (151.265): A minor resistance level for a possible short-term rejection.
0.5 (148.979): A stronger resistance, aligning with structure.
0.618 - 0.786 (145.053 - 143.582): The ultimate bearish targets, coinciding with Fibonacci retracement extensions.
Bearish Projection:
The expected scenario suggests a short-term retracement towards the 151.265-148.979 resistance zone.
If the price faces rejection, a strong bearish continuation could target 145.053 and ultimately 143.582.
Trade Plan:
📌 Short Entry: Around 151.265 - 148.979 if price rejects resistance.
🎯 Target 1: 145.053 (0.70 Fibonacci)
🎯 Target 2: 143.582 (0.786 Fibonacci)
🛑 Stop Loss: Above 152.000 to invalidate the bearish setup.
Conclusion:
The overall sentiment for USD/JPY is bearish after breaking a key trendline and support level. Traders should watch for a pullback into the resistance zone, followed by a bearish rejection for a potential short trade. However, a break above 152.000 could invalidate this setup, shifting momentum back to the bulls.
📉 Bearish Bias Until Key Resistance Holds! 📉

What do you Think ? BTCUSDTPlease refer previous data Chart Same QSTn. $BINANCE:BTCUSD.
Who Know the drill, follow the process as per you strong Analysis take all Trade.
Consumer Sentiment & Stocks MarketsStock Markets Track Consumer Sentiment Closely
The relationship between consumer sentiment and the stock market is evident in this observation. Historically, consumer sentiment tends to lead stock market movements, providing valuable insights into potential trends.
Personally, I consider the Russell 2000 Index as a reflection of mass consumer sentiment, given that it tracks the 2,000 smallest publicly traded companies in the U.S. market. Looking at the E-Mini Russell futures, consumer sentiment peaked in December 2024, and since then, I have been monitoring the Russell and other indices along their well-supported trendlines. When the Russell started testing its trendline in January, I became cautious about its uptrend.
The clean break on February 21 signaled a shift: Russell transitioned from an uptrend to a downtrend on the daily chart. Consequently, my trading strategy has shifted from buying on dips to selling on strength whenever opportunities arise.
Russell is Leading Dow Jones, Nasdaq and S&P???
Indices tend to influence each other, and leadership often rotates. While the Nasdaq has previously led market moves, this case study suggests Russell is currently taking the lead.
Technically, the overall U.S. market remains bullish as long as it holds above the primary uptrend line. A bear market is typically confirmed when the market drops 30%, and by then, it should break below all primary uptrend lines. However, waiting for that confirmation is too late—by then, the damage will be significant.
The key observation is that Russell has already broken its secondary uptrend line. Will the Dow Jones, S&P 500, and Nasdaq follow? If so, we need to make fundamental projections. Factors like escalating tariff conflicts could worsen inflation, directly impacting the broader stock market and indices.
Consumer Sentiment Still Below 80 Despite Pandemic Being Long Over
Given the current macro environment, consumer sentiment is likely to remain below 80 for an extended period. Additionally, there is a downside risk if geopolitical tensions escalate.
From past case studies, a consumer sentiment reading below 80 has often preceded a stock market decline. This historical pattern raises concerns about future market stability.
My Trading Strategy: Cautiously Bullish
• Technical Perspective: Apart from Russell, I remain bullish on other indices.
• Fundamental Perspective: Market sentiment leans toward pessimism.
• Conclusion: This dual outlook leads me to a cautiously bullish stance.
For Russell 2000, my preferred strategy is to sell into strength, guided by a downtrend channel. Another alternative is trading Micro E-Mini Russell futures (M2K) for precision and risk management.
📈 Happy trading!
Please see the following disclaimer and additional information that may be useful.
E-mini Russell Futures
Ticker: RTY
Minimum fluctuation:
0.10 index points = $5.00
Micro E-mini Russell Futures
Ticker: M2K
Minimum fluctuation:
0.10 index points = $0.50
Disclaimer:
• What presented here is not a recommendation, please consult your licensed broker.
• My mission is to create lateral thinking skills for every investor and trader, knowing when to take a calculated risk with market uncertainty and a bolder risk when opportunity arises.
Trading the Micro: www.cmegroup.com
CME Real-time Market Data help identify trading set-ups in real-time and express my market views. If you have futures in your trading portfolio, you can check out on CME Group data plans available that suit your trading needs www.tradingview.com


XAUUSD BEFORE & AFTER READ IN CAPTION XAUUSD (Gold)* with key levels marked for potential trades. The price has recently touched the *support zone* around *2,867.378*, which could offer a buying opportunity. The *resistance* is at *2,920.364*, and the *retest area* is highlighted, suggesting a potential move up if the price bounces from the support. Watch for price action near the *support* for entry and target the *resistance* for potential gains

KAPCO – Bullish Flag Pattern Breakout in PlayKAPCO is forming a bullish flag pattern, indicating a strong uptrend continuation. The stock is currently consolidating within the flag, and a break above 39.50 with strong volume would confirm the breakout, potentially leading to a rally towards 42-43. This level also marks a double top resistance, where some short-term rejection could be expected. However, if the breakout sustains with increased buying pressure, it could pave the way for further upside. Traders should monitor volume closely for confirmation before entering a position.

NASDAQ Potential UpsidesHey Traders, in today's trading session we are monitoring NAS100 for a buying opportunity around 20650 zone, NASDAQ is trading in an uptrend and currently is in a correction phase in which it is approaching the trend at 20650 support and resistance area.
Trade safe, Joe.

Litecoin Update Including 1,300% Target From Bottom-UpThis is Litecoin on the weekly timeframe and nothing changes; super, hyper bullish.
First, notice the volume, it continues to rise. The last two weeks produced the highest volume ever and this is the best signal you can find. Volume is the most important signal to confirm the validity of a move.
Second, notice the current weekly candle. There is a very long lower wick (shadow), and the action moves back above support. This is a very strong signal, why? There was much selling, really strong selling pressure but buyers showed up and bought everything. If the week closes at current price, we have a bullish signal in the form of a hammer. If it closes higher, even a stronger bullish signal. If it closes lower, the bullish bias remains intact because the action is very strong compared to the early February wick low.
The early February low hit $80. Litecoin is currently trading at $127.
I updated this chart to show more long-term, real and reasonable, targets. We have a target around $450 for 250% and another one at $707 for more than 450%. Now, this potential is because Litecoin is already pretty advanced in its bullish cycle since it has been growing since August 2024.
If we consider growth potential but starting from the market bottom, we are looking at 800% and 1,300% or more. It is likely that Litecoin will peak much higher, but we have time to adapt to how far high prices will go. Right now, the wise move is to buy and hold.
Buy and hold will take care of everything. Leverage can be used but it should be very low. It is better to earn a safe and secure 500%, than to go for a risky 5,000% and lose everything along the way. Don't get me wrong, leverage trading is an amazing tool but it should be used with caution. If you are buying Crypto to change your life, to live in abundance and be rich, you are better up buying and holding and increasing your money slowly but surely. In 2025 we will all win.
Thank you for coming back and for deciding to read.
It is my pleasure to write for you.
Thanks a lot for your support.
Namaste.

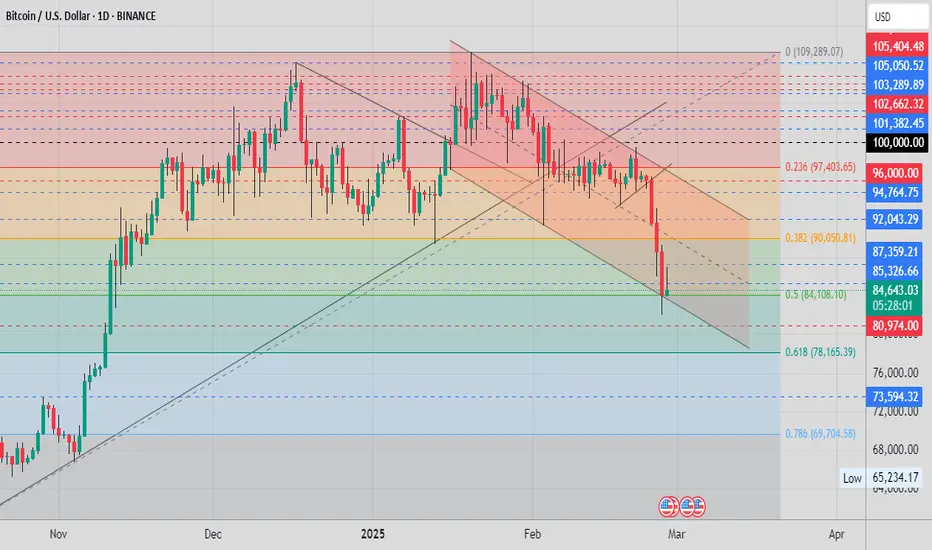
Bitcoin Finds Support, Relation 2 Altcoins Market & Bullish TalkBitcoin is trading right now between the 0.5 and 0.382 Fib. retracement levels relative to the last bullish wave. Let's dissect what this means.
The main levels are always 0.382 and 0.618 when it comes to Fibonacci retracements. The 0.5 level is also relevant and pairs tend to find support around this line.
Bitcoin broke the 0.382 Fib. level decisively but on very low volume.
Bitcoin failed to test 0.5 Fib. retracement level as support.
The fact that volume is low and 0.5 wasn't pierced works in favors of the bulls.
Notice that 0.618, the golden ratio, is not even in question. This is because the market is ultra-bullish. When the market is bullish, a reversal tends to happen at 0.382 or above 0.618. The fact that Bitcoin stopped its fall above this major support is good news for the bulls. This is good for those that are trading Bitcoin LONG. Just hold patiently because prices will recover and Bitcoin will grow. Not only grow but massive growth.
Signals continue to develop from the Altcoins market, today is not the same as yesterday, today we have a continuation on many, many big and small pairs.
At first, it would be doubtful to trust the signals that I am showing because the action was young in some cases, in other cases it was weak and small. But this isn't the case anymore.
Very big projects such as Aptos, Bitcoin Cash, Litecoin, Polkadot, Zcash and Maker are only a few of the many examples I've been showing you. This is enough to know, confirm and trust that the bottom is already in, the Altcoins market is going up. The only way the Altcoins can grow is if Bitcoin is also going to grow. The Altcoins never move up while Bitcoin is bearish. Seeing an Altcoin growing 100%+ in a single day means that the bears are weak while the bulls are strong. We are experiencing the final-final flush before a major, massive, incredibly, hyper, uber-rich Cryptocurrency market bull-run.
So support is good and support is really strong. The 0.5 Fib. retracement level sits at $79,000 but this level wasn't hit. Bitcoin bottomed before hitting $82,000 but some people are saying lower and this is where confusion comes.
I understand that we have many great traders and market analysts. TradingView is truly the best place in the world (Internet) for trading, learning, growing and sharing about financial markets and charts. But these same markets and charts can't lie. We can interpret some signals in a way that is detached from reality but the market is never wrong. Whatever is about to happen, it is clearly revealed when we look at the charts.
FIOUSDT is another pair that is breaking up just too strong after a higher low. The low being 3-February and the higher low a few days ago (25-Feb). This is just another confirmation that the correction is over; we (Bitcoin) are going up next.
It is great to be part of this market and this community.
It is such a blessing to have access this kind of knowledge and information. Because I can read this now I can rest easy and be calm. I know that regardless of what happens, Bitcoin is going up.
Bitcoin isn't going up in years to come, nor in the future far away. Bitcoin is set to grow, together with the Altcoins market, in a matter of days.
Are you ready for the 2025 bull-market?
Thank you.
Your continued support is appreciated.
We are winners and will continue to win regardless of what is takes.
We will pour our hearts, our sweat and our blood into what we do and trust. If today I make the right decision, tomorrow I am taking a big bag of money home.
The Cryptocurrency market is changing (saving) the world.
The money monopoly is over.
Money used to mean bondage, now, money is freedom.
Namaste.

EURGBP Potential DownsidesHey Traders, in today's trading session we are monitoring EURGBP for a selling opportunity around 0.82900 zone, EURGBP is trading in a downtrend and currently is in a correction phase in which it is approaching the trend at 0.82900 support and resistance area.
Trade safe, Joe.

USDCHF Potential UpsidesHey Traders, in today's trading session we are monitoring USDCHF for a buying opportunity around 0.89000 zone, USDCHF is trading in an uptrend and currently is in a correction phase in which it is approaching the trend at 0.89000 support and resistance area.
Trade safe, Joe.

Opening (IRA): SMCI April 17th 34 Covered Call... for a 32.13 debit.
Comments: High IVR/IV. Selling the -84 delta call against shares to emulate the delta metrics of a 2 x expected move 16 delta short put, but with the built-in defense of the short call.
Metrics:
Buying Power Effect/Break Even: 32.13/share
Max Profit: 1.87
ROC at Max: 5.82%
50% Max: .94
ROC at 50% Max: 2.91%
Will generally look to take profit at 50% max, roll out short call if take profit is not hit.

TSLA - Another trade of the year candidate!This short was almost too easy and we identified it in the last video after closing the cup and building just enough liquidity for a further dump.
It's been fun but I think I'm going to stop shorting for now and look for some buys
Happy Trading :)

GOLD, Is a correction on the way ???Hello Traders, Hope you are doing great.
GOLD is forming a Rising Wedge Reversal pattern these days and it seems that Bulls aren't able to raise the price at least for now. So I expect a downward correction in upcoming days.
Remember that this kind of corrections are temporary and gold price will probably see higher price this year; so Don't forget to use proper risk management .
and finally tell me What are your thoughts about GOLD ? UP or DOWN ? comment your opinion below this post.

MNQ!/NQ1! Day Trade Plan for 02/27/2025MNQ!/NQ1! Day Trade Plan for 02/27/2025
📈21420 21465 21510
📉21280 21230 21180
Like and share for more daily ES/NQ levels 🤓📈📉🎯💰
*These levels are derived from comprehensive backtesting and research and a quantitative system demonstrating high accuracy. This statistical foundation suggests that price movements are likely to exceed initial estimates.*
