BNBUSDT 2H: 08/12/2022
As you can see, price is in the equilibrium level.
it means that good opportunity for buy.
But it could better if we waited for lower prices like 275.
💡Wait for update!
🗓️07/12/2022
🔎 DYOR
💌It is my honor to share your comments with me💌
Binancecoin

BNBUSDT D TF: 07/12/2022As you can see, these prices can shout the price up.
274
264
Remember them!
💡Wait for update!
🗓️07/12/2022
🔎 DYOR
💌It is my honor to share your comments with me💌

bnb possible bearish scenarioBNB is doing a descending bearish triangle and if we add BTC is very lazy losing its time in 17K , the sp broke down the rising wedge that started in october give us a bad combination for the next weeks not just for BNB , for the whole crypto.
D.Y.O.R

BNB/BTC Ready for -80% Retracement ..?#BNB/BTC Technical Analysis:-
#BNB currently trading around 0.017BTC
And It’s All Time high Levels since it Launched.
Almost 57800% ( 578x ) up from Bottom within 5 Years so This is Huge Returns.
Now I am expecting Big Crash in #BNB/BTC
Hope You also Ready and Save your fund.
IMO I am expecting -80% Retracement from here.
I think This is Best time to Exit from #BNB in BTC Pair if You traded in BTC Pairs.
Last Resistance is 0.022 BTC and I think this will never break in this Market.
My Exit Points:- 0.017-0.022 BTC
My Targets are:-
Target 1:- 0.012 BTC
Target 2:- 0.007 BTC
Target 3:- 0.004 BTC
Most Important Support is 0.012 BTC
Please Like and Appreciate
Thank you.

BINANCE || BNB/USDT : LONG Entry Binance making a flag in 4hr time frame in the form of Falling Wedge || Bullish Reversal Pattern . Can give 12% of target if breakout happens candle close above 294.2

$BTC : Going for 18K or 15K ? Let's CBy reviewing the November 27th analysis of BTC , we can see that we had 2 scenarios, and one of those scenarios was collecting BUY STOPS liquidities above $17,000, and this is exactly what happened, of course, the bearish scenario of the last analysis failed! Currently, we have two Institutional supports, one is $16,900 and one is $16,500! If the price consolidates above these levels, we can expect the price to grow to $18180 as the next target!
Follow me for more analysis & Feel free to ask any questions you have, I'm here to help.
⚠️ This Analysis will be updated ...
👤 Arman Shaban : @ArmanShabanTrading
📅 12. 01 .2022
⚠️(DYOR)
❤️ If you apperciate my work , Please like and comment , It Keeps me motivated to do better ❤️

BNB 4H BUYBNB 4H support is at ~$286
Enter 50% at the current price
and try to set some BUY orders near the support zone
If BNB stays above the trendline,
the Take-Profit target would be 5%, 10%, and 15% from your entry
Cheers

BNB Elliott Wave count Daily TF No clear direction for BNB as we may have an X wave for a move to the upside or an ABC correction to retest the bottom of the 183 - 336 range.


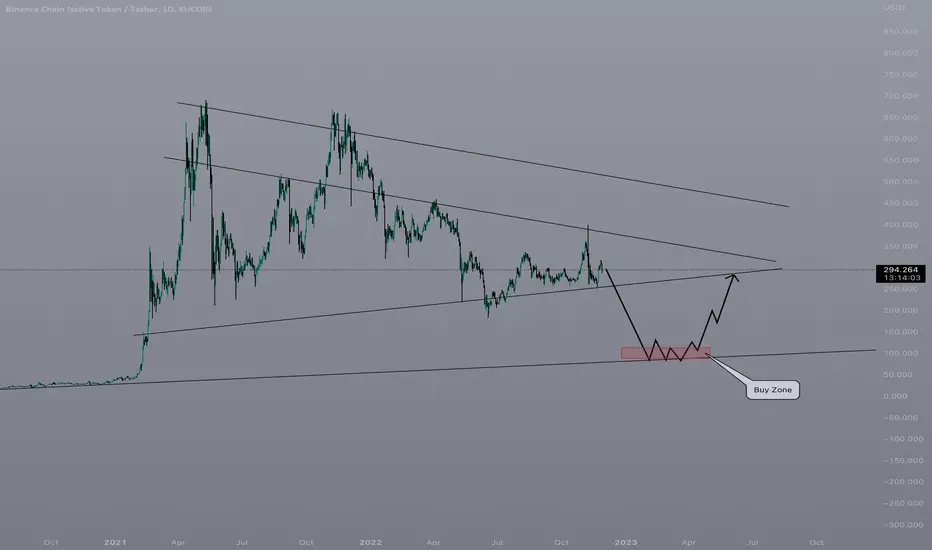
BNB (Binance) - Longterm Price Entry & Prediction I recon we could visit $80-$100, this would be a great buying opportunity for long term investment.
I reckon next bull market we could see BNB at $1,000-$4,000 a coin.
Will be buying at these levels.
Binance Coin Analysis 26.11.2022Hello Traders,
welcome to this free and educational analysis.
I am going to explain where I think this asset is going to go over the next few days and weeks and where I would look for trading opportunities.
If you have any questions or suggestions which asset I should analyse tomorrow, please leave a comment below.
I will personally reply to every single comment!
If you enjoyed this analysis, I would definitely appreciate it, if you smash that like button and maybe consider following my channel.
Thank you for watching and I will see you tomorrow!

What is needed to continue the upward movement!BNB has received a lot of attention due to the huge increase in transaction volume on the exchange and has registered a 25% growth within a week. The support level, which was considered in the range of $263-269, was fake broken in the last encounter. And with the break of the downtrend line in the 4-hour time frame, the price had strong growth. We can expect more price increases for the short term until the $300 support is maintained.
The resistance in the range of $315 can be broken, and the price increase can continue up to the level of $320-330. But to continue the upward movement of Binance Coin, it is necessary to completely break the resistance of 320-330 dollars and stabilize the price above this level. In this case, we expect the price growth to continue the upward movement to the level of $350. If the second resistance is also broken, the price trend in the daily time frame can be bullish. In this case, the potential for medium-term growth and reaching the previous ceilings in the weekly time frame will increase.

BNB/USDT: LONG SCALP SETUP!!Hello everyone, if you like the idea, do not forget to support it with a like and follow.
Welcome to this BNB trade update.
BNB looks bullish here. Forming a falling wedge-like structure in 4hr time and bouncing from there. RSI also shows bullish divergence. Long here.
TP1:- $274
TP2:- $288
TP3:- $306
TP4:- $324
SL:- $248
Leverage:- 5x-10x (According to your risk appetite)
If you like this idea then do support it with like and follow.
Also, share your views in the comment section.
Thank You!

SHORT setup for BNB/USDT BINANCE:BNBUSDT
BINANCE:BNBUSDT
BNB/USDT 60min
Distribution at the top, the price should return to the areas of greater liquidity.
BNB continues in a sideways movement which may be a distribution top, causing prices to return to the POC, in the crypto world this pattern of distribution top after a sharp rise, is called Bart Simpson
The asset is facing the 200 EMA after a strong bearish move.
I believe in the continuation of the downtrend, my position is established
The goals are plotted on the screen
🔴Disclaimer: The comments above reflect solely and exclusively my opinion, it is not a recommendation to buy or sell. Just a series of published studies, so that as a community we can discuss tactics and operational techniques.
🔹Would you like to ask any questions, throw away that duvid one? Fique à voluntade, terei or prazer em ajudar.

$BTC NEW TA : 📈 LONG or SHORT 📉 ?As you can see, the price moved below the level of $15,600 and after collecting liquidity, it faced buying pressure and was able to grow to $16,660. Now the price is in a supply range and can move again to lower levels (FVG), this demand zone is between $15,800 and $16,030, and the important bullish order block will be between $15,470 and $15,800! If a new upward movement starts, its first target is $16,850 to $17,030!
Follow me for more analysis & Feel free to ask any questions you have, I'm here to help.
⚠️ This Analysis will be updated ...
👤 Arman Shaban : @ArmanShabanTrading
📅 11.23.2022
⚠️(DYOR)
❤️ If you apperciate my work , Please like and comment , It Keeps me motivated to do better ❤️

ETH/USDTLooking for an entry in the green box support
Entry: 1016-900
TP: 1100-1200-1300-1400
Sl: 870

Binance Coin Paints A Clear PictureWe are looking at the weekly timeframe for Binance Coin (BNBUSDT).
Notice the huge red candle on the 7-Nov. week.
This is a full bearish candle with the highest volume since May/June 2022.
This one candle cancelled three weeks of growth.
It sent BNB below EMA50, below EMA10 and EMA21.
The week that followed was a bearish confirmation, we see the EMA10 rejetion and again, full bearish close.
We see this pair losing the 0.618 Fibonacci Golden Mean ratio, important support, as well as the ascending trendline that was set with Junes low.
This week we have a continuation, we see/start red which spells bad this for what is yet to come.
The support levels are marked light blue on the chart.
CHANGE
We would need to see a break and close above EMA50 ($317) weekly for things to turn bullish/green.
Any trading below this level we consider consolidation before the bottom is in.
After the bottom is in, we will see first a consolidation phase, then sustained long-term growth.
Years of growth just as we are having years of blood.
Stay strong.
The cryptocurrency market will survive and become stronger once the bad player are removed and exposed.
Endless opportunities... That is what the market is preparing for us.
Patience is key.
Planning, a must.
Namaste.

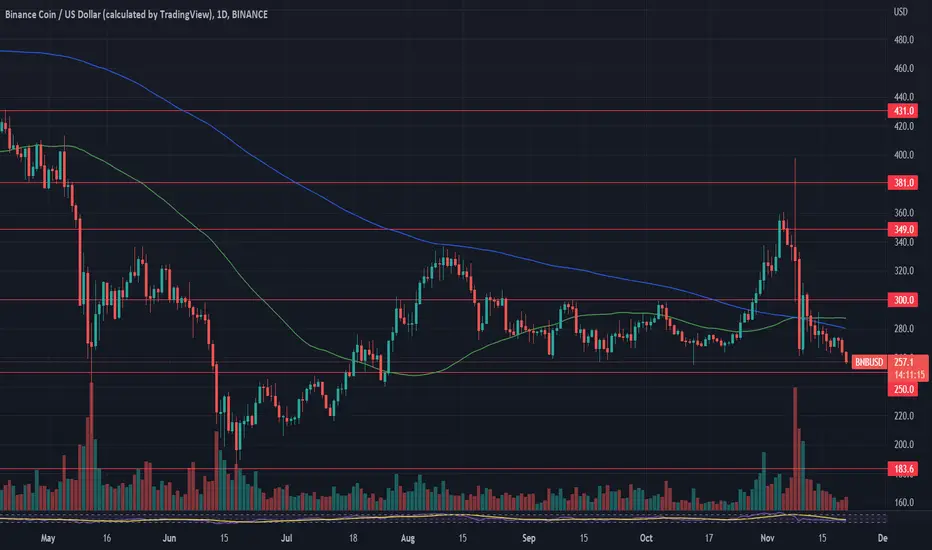
Binance Coin: what a chart !First look at BNB`s daily chart might give a scary impression. At first sight it is clear that something was going on with this coin. And it was, as announcements of potential acquisition of FTX had a strong impact on BNB`s price, after which, giving up on the deal was a huge driver of the price to the downside in line with FTX`s collapse. However, in relation to other major coins, it could be noted that BNB is holding quite well during this general market downturn. During the previous week the price of BNB went from $290 down to $263. The support line at $250 has not been tested. It seems like the market is just not ready to break the $260 level.
RSI made quite shy moves between levels of 43 and 39. It shows that the market is still not ready to choose the trading side. As for moving averages of 50 and 200 days, it is still not clear if the golden cross might be fully confirmed as two lines continue to move as two parallel lines, after creating a cross two weeks ago.
Markets continue to digest all the potential risks around FTX collapse. In this sense, fundamental news would lead the game on the market also during the week ahead. In case there is more negative news, the price of BNB might go down to $250 support line. Still, in case there are no such events, the price should try to test $300 resistance in the coming days.
Strong reactive area!During the last week, BNB, like many altcoins in the market, has had a completely range trend. The price of this currency is again at the support level of 264 to 270 dollars, and an almost appropriate reaction was observed yesterday. But note that the overall market trend is bearish, and there is also the potential for another price drop for BNB. If the selling pressure increases and the current support breaks, the support range of $233-240 for this currency can be considered a strong reaction zone. But on the other hand, a break of the current support could send the price into a new bearish wave, which would indicate a reversal zone in the $179-$191 range.
Therefore, increasing selling pressure in the market can even lead to the breaking of the previous floor in the weekly time frame. If the candle closes below the 264 support area this week, with a very high probability, the previous floor could be the next target for sellers. For the short term and in the 4-hour time frame, we can see a range trend on the chart. A dynamic resistance has been broken to the upside, and given the positive divergence, we expect a short-term rally to the 283-290 resistance range. A break of the $290 resistance can be considered for a short-term uptrend.

Binance coin is best exchange coin forever !BNB is good to buy for long term in Sup. zone
SUP. 180 - 120
RES. 350 - 700
buy in 2 step by RISK MAX 1%

long BNB$BNB broke through the descending trendline. Bullish movement to resistance level at 312$ is likely to happen.

#BNB/USDT Ready for Another Pump Before Big Dump ( Full Analyis#BNB/USDT Bull Run Technical Analysis:-
$BNB currently trading at $280 which is almost ( -62% ) down from Its ATH.
It went down to $183 and Recovered fast.
Supper Bull Flag forming in Weekly Time frame so I am very Bullish in Long Term.
But now Market Conditions are is good so I am Not expecting this is Bottom of $BNB
IMO $BNB Bottom will be around $100 ( If Below $100 then Huge/Bonus Opportunities)
Hope You understand :-success always demands sacrifice/Patience.
In Weekly Time frame Bearish Engulfing Pattern also Formed.
So Weekly Bearish as Per Pattern.
I am Only Bullish if Break Yellow Line Resistance which will be around $400
Support:- $212/$120/$90
Resistance:- $4000
Please Like and Appreciate ❤️❤️❤️

Long on BNBUSD pairGoing long on bnbusd pair because it just bounce from the support. If bounce back from the resistance, book the profit. If breaks the resistance, book profit on the next resistance.

Can BNB traders maintain support?Hi traders, and welcome to Monday's insight. We're watching BNB today as price continues to hold a higher low above a well-defended support area.
We all have seen the total drama that has been the crypto market last week. Insane price moves after FTX ended up declaring chapter 11. We want to wish our best to anyone caught up, and we hope you will see a happy ending.
After a weekend of selling, we are seeing a new push higher by buyers today. The good, we are seeing a new higher low that sits at the top of the support range. Higher lows are bullish signs, and seeing it with support can give it more credence.
The sell-off was dramatic, and we saw as much as 31% wiped off BNB price in two trading sessions last week. The good news was that the selling stopped at 260, which is the base area of the support range.
Looking forward, we want to see today's buying continue with a higher close. This will continue to hold the support area and reinforce it. If we see this, we then want to see a new rally pulling back more of last week's losses.
If we do see a new move lower, we need to see 260 hold. If we do see a new close below 260 or lower, this could be signalling that we are seeing a new leg lower. Let's see if buyers can hold today's higher move.
Good trading.
