Possible Huge Long Zone on Bitcoin ⚡ Bitcoin (BTC/USDT) – Daily Chart: Bullish Reversal on the Horizon? 📈
(Please check my previous posts before reading this last one regarding BTC)
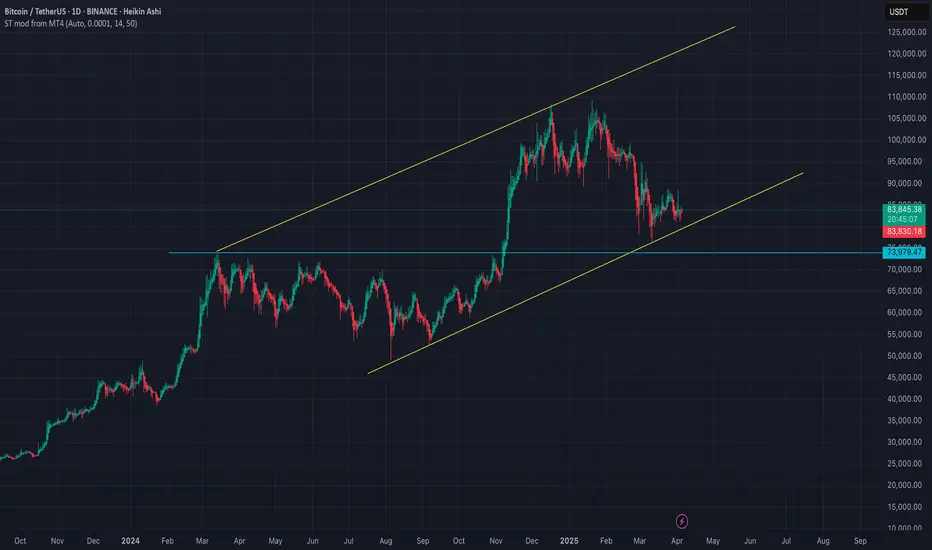
BTC just tapped into a high-confluence Long Zone between $73,700 – $65,260, which acted as a powerful demand area during the last rally back in late 2024. After a recent drop of today, price is now sitting at a key decision level. 🟢
🔹 Long Zone: $73,700 – $65,260
🔹 Historical Support: Held in late 2024 before a major run
🔹 Target Level: $108,000
🔹 Potential Breakout Zone: A strong close above $108,000 as higher targets
📈 If price holds this zone, we could see a strong bullish reversal toward the $108,000 or higher. The descending wedge pattern hints at a textbook accumulation-to-expansion setup—but only with proper confirmation. 🚀
🟢 High reward-to-risk setup for swing traders watching for trend shifts.
⚠️ Don’t rush in. Look for signs of strength before entering and take care of your risk management system.
Are you bullish on BTC/USDT once it touches the $73,700 level? Let’s discuss! 👇
Bitcoin (Cryptocurrency)

Ethereum TA 25.4.5Hello everyone, I hope you are doing well. Ethereum on the 4-hour timeframe got rejected after hitting a strong order block and started forming new lows. Given the current chart conditions, we have two order blocks in the high price area and we expect the price to return to these levels. If we see a short setup, we will enter a short position with a target of 1750. For now, I am not suggesting a long position and will wait until the pullback on the chart is complete.
⚠️ This Analysis will be updated ...
👤 Sadegh Ahmadi: GPTradersHub
📅 25.Apr.5
⚠️(DYOR)
❤️ If you apperciate my work , Please like and comment , It Keeps me motivated to do better


levels to watch I had previously highlighted a potential top around the 100-108k range, with a measured target of around the 75k level. The market did, in fact, drop to around 76k. For now, it's respecting the uptrend channel, and we can expect the market to target 90,000. If those levels are breached, it could push the market above 100,000, with new highs potentially reaching around 125,000, as I mentioned in my earlier article.
$VIX Hits 45! $BTC Historically Pumps Soon AfterThe TVC:VIX has only hit above 45 on 5 occasions in the history of CRYPTOCAP:BTC
Each time it did, BTC pumped at least 20%

Check if it can rise along the rising trend line (2)
Hello, traders.
If you "Follow", you can always get new information quickly.
Please click "Boost" as well.
Have a nice day today.
-------------------------------------
We need to see if USDT and USDC can continue the gap uptrend.
-
(BTC.D 1M chart)
If BTC dominance rises above 62.47 and maintains or continues to rise, altcoins are likely to record a larger decline.
Therefore, you should think about how to respond to the altcoins you are trading.
If the uptrend continues, it is expected to rise to the Fibonacci ratio range of 0 (73.63) ~ 1 (77.07).
In order for the altcoin bull market to begin, it must fall below 55.01 and be maintained or show a downward trend.
-
(USDT.D 1M chart)
In order for the coin market to begin an upward trend, the USDT dominance must fall below 4.97 and be maintained or show a downward trend.
If it does not, and it rises, the coin market is likely to show a downward trend.
We need to see if it can meet resistance near the Fibonacci ratio of 0.618 and fall.
If not, the coin market will show a large downward trend as it rises to around 7.14.
-
USDT is likely to continue to rise.
This is because it is the fund that supports the coin market.
Due to this, USDT dominance is also likely to continue its upward trend.
Therefore, rather than following the overall flow of USDT dominance, it is better to look at where it starts to decline.
-----------------------------------------
(BTCUSDT 1D chart)
Whether the price can be maintained above the M-Signal indicator on the 1D chart while maintaining the price above the upward trend line (2) and passing through April 4-6 is the key.
In order to continue the upward trend, it must rise above 89294.25, so if possible, we should also look at whether it can rise above 89294.25.
If it does not and falls along the downward trend line, it is possible that it will touch around 73499.86 during the volatility period around April 25.
-
The most recently formed high-point trend line is trend line (3).
And, the recently formed low-point trend line is the (2) trend line.
Since these two trend lines are not moving in one direction, we can see that we are currently in the volatility zone.
If the StochRSI indicator rises this time and forms a peak in the overbought zone and then falls, the high-point trend line will draw an upward trend line like the low-point trend line.
When that happens, it seems likely that the trend will start.
Therefore, the point of interest is whether the two volatility periods in this April, around April 5 and around April 25, will become turning points.
-
Thank you for reading to the end.
I hope you have a successful trade.
--------------------------------------------------
- This is an explanation of the big picture.
I used TradingView's INDEX chart to check the entire BTC range.
I rewrote the previous chart to update it by touching the Fibonacci ratio range of 1.902 (101875.70) ~ 2 (106275.10).
(Previous BTCUSD 12M chart)
Looking at the big picture, it seems to have been maintaining an upward trend following a pattern since 2015.
In other words, it is a pattern that maintains a 3-year upward trend and faces a 1-year downward trend.
Accordingly, the upward trend is expected to continue until 2025.
-
(Current BTCUSD 12M chart)
Based on the currently written Fibonacci ratio, it is displayed up to 3.618 (178910.15).
Fibonacci ratio 0.618 (44234.54) is not expected to fall again.
(BTCUSDT 12M chart)
Looking at the BTCUSDT chart, I think it is around 42283.58.
-
I will explain it again with the BTCUSD chart.
The Fibonacci ratio ranges marked in the light green boxes, 1.902 (101875.70) ~ 2 (106275.10) and 3 (151166.97) ~ 3.14 (157451.83), are expected to be important support and resistance ranges.
In other words, it seems likely to act as a volume profile range.
Therefore, in order to break through this section upward, I think the point to watch is whether it can rise with support near the Fibonacci ratios of 1.618 (89126.41) and 2.618 (134018.28).
Therefore, the maximum rising section in 2025 is expected to be the 3 (151166.97) ~ 3.14 (157451.83) section.
To do that, we need to look at whether it can rise with support near 2.618 (134018.28).
If it falls after the bull market in 2025, we don't know how far it will fall, but considering the previous decline, we expect it to fall by about -60% to -70%.
So, if the decline starts near the Fibonacci ratio 3.14 (157451.83), it seems likely that it will fall to around Fibonacci 0.618 (44234.54).
I will explain more details when the downtrend starts.
------------------------------------------------------

Shorting BitcoinBINANCE:BTCUSDT
Bitcoin put a massive Bearish Engulfing Candle yesterday, with high volume, which is very bearish, and now I’m expecting it to continue to decline.
It also tends to follow the US Indices, which are heading lower.
My target is about 70k, maybe even lower.
Good luck to you

#BTC #BTCUSD #BTCUSDT #BITCOIN #LONG #SWING #Analysis #Eddy#BTC #BTCUSD #BTCUSDT #BITCOIN #LONG #SWING #Analysis #Eddy
BTCUSDT.P Swing Long Analysis With Entry Points.
This is my possible Scenarios 1&2 analysis of Bitcoin's future trend.
This Analysis is based on a combination of different styles, including the volume,ict & Price Action Classic.
Based on your strategy and style, get the necessary confirmations for this Swing long to enter the trade.
Don't forget risk and capital management.
First Entry point of Scenario 1 already touched.
The responsibility for the transaction is yours and I have no responsibility for not observing your risk and capital management.
🗒 Note: The price can go much higher than the first target, and there is a possibility of a 500% pump on this currency. By observing risk and capital management, obtaining the necessary approvals, and saving profits in the targets, you can keep it for the pump.
Spot Investing : ((long 'buy' position)) :
🟢 Entry 1 : 79285.50 (( Scenario 1 Entry point ))
🟢 Entry 2 : 61845.77 (( Scenario 2 Entry point ))
⚪️ SL : Behind the last shadow created.
⚫️ TP1 : 250000
⚫️ TP2 : 500000
⚫️ TP3 : 999000
‼️ Futures Trading Suggested Leverages : 3-5-7
The World Let it be Remembered...
Dr. #Eddy Sunshine
4/4/2025
Be successful and profitable.
My previous analysis of Bitcoin (a view of one of the reasons for my first scenario):
Do you remember my first Bitcoin swing long signal entry & targets?
My first swing long signal was provided on BTC, which was spot pumped by more than 150% and was profitable :

#BTC #BTCUSD #BTCUSDT #BITCOIN #LONG #SWING #Analysis #Eddy#BTC #BTCUSD #BTCUSDT #BITCOIN #LONG #SWING #Analysis #Eddy
BTCUSDT.P Swing Long Analysis With Entry Point
This is my first possible scenario and analysis of Bitcoin's future trend.
This Analysis is based on a combination of different styles, including the volume,ict & Price Action Classic. (( Head & Shoulder Pattern ))
Based on your strategy and style, get the necessary confirmations for this Swing long to enter the trade.
Don't forget risk and capital management.
Entry point already touched : 🟢 79285.50
The responsibility for the transaction is yours and I have no responsibility for not observing your risk and capital management.
🗒 Note: The price can go much higher than the first target, and there is a possibility of a 500% pump on this currency. By observing risk and capital management, obtaining the necessary approvals, and saving profits in the targets, you can keep it for the pump.
Spot Investing : ((long 'buy' position)) :
🟢 Entry 1 : 79285.50
🟢 Entry 2 : 61845.77 (( This Entry is for secound scenario ))
First entry point calculations :
⚪️ SL : Behind the last shadow created.
⚫️ TP1 : 250000 ((215.32%))
⚫️ TP2 : 500000 ((530.63%))
⚫️ TP3 : 999000 ((1160.00%))
‼️ Futures Trading Suggested Leverages : 3-5-7
The World Let it be Remembered...
Dr. #Eddy Sunshine
4/4/2025
Be successful and profitable.
Do you remember my first Bitcoin swing long signal entry & targets?
My first swing long signal was provided on BTC, which was spot pumped by more than 150% and was profitable :


Bitcoin's Buy Zone Revealed: The R/Evolution Of FinanceFor this bull-market, the buy-zone can extend as high as $100,000. This is because Bitcoin is set to grow above $160,000 to reach $180,000 and even up to $200,000 in the latter part of 2025. So even $100,000 can be a good entry for total profits of 100% when we reach 200K... If it goes higher, better!
Let's try again.
How are you feeling today?
A new day, a new chart; a great market.
While Bitcoin is solid right now, price-wise, it is still trading within our buy-zone.
Below $90,000 Bitcoin is an awesome buy. Have people been telling you this lately?
Yes? No!
No??? I am shocked. This is pure evil.
Bitcoin is now a great opportunity, a great buy when you consider that it will be trading 50% higher in a matter of months. Even better when you consider that everything that is Crypto related is set to grow.
Well, it is no problem, I am here to show my support.
Bitcoin is set to rise and it will rise really strong.
The last chance to buy at low prices is present and available now.
Bitcoin is an awesome buy below $90K.
Anything below 90,000 is great.
Below 80,000 is awesome but a rare opportunity and likely gone. This kind of price was only available for a few hours in 2025. Bitcoin has never closed below 80K weekly in its history. Were you aware of this fact?
The saying normally goes, "Sell in May and go away."
In 2025, this won't be the case.
The saying now is, "Buy everything now and become rich."
"Buy everything and hold strong."
Cryptocurrency is set to rise. Bitcoin is still trading at a nice price within our long-term accumulation-entry (buy) zone. The time is now.
Regardless of your strategy, your system, your method or your plan; accumulation is great.
You can accumulate now. If prices drop, buy more. If prices rise, buy more. When the rise becomes strong, hold. When the top is in or close, start to take profits because after a strong bullish phase comes a correction. You don't want to be caught holding during the correction. You can buy when prices are low. Hold as the market grows. Sell when the market peaks. If you sell when the market peaks, you can buy back-in when the next low is in. There is plenty of time to decide and take action. There is no way to miss a good entry.
Consider the chart and market now. Bitcoin has been sideways for months. Many months we have time to plan and buy. It will be the same after the end of the bullish cycle, so it will be wise to take profits when prices are up.
Buy and hold now. Sell later when everything grows.
I will be here to alert you of great timing to sell at the top.
Right now we are at the bottom. Nothing more needs to be said.
Bitcoin is trading within our long-term buy-zone.
You know what to do.
Take action.
Thanks a lot for your continued support.
Cryptocurrency was invented to usher a financial revolution. A revolution that is beneficial for all those involved. Everybody can win with Crypto, even the banks, if they adapt to the evolution of finance.
Imagine going against email and the Internet because it is new and you are the owner of the mailbox.
In retrospect, we know this to be simply unreasonable, we can only adapt and change because reality is always changing, no matter what our beliefs are or preferences. Today it is the same.
We have new money and humanity will never look back again.
We are in the early days of the Internet. The early days of Crypto. Those taking action now, will be looking like geniuses 10-20 years ahead. It is not too late. It is pretty early. Really early. Crypto is less than 20 years old. There are Bitcoins to be mined until 2140.
Join the revolution now, become the evolution of finance you yourself and get rich in the process.
Thank you for reading.
Namaste.

Bitcoin - This Is Just Unbelievable!Bitcoin ( CRYPTO:BTCUSD ) is not dropping at all:
Click chart above to see the detailed analysis👆🏻
After we have been seeing one of the craziest weekly drops which I have experienced in my entire trading history, all major cryptos and especially Bitcoin are strongly holding their levels. Since bullish strength continues quite often, I do expect new all time highs on Bitcoin soon.
Levels to watch: $70.000, $300.000
Keep your long term vision,
Philip (BasicTrading)

BTCUSD: Conservative September Target $150kBitcoin remains neutral on its 1W technical outlook (RSI = 46.307, MACD = 1999.100, ADX = 44.501), firmly supported on top of the 1W MA50. On this analysis you see the Channel Up that dictated the price action of the last three Cycles. Since December 2023 BTC has traded solely inside the 0.382 - 0.618 Fibonacci Zone, the median zone of the Channel Up. The Theory of pre-Halving / post-Halving symmetry implies that the time range from the Cycle Bottom to the Halving is almost the same as the time from the Halving to the Cycle Top. Since on the current Cycle, the time from the Bottom to the Halving has been 76 weeks, in theory the Top should be another 76 weeks from the Halving. We take the worst case estimate of 74 weeks like the 2017 Top. That's the end of September. And with regards to the target, a conservative estimate is just over the 0.5 Fib at 150k, like the highs of December 2024 and March 2024.
## If you like our free content follow our profile to get more daily ideas. ##
## Comments and likes are greatly appreciated. ##

BTCUSDT: Signs of discounts are still noticeableBINANCE:BTCUSDT breaking below the support of the local rising wedge on the basis of a downtrend (falling wedge) has been formed. And now there is no reason for Bitcoin to move higher or to be honest:
"Just focus on selling because the risk of buying at this moment is high due to the newly announced reciprocal tariffs by President Trump, highlighting the increasing risk of Bitcoin in relation to macroeconomic uncertainties. I think we will drop much lower than 76,000 USD, as you may know from my previous analysis."
If you find this information useful, please leave a like and follow Gary for the latest updates!

Bitcoin volume exploding todayBitcoin volume is exploding today. The Maxi's are trying to close it green on the day to advertise it as a "Safe Haven Asset." We are watching an All-In to keep it above 79k Support.
Will they win?

Bitcoin Faces a "Resistance Lines WALL" – Breakout or Breakdown?Bitcoin ( BINANCE:BTCUSDT ) started to rise as I expected in my previous post and hit all targets . Will Bitcoin continue the upward trend of the past two days!?
Please stay with me.
First of all, I have to say that Bitcoin is facing a Wall of Resistance lines ( intersection of at least 4 Resistance lines ). Do you think Bitcoin can easily break these resistance lines with a single attack?
Bitcoin is trading near the Resistance zone($87,520_$85,840) , Potential Reversal Zone(PRZ) , and a Series of Resistance lines .
In terms of the Elliott Wave theory , Bitcoin appears to have completed Corrective waves . The corrective wave structure in the Ascending Channel is a Double Three Correction(WXY) .
I expect Bitcoin to drop to $85,000 in the first step in the coming hours. The Second target is $84,333 , and if the Support zone($84,430_$83,170) is broken, we should wait for the CME Gap($80,760_$80,380) to fill.
Do you think Bitcoin can break the wall of the Resistance lines, or will it start declining again?
Note: Donald Trump's speeches over the next hours could also affect the market, so trade a little more cautiously during this hour.
Trump’s Speech & Potential Tariffs
In today’s speech, Trump is expected to discuss new tariffs on imports from China, Mexico, and Canada, possibly ranging from 20-25%. If confirmed, this could impact global markets, strengthen the USD, and increase economic uncertainty.
Note: If Bitcoin touches $89,000, we should most likely expect more pumping.
Please respect each other's ideas and express them politely if you agree or disagree.
Bitcoin Analyze (BTCUSDT), 4-hour time frame.
Be sure to follow the updated ideas.
Do not forget to put a Stop loss for your positions (For every position you want to open).
Please follow your strategy and updates; this is just my Idea, and I will gladly see your ideas in this post.
Please do not forget the ✅' like '✅ button 🙏😊 & Share it with your friends; thanks, and Trade safe.

BITCOINS BIG MOVE IS COMING! I hope you guys did enjoy this trade idea; feel free to comment down below if you have any questions or comments.

Bitcoin may continue grow inside upward channel to seller zoneHello traders, I want share with you my opinion about Bitcoin. Looking at the chart, we can observe how Bitcoin corrected down to the support level, which also aligned with the buyer zone. From there, the price started to rise. It didn’t take long for BTC to reach the resistance level, which matched up with the seller zone. After breaking through that level, the price began consolidating within a range. Throughout this range, Bitcoin tested the upper boundary several times, but on the last attempt, it reversed and began to decline. The drop continued until it broke through the 86500 level, effectively exiting the range and pushing lower toward the next support. Once the price reached that area, it broke below the level and even dipped under the buyer zone, but quickly reversed and started climbing within an ascending channel. Inside this channel, BTC pushed up to the 83500 level, broke through it again, and maintained bullish momentum. At the moment, Bitcoin is trading within the channel, and I anticipate a potential correction back to the lower boundary of the channel, followed by continued growth toward the seller zone and a break of the resistance. For this scenario, my target is set at 87000 points. Please share this idea with your friends and click Boost 🚀

Levels to watch for potential scalps! Key BTC Levels Breakdown:
88,752: Major resistance - previous rejection + monthly close below
86,033: High volume node + multiple rejections last week
84,903: Key pivot point - flips between support/resistance frequently
82,927: Current consolidation zone - high volume trading area
81,955: Strong support - multiple bounces + volume profile support
79,976: Critical support - monthly support + high volume node
Trading these:
Shorts: Look for rejections at 86k/88.7k with volume
Longs: Clean bounces off 81.9k/79.9k with volume
Chop zone: 82-84k = scalp territory
Keep in mind:
Wait for confirmation
Volume tells the story
Don't trade between levels
Clean breaks = better trades

BTCUSD Weekly Log ChartOften preceding the general market movement, bitcoin currently holds its support pretty well.

$BTC - 4h timeframe playCRYPTOCAP:BTC | 4h
If we're gonna front-run the 78k level for a swing point retest and get a reaction at 80k level, then I'm considering this scenario, stopping out the early longers.
Possible deviation below npoc, before sweeping the 4h range high at 94-96k

Possible Scenario BTCUSDTBitcoin remains at a critical level. After breaking out of the descending channel (blue lines), a drop towards $73,700 is likely, which serves as a key support zone for potential long positions .

Bitcoin - Are We Heading for A Deeper Correction?Bitcoin has been on a Bull Run for past few months due to Trump and anticipation of Crypto-friendly policies however it seems the impulse waves have came to an end and we are in correction zone. If the support zones don't hold, this can lead to substantial downfall which could take price below $50k.
Best option is to trade with small lots and near strong support/resistance levels.
If you are a sport trader, you can set limit orders for accumulations.
If you found this analysis valuable, kindly consider boosting and following for more updates.
Disclaimer: This content is intended for educational purposes only and does not constitute financial advice.

BTC ANALYSIS 🔮 #BTC Analysis 🚀🚀
💲💲 #BTC is trading between support and resistance area. There is a potential rejection again from its resistance zone and pullback from its major support area. If #BTC breaks resistance zone $88500 then there will a chance of bullish movement
💸Current Price -- $84470
⁉️ What to do?
- We have marked crucial levels in the chart . We can trade according to the chart and make some profits. 🚀💸
#BTC #Cryptocurrency #DYOR
