Bitcoin on the verge of multiyear breakout......sounds BullishBitcoin is making higher highs higher lows on 1H time frame
It's at the very edge of valid trendline shown in the chart so if bitcoin takes support at this trendline We may enter a mega bull run in recent times .
My view is bullish hope this time Bitcoin breaks 28800 ....Happpy trading
Bitcoinpriceprediction

Bitcoin No Limits - World Takeover Don't Trust The MarketcapHello this is my first post for the future and some bitcoin projections I have been running during the bear market, everyone see it from my view and why this is a pretty historic event happening before our eyes. Biggest financial event in human history to be exact. . not just our lives.
2025
$855,775 Medium | Market cap ($17,971,275,000,000 based on 21m supply) $17.971 trillion
$2,038,869 Parabolic | Market cap ($42,816,249,000,000 based on 21m supply) $48.816 trillion
BASED on today's price of 1 Bitcoin worth $22,800 | Invested amount $2,052 = 0.09 BTC | Return on 2025 $183,498 that's 8,742%.
--------------------------
2030
$3,471,145 Medium | Market cap ($72,894,045,000,000 based on 21m supply) $72.894 trillion
$6,610,057 Parabolic | Market cap ($138,811,197,000,000 based on 21m supply) $138.811 trillion
BASED on today's price of 1 Bitcoin worth $22,800 | Invested amount $2,052 = 0.09 BTC | Return on 2030 $592,853 that's 28,791%.
--------------------------
You need to stop looking at Bitcoin based on market capitalization, this is not a technology stock, this is not a company they cannot be compared what so ever.
Its impossible to dilute Bitcoin, Its not impossible to dilute Apple shares.
Fiat money can be printed and devalued renominated, Its impossible to print Bitcoin and create inflation outside of the 21m limit.
Rick Falkvinge explains this perfectly, how do we calculate a 1 billion dollar market cap token?
Step 1 Issue 1 billion Tokens
Step 2 convince a few thousand people to buy each token for $1
Step 3 you now have what wall street uses to value companies economic value, and you probably just realized 100 Trillion in Bitcoin is not 100 trillion dollars, you can have a 1,000 trillion market cap with less than 50 Trillion of fiat value floating around in the asset.
You start to realize the total crypto market capitalization filled with scams was not 3.0 Trillion in real fiat value.
In 2021 at the peak only 176 Billion was the daily volume on Coinmarketcap, if you add in that market caps are not correct it would be less than a 10 billion per day of real fiat currency, its a lot correct but its not near what people thought.
Lets continue the journey and use Visual Capitalist to see what money looks like today.
-Notional value of derivatives is now estimated to be $600 trillion, notional value is another method to use over market cap.
-Market value of derivatives $12.4 trillion
-House hold wealth globally $463 trillion
-Commercial real estate $33 trillion
-Residential real estate $259 trillion
-Global debt $300 trillion
-Global money supply M1 $48.9 trillion M1 includes currency i.e. banknotes and coins, plus overnight deposits
-Global money supply M2 $82.6 trillion M2 is a measure of the U.S. money stock that includes M1 (currency and coins held by the non-bank public, checkable deposits, and travelers' checks) plus savings deposits (including money market deposit accounts), small time deposits under $100,000, and shares in retail money market mutual funds.
-Global Equities $95.9 trillion
-Central Bank Assets $28.0 trillion Fed, BoJ, Bank of China, and Eurozone only
Here we come to the end, where you should now understand even purchasing $1 dollar of Bitcoin can equal a range of multiples more than 10x of market cap pressure if you're measuring it in market cap.
What can we use besides market cap to find Bitcoins value? we can't it has not been created yet.
Further points, sovereign states who purchase Bitcoin and have no plan to make them available to the public market like El Salvador that's another multiples of leverage on top of the original purchase, and unlike derivatives this leverage can be held infinitely just how central banks store Gold bars infinitely.
Still wondering what this is implying after that long explanation?
For Bitcoin to get near a $100 trillion dollar market cap giving it a price of $4,800,000 per coin you could pull this off with less than $10 trillion of real fiat injecting into the Bitcoin economy if 21,000,000 coins are openly traded.
Some factors that will be unknown due to the nature of statistics
- how many coins are truly lost?
- how much fiat will central banks print?
- how many users will be on layer 2s like the lightning network?
-----------------------------------------------------------------------------------
This is why the Bitcoin exchange supply is acting abnormal and its starting to really decrease due to institutions, banks, funds all allocating behind the scenes regardless if Bitcoin goes to $5,000, $10,000 anything under $100,000 is cheap.
Fidelity investments one of the largest funds in the world notices this trend and they have made their decision.
What are pathways institutions are taking to capture this wealth?
- Cold storage.
- Long-Term Equity Anticipation Securities (LEAPS) call options that expire longer than 1 year.
- Avoid futures ETF's or any futures product that does not use underlying Bitcoin, these decay and have management fee's and will greatly reduce your profit. (I found this ETF that tracks Bitcoins price?) forget it don't touch it.
Bitcoin cycles will eventually became a thing of the past once adoption reached maximum velocity, lets enjoy the time we have with it now and respect it till its gone.
Better call Doc Brown when Bitcoin starts to move you're gonna see some serious s***


Hello, everyone! On the Bitcoin price chart we can see that beaHello, everyone!
On the Bitcoin price chart we can see that bearish reversal bar and bearish divergence have been formed, but I consider it's not enough for the final wave 5.
Of course, Awesome Oscillator crossed the zero line, but this is too weak crossover to form the wave 4. I suppose we have to see more consolidation in the wave 4. Bearish reversal bar in my opinion is the top of the wave 5 inside wave 3. Therefore I am still holding my long trade and waiting for the wave 5.
Best regards, Ivan


Bitcoin Analysis: Key price zones to watch.
Hello traders.
Bitcoin is showing a sideways momentum for now which is fine and was expected to do so. I've kind of already covered this expected side ways action in my Mar 17 analysis where I said it would clear all the buy and sell side liquidity in the zone of $27k-$32k.
Well we never actually reached $32k mark but were close to that.
Now before the Bitcoin price moves up, what I want to see is a nice retracement leg where I can find my entry points.
I've marked two areas to be my point of interest in Bitcoin. First area is between $23800-$24123. Reason is simple. It's the zone sitting at 50% fib levels of the recent expansion from $19k. So it's a bounce back area for me.
The second area where I have my eyes on is $21k-$22k price range, as it offers a discounted area to buy Bitcoin. The said zone is also an unmitigated zone and the chances are high for Bitcoin to tap into this area and bounce.
I'm using a 4h timeframe for my analysis and hence it may take time for Bitcoin to shape out the structure that I want to see.

#Bitcoin - thoughts out loud #06Good evening, we are from Ukraine!
Extension of the agreement. The action plan remains unchanged. A mistake made by UT without confirmation.
Restart. The targets are unchanged.
Thank you all for your attention, I wish you success.
Sometimes you win/sometimes you learn.
#Bitcoin

Bitcoin harmonics I'm still eyeing up a bullish cypher (white) and shark harmonic (blue) on the daily candle chart.
If we get rejected at these levels at the 1.414 fib, I'm hoping for the cypher giving a D (buy) target of around 218600. Which was a huge resistance through the second half of 2022 👀
If we can push up 30600ish (C) and reach the 1.618 I believe we may have a shark giving a buy target of around 18430! (D) this is also massive resistance during the later part 2022 (check December 14th rejection for reference)
This is just what I'm personally looking for. Iv had So much confuence around these price ranges it's hard to ignore!
(Comments and disagreements welcome! I love a debate 🔥)

btcusdt 4h uptade btc almost three time failed to break its resistance area at 28500$.
MACD & RSI indicators almost look bearish on 4h tf.
there is a two possible next move...
1st = downtrend correction expected from current price.
2nd = downtrend correction expected from its resistance area... 28500$-29000$.
local support area 26500$
strong support area 25000$.
follow me for more updates.

Bitcoin Possible bullish ScenarioBitcoin Possible bullish Scenario, Price may go up and touch 100 weekly Moving Avg(MA). also it can go little higher then we can expect some consolidation and pull back to 0.6 fib level.Thanks

Breaking the Bears: Bitcoin Bullish MomentumHello @TradingView community. Welcome in @Vestinda Bitcoin price analysis.
Reports about bank collapses, stablecoins, and interest rate increases appear to be powerful enough to increase the price of bitcoin. Well, Bitcoin almost hovers above $28,000 amid banking instability.
On the other side, we discover chart patterns that suggest a market recovery from the bear trend as Bitcoin surged in the beginning of March 2023 by approximately +80%.
1. Price on long term scale remains in Rising Channel
2. Strong breakout of Downtrend Resistance
3. EMA Ribbon bullish breakout
Which means price is likely to continue growth inside Rising Channel, and according to identical move characteristics from 2019, we might land on this move in the upper 40s or low 50s. For sure it is our High-hopes, and in general, the price movement may differ both in time and appearance.
What is Rising Channel in trading?
A rising channel is a technical analysis tool used by traders to identify an uptrend in the market. It is formed when the price of a security moves between two parallel trendlines, with the upper trendline representing resistance and the lower trendline representing support. The rising channel can be used to identify potential entry and exit points for trades, as well as to determine whether a security is in an uptrend or downtrend. Traders can also use it to set stop-loss orders and take profits when trading, a rising channel helps traders determine where the current price is in reference to the median of the market.
Learn about Bulls and Bears on the markets:
Hey, what do you like to read next on TradingView?
Your feedback will help us create more relevant and useful content!
Thank you so much.

#Bitcoin - thoughts out loud #05Good evening , we are from Ukraine!
The price range has been reached. Next, I assess the weakness of the acquisition recovery. UT is fixed, UTAD is possible. I'm going to support the trade.
Thank you all for your attention, I wish you success .
Sometimes you win /sometimes you learn .
#Bitcoin

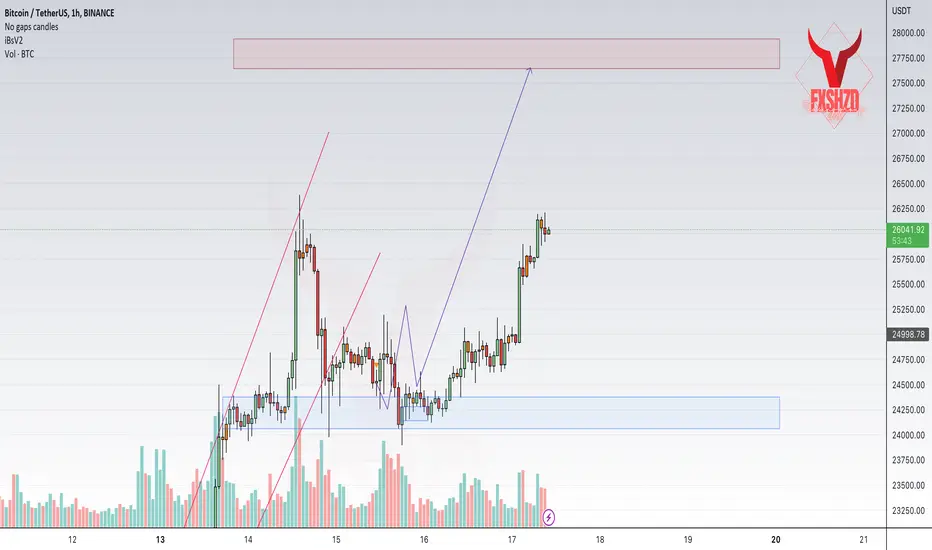
‼️ BITCOIN BULLISH ✅✅✅✳️‼️To update our last BTC idea,
We had two scenarios, as expected price chose the first scenario and it followed as we determined in the last analysis,
We have a strong supply zone around 28000, we expect the reaction to this zone, with a bit of corrective move,
For keep the position until 28000, but be careful try to manage your trades properly,
Any questions comment below,
@FxShzd
#Bitcoin - thoughts out loud #04Good evening , we are from Ukraine!
I'm finishing the previous idea and continuing the new one.
Action plan for this trade:
I'm waiting for UT/UTAD because there is liquidity there, then confirmation. I'm targeting the price of 25652.
Good luck to everyone!
Thank you all for your attention, I wish you success.
Sometimes you win /sometimes you learn .
#Bitcoin

Bitcoin is reversing weekly time frame!COINBASE:BTCUSD
1W time frame
-
We are eventually reversing weekly EMA Ribbon!
Sit tight!

Bitcoin get rid of Bear!COINBASE:BTCUSD
3D time frame
-
We are probably on the second wave until hitting 28~31k
Get ready!

long setup for bitcoinlong trade setup for bitcoin target 29000+
lets see
price will come down to golden pocket 618 level
good place to bounce from here

Bitcoin Why is everyone bearish still ??Hi guys so ill update March 23rd from today just to weed out the noise . but i believe we have more upside to follow through with . Now that begs the question doesnt it . :) .Prevailingnine March 16.23.


BTCUSD💥4H-TIMEFRAME ANALYSISBTCUSD💥4H-TIMEFRAME ANALYSIS
💗Hello ladies and gentlemen
This is my new idea for 💥Bitcoin
I hope my idea is clear
Support me by like and share thank you
Stay Safe💯💲💲💲
Good luck💰😍

btcusdt 4h uptade in last 4 days bitcoin almost pump upto 23%...
if you buy bitcoin few days ago for shorterm holding then i recomand you to book your profite.... now possible we see some correction in markete.
1st resistance of bitcoin at 25200$
2nd resistance area of bitcoin at 26700$
if you are looking for open position in short on bitcoin then i recomand you that currrently don't open any position in short till btc price cross 26700$.
1st local support area of bitcoin at almost 22800 ( small bounce back expected from this area)
follow me for more update about crypto.

Bitcoin recovered My last post discussed the final stages of the Bitcoin correction. In that analysis I was expecting the end stage of the correction of Bitcoin, mainly because it had served its days of the 65-daily cycle. Never did i expect the following events though.
The course I expected was failry simple:
- Bitcoin will find support on the horizontal line, and go sideways from there.
- Once out of the channel, we would shoot up again.
What actually happened was:
- Bitcoin broke support
- Crashed down to our last resort support
- Came back up as if the crash never happened
The current state at the end of the day is:
- Bitcoin is following our plan, but more explosive than expected.
- Bitcoin is back in the red resistance zone. Breaking this one would give us a target of 28k.
- I'm bullish!

A rejection from 200 WMA (Red) & 50 WMA (Green)?If we see the last bull run, after crossing the 50 WMA bitcoin tested and got rejected for further downside to test 200 WMA. But this time it has already been dropped below 200 WMA and not testing it, not just that also testing 50 WMA. If it gets rejected here, would not be a good sign for bulls.

BTC potential next movementsBTC /USDT
BTC has completed the 5 impulse waves and now in corrections waves
In the chart what i think the most potential reversal levels for BTC
1st Support : is very close (20.3k - 19.8k)
And its support of the falling wedge too
Breakout the falling wedge resistance to confirm the bullish reversal of this one
2nd support : deep correction around (18.5k - 17.5k)
I recommended to wait the reaction at these levels before any new trade/ investing
Any thoughts or questions share with me in comment section below ⬇️
