Bitcoin - Wisdom, knowledge, and a warning!!!Bitcoin is now well inside the range that I created back on May the 12th. Every time we dip below a set range it opens the possibility to go to the next lower range and that's how this zone of interest came to be. The next stop IF we dip below the current range is $11,000. As of right now, BTC does not show signs of strength and we may see another drop, or we may go into a long-range. Also, keep in mind that we are well below bost now, it takes about 34K to produce a Bitcoin that's worth 20K. Production may slow down if we stay this long under production cost which will influence the price. Another point to consider: Since the Dow Jones Industrial average is now in full control of BTC we only get the weekend to see what Bitcoin will do on its own. Mon-Fri Bitcoin moves in whichever direction the DJIA moves, let's look closely this weekend to see if BTC moves up, down, or goes nowhere. If it does not move much that means it is waiting for the Dow to open on Monday to keep following it, which means institutional money is at wheel 100%.
What are we waiting for as a sign that we might move up? We're waiting for a big price drop with small volume. Why? That will indicate to the powers that be that you’ve all sold all you had and that there’s very little cheap supply left. Once the cheap supply is all bought, it's time to start pumping good news out and start moving the price up. If the above does not make sense read it until it does.
Heads up: Look closely and you will see that when Bitcoin comes down volume goes up and when Bitcoin goes up volume is low. What does that mean? It means a few things, one is that there is still a whole lot of selling and buying going on, meaning there is still a lot of cheap BTC to be bought but there is very little interest in buying by first-time buyers. In other words, institutional money is buying a lot from panicky retailers but retailers may be out of cash to buy cheap. This is a warning that we might not be done going down. A good indicator of supply running out will be when we see a candle with a large wick where the price went up by a lot came down by a lot and closed where it started with below-average volume.
My Strategy: 3/3/4 33% of my money is allocated to a very low buy order that can take weeks or months to fill, when that initial order hits my other 33% goes in once we dip below the first buy order's price. The remaining 34% I put to work once we are so low it is hard to believe that we will ever go back up. Needless to say, I have 34% left and I am waiting to see how low we can go. That last 34% typically makes a ridiculous amount of money.
Regarding SHIB: You can buy SHIB and it will be based on hope and it will be an investment mostly because it requires a long commitment, only put a small amount of your capital on coins that you hope will go up. Focus the bulk of your money on the coins that are likely to go up. Get to know your asset class, know the players, and understand the projects. Otherwise, you are gambling with your money hoping you made the right choice and that somehow you will be rewarded. How does Warren Buffett get it right so often? Before investing he gets to know the product and the people behind the product.
Warning: The world economy could get worse, do not commit more capital to crypto if you see a scenario where you'll need that money in a few months. Crypto is not a hedge against inflation, it actually follows the global markets, if they go down Bitcoin will follow. If you hang onto your last bit of capital and we go lower, you'll have the opportunity to put it at the very bottom and see big profits later on. You will not lose if you are very cautious with your remaining capital. You can put it at the bottom, you can put it in once we know for sure that we are going back up or you can use it to survive a recession.
VERY IMPORTANT: Hitting the "Like" button is like a tip, please don't forget to do so after reading, this is your way of thanking me for my time and so I thank you for yours.
Bitcointrading

Scaling in to BTCThe recent Bitcoin market meltdown has been so severe that one must start considering potential bottoms. Upon piercing the previous bull market highs and reaching as low as $17,567, Bitcoin reverted to the $20k level.
$20k is a reasonable place to start scaling back in and I have opened a position at that level. It is possible BTC will fall further ($16,500 would be my next guess if the previous low is broken) and I will scale in more then.
However, it is also possible that we see a relief rally, in which case I'm putting a conservative target price of $25,000 in place to take profits given the negative macro environment.


Bitcoin trading in a possible 4H continuation pattern?Happy Tuesday, subscribers and TradingView community. Thanks for stopping by and checking out our latest analysis video. Today our focus is on Bitcoin's 4H chart.
Looking at the 4H, we can see that Bitcoin has made the first leg higher, breaking the last lower fast trend and moving above the moving averages. Since that break higher, we have seen the market move into consolidation. The pattern we can see on the 4H is an ascending triangle pattern.
These patterns are generally seen as continuation patterns when they are sitting in up legs or up trends. From here, it is all up to buyers. Can they confirm the pattern with a new break higher?
If we do see a confirmed breakout, we will be looking to see if buyers can test 22,700 resistance. If buyer momentum really carries forward past 22,700, we would then be looking at 28,500 – 31,000 to come in as resistance possibly.
But before we get too far ahead of ourselves, let's see if buyers can first confirm the pattern and get back up to 22,700! If sellers set a new close below 20,100, we will start doubting buyer strength.
Good trading

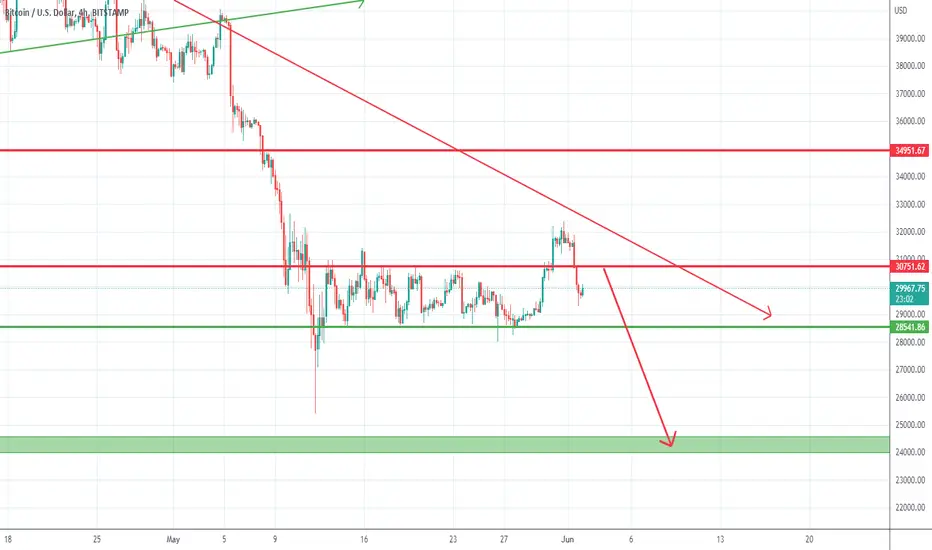
Bitcoin- Down again after the false break?Bitcoin is trading in a range for 3 weeks now and although it had a break of resistance on Monday, this proved to be a false one and the main cryptocurrency fell under this again.
Usually, after a false break in one direction, the asset will have a real break in the other direction, and if this holds true also in this case, Bitcoin could fall again under 27500 and test 25k.
My outlook on the short term is bearish Bitcoin at this moment and only the price above 32.500 would make me change my mind
Revised Bitcoin Trend analysis on Weekly Time frame
If BTC consolidate between 28643 to 32485
and it breaks upside will lead to Target of 37900 to 38000
If BTC consolidate between 28643 to 32485
and it breaks downside 28600 It will lead to downward Journey very fast.
below are downside Targets
1st 25475
2nd 19300
3rd 12900 (In case drastic changes in global environment)
Disclaimer: These levels are purely based on Price action/demand and supply zones & and consumed only for educational purpose & should not be taken as buy/sell recommendation. I will not be responsible for any loss/profit incurred if anyone takes trades based on my views.
Please consult your Financial Advisor before making any trading decision.
Leave a comment that is helpful or encouraging. Let's master the markets together.

Bottom startingThis is the full EW analysis since 2021. Classic Zig Zag correction with over extended B wave or some may classify this as expanded flat neglecting one wave in wave A back in May 2021. We have completed the 5 waves down of wave C. Personality of the wave was confirmed with volume expansion and fear in the street. The last lower timeframe wave 5 was extended which gave a target of 16800 which is yet to come...in any case crumbles do not matters. Now we are about to flirt with the bottom of the 10 years trend. if we violate this, dark times are ahead, meaning something fundamental has changed in the space. Nevertheless, these are my expectation for the near future. The two levels to e reclaimed are the 22k and 32 k, both with clear 5 waves move. These will give the trigger signal a new cycle has started. The best entry would be on the retracement after the 5 waves move up to 22k. Now any entry is at maximum RR but it could lead to capital erosion due to SL hitting multiple times.
Just play safe and wait for a clear trend reversal as these are risky times.
FOLLOW ME, SHARE, LIKE AND COMMENT

BTC Bitcoin fakeoutBitcoin has entered our first buy area:
I think this reversal is just a fakeout and BTC will continue the bearish trend.
Next week we will find out about important liquidations and maybe some crypto companies going out of business.
Besides a possible small bounce in the stock market next week, i don`t see any catalysts for now in the crypto space.
The chart is self explanatory for what i think it`s about to happen.
Looking forward to read your opinion about it.

Bitcoin analysis $12kThe $20k zone on the weekly timeframe doesn’t look very strong enough to hold the Power in the sell..there might be little retracements upwards but bitcoin must balance itself and might reverse between $12k-$10k .. invest safely

BTC Bitcoin: 200MA and Fibonacci RetracementHello friends, today you can review the technical analysis on the 1W chart for Bitcoin (BTCUSD).
Many people all around us are predicting that the crypto market will rebound and though I want to be optimistic, I have to be realistic because too many people bought crypto at high prices unlike some of these people on YouTube that bought under $500 so for them it's a different story. Simply said, be realistic about bitcoin and the markets.
1) Bitcoin price is shown from the beginning of when it was traded on the Coinbase exchange as noted in the chart on a 1W basis.
2) CryptoPickk shows the Fibonacci Retracement focusing in on two price points.
3) The Fibonacci level at 0.236 at $16.5K is close to the 200 MA (moving average) which is at $18K.
4) Lastly the prior all time high was around $20K.
5) That entire area as shown in the yellow rectangular box may be the area where price may get supported in case we are really in a bear market for Bitcoin and other cryptos.
6) Keep an eye on the RSI (relative strength index) which is very close to touching a multi-year trendline. If it bounces off of it, that would be amazing. If it goes below, it could get really bad.
7) These are the times to be a bit cautious and if you want to buy the dip, consider the downside potential.
8) Noted below are a few articles on why CryptoPickk believes the markets could drop further:
a) www.reuters.com
b) www.reuters.com
c) www.reuters.com
d) seekingalpha.com
It's not the time to get completely negative on the markets, but it is a time to start thinking about what to do next. Be cautious.
What are your opinions on this?
If you enjoy my ideas, feel free to like it and drop in a comment. I love reading your comments below.
Disclosure: This is just my opinion and not any type of financial advice. I enjoy charting and discussing technical analysis. Don't trade based on my advice. Do your own research! #cryptopickk

Bitcoin: Head Over HeelsBitcoin fell head over heels – not in love (or did it?) but rather into the magenta zone between $24055 and $18897. There, it still has more room to finish wave v in magenta – ideally in its lower third. Then, Bitcoin should take off its rose- or rather magenta-colored glasses and head upwards, crossing the resistance at $26591. However, there is a chance that Bitcoin could drop through the magenta zone and continue the descent instead.

Bitcoin bear market has come! Hello, my friends,
I bring exciting news.
BITCOIN just enter the bear market, the crypto winter we all have been waiting for is here! At last.
* Key points why we just enter the bear market
-RSI right above 50 pts, is either overbought or oversold, the tendency is to go down to oversold territory, which means more downtrend ahead.
-There's a huge weekly bear divergence taking place, and bear divergences tend to make sure they happen. Especially week bear divergences.
-200 MA, one of the most important factors on BTC, you can clearly see how it has been like a shepherd keeping the sheep in place.
The price has been above the 200 MA weekly for too long, and massive profits will be taken place soon.
-The loom of a period of economic uncertainty, not just cause of Evergrand default but the uncertainty of covid economic effect, especially the lack of measures to boost economic growth and really bad measures that have a strong penalty on companies in general.
-There wasn't been a correction yet (a decent one), there are huge profits to be made from investors that bought last year.
Prediction:
I believe the bear market (big correction) will take us to the weekly 200 MA. A value between 18-23k, on these values we will be for sure on oversold territory and ready to climb again.
SELL SELL SELL
SAVE YOUR MONEY, SAVE YOUR FUTURE, SAVE YOUR WIFE.

Bitcoin (BTC) forming bullish Butterfly for upto 22% pumpHey dear friends, hope you are well and welcome to the new trade setup of Bitcoin ( BTC )
Previously we had a nice trade of Bitcoin:
Now on a daily time frame, Bitcoin is forming the final leg of a bullish Butterfly pattern.
Note: Above idea is for educational purpose only. It is advised to diversify and strictly follow the stop loss, and don't get stuck with trade

Bitcoin BTC short Entry Range, Take Profit and Stop LossBTC/USDT short
Entry Range: $28300 - 29900
Take Profit 1: $27800
Take Profit 2: $26600
Take Profit 3: $25200
Stop Loss: $32500


If Bitcoin (BTC) needs to beak key resistanceHi friends hope you are well, and welcome to the new update on Bitcoin.
Big wedge and a key resistance:
On a weekly time frame, Bitcoin is getting bounced from the support of $28600 and the support of a big falling wedge pattern. If Bitcoin breaks out $33K resistance, then there will be a high probability that billions of more dollars will be invested in Bitcoin's market and this can lead BTC to break out the resistance of the falling wedge pattern as well.
Short term supports and resistances:
On a short-term, hourly time frame, Bitcoin is moving between $29300, $29600, $30600, and $31700 supports and resistance levels. Right now after getting rejected by $31.7k resistance, it has tested $29.8k support and right now trying to break out the $30600 resistance level.
Descending triangle:
On a 4-hr time frame, Bitcoin is forming another descending triangle and if the king of all cryptocurrencies breaks out the resistance of this triangle, then it can break out the key resistance of $33k as well.
Conclusion:
On a short term BTC has found some resistance and also formed a triangle as well, but breaking out this resistance can lead BTC to break bigger patterns and resistance on a weekly time frame as well.
Note: Above idea is for educational purpose only. It is advised to diversify and strictly follow the stop loss, and don't get stuck with trade


Bitcoin Price Update 2022 Week 23BTC bounces from 0.618 Fibonacci level and continues consolidating between the 0.5 and 0.618 levels for the last 5 weeks.
Following my prediction 2 weeks ago that Bitcoin has potentially reached its bottom we are seeing the second green weekly candle in 11 weeks after BTC made history with its 9 week decline since 21 March 2022.
Bitcoins global technical analysis outlook continues to provide signals the bottom is in with consolidation and upside from here on.
Should Bitcoins weekly candle close below the 0.618 Fibonacci we could see more downside till around $17500.
1. Horizonal trading volumes continue to rise from my last idea linked below and is on its way to become the second most traded price range which would signal this as a massive value area for buyers.
2. Trading volumes over the last 2 months remain at high levels showing good price conviction and demand.
3. Stochastic RSI trigger line has crossed over and is moving upward from the oversold zone showing upward momentum strength.
4. The two box areas which provided strong support previously in January 2021 and June 2021 continues to provide strong support in the third box area which going by previous durations would potentially last until end of June 2022 before we start to see a gradual increase in upward momentum into July 2022 and beyond.
Legendary Investment Trader, Cryptocurrency & Web3 Master
Boundless Lord


BTC Bitcoin: 1D Chart ReviewHello friends, today you can review the technical analysis idea on a 1D linear scale chart for Bitcoin ( BTCUSD ).
BTC Price looks like it is headed back up to the S/R line. If it can break above the line, it has a chance to go up to the $36K-$38K region, but if it fails the S/R line, it is coming down to $28K region first then even as low as $20K-$22K.
The Support and Resistance Line is very important to pay attention to before considering a move. I've added in the RSI and EMA in the chart.
If you enjoy my ideas, feel free to like it and drop in a comment. I love reading your comments below.
Disclosure: This is just my opinion and not any type of financial advice. I enjoy charting and discussing technical analysis . Don't trade based on my advice. Do your own research! #cryptopickk

Bitcoin BTC short Entry Range, Take Profits and Stop LossBTC/USDT short
Entry Range: $29375 - 30712
Take Profit 1: $28625
Take Profit 2: $27955
Take Profit 3: $36500
Stop Loss: $31714

Bitcoin - range trading Bitcoin continues the price action with low volume, low retail interest and small movements. The best you can do in this situation to preserve your wealth is to just trade the ranges. There are 3 clearly visible and very strong channels, which you can trade now:
1. LOW RANGE - currently we are sitting in this range. 28000 - 32000$, long the support and short the resistance - simple as that. Beware of spikes in both directions and use a proper stop-loss. If the support is broken (with a daily close below 28000$) I expect a retest of previous all time high around 20000$.
2. MIDDLE RANGE (32000 - 37500$) - a range that can be very interesting, because we have many major resistances in between. MA100 and MA50 on the daily are located around 34000$ and could change the game in the range.
3. UPPER RANGE (37500 - 48000$) - this is the range before new bullish momentum and a new all time high respectively. This is the place you would like to be, but I don't see it in the near 2-3 months.
TRADE SAFE!

btcusdt - Bullish trend - day 18 In this video, I was talking about the beginning of a trend
What do you think of this idea? What is your opinion? Share it in the comments📄🖌
If you like the idea, please give it a like. This is the best "Thank you!" for the author 😊
P.S. Always do your own analysis before a trade. Put a stop loss. Fix profit in parts. Withdraw profits in fiat and reward yourself and your loved ones

BTC Consolidation AreaThe past price action of Bitcoin told us that buying in the MicroStrategy average price area was a good idea.
Let`s see how it plays out this time.
Looking forward to read your opinion about it!
