BTCUSD - Back below 5.000I would like to share what I see regarding Bitcoin. I'm not trading it right now but my system is is still showing a sharp decline below 10.000 and below 5.000 in the following weeks.
Last week we finished printing a symmetric triangle what broke down yesterday.
The symmetric triangle is a continuation pattern , I highlighted the target price what is not funny at all.
21st May looked like we printed an ICL but if you check the RSI 5 you can see when we tagged the overbought territory price started to drop again . It means the ICL still ahead of us . The measured target from the pattern is showing 4353$.
100MA and 50MA crossed over and price had lost the 200 SMA.
While I see a lot of posts how Bitcoin will rally again this chart doesn't look bullish at all... I see a popped bubble what is going lower and lower in the ERA of inflation.
Bitcoinusd

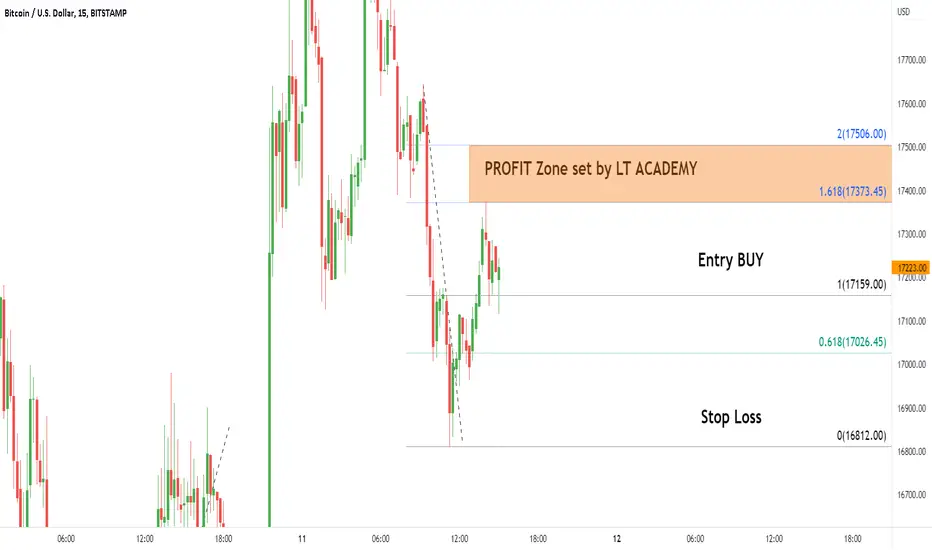
BTCUSD intraday trading & flying to the moon🚀 11 NOV 2022Bitcoin intraday trading alert
3 steps must fulfill before entry
1. 1st breakout done
2. Retracement done
3. 2nd breakout and see you in the sky🚀
Hope you like my Trading Alerts~
Cheers~
Bitcoin – BLOOD on the market!Hello, everyone!
First of all I wanna tell you that dump is not over. But I have also a good news. We will not see significantly lower prices than we saw yesterday. I tried to understand how this impulsive wave is forming and today I finally wanna show you the sub waves structure. Let’s go.
Let’s take a look at the 1h time frame BTCUSDT perpetual contract of the WhiteBit exchange. Here is the clear Elliott waves structure according to the trading chaos approach. Wave 1 started this crash. Wave 2 retraced to 0.61 Fibonacci level. Wave 3 was the most impulsive one. It have almost reached the 2.61 Fibonacci extension level and now Bitcoin is finishing the wave 4. It has the target $18200, but could be shorter. Wave 3 corresponds to extremal Awesome Oscillator. Wave 4 min condition have already been completed – AO crossed zero line.
Wave 5 target is approximately located at $15000 – there I am going to enter the positions with 60% of deposit. I have already bought a little bit yesterday at $15800 and today temporarily closed these positions. Good CPI data pushed the price higher, but data cannot change trend, remember it.
Best regards, Ivan

Bitcoin Analyze (Short Term, Timeframe 15min,11/10/2022)!!!Bitcoin was able to make a Double Bottom Pattern near the PRZ (Price Reversal Zone).
I expect Bitcoin will go up at least until my targets after breaking the trend line.
Bitcoin Analyze ( BTCUSDT ), Timeframe 15min⏰.
Do not forget to put Stop loss for your positions (For every position that you want to open).
Please follow your strategy, this is just my Idea, and I will be glad to see your ideas in this post.
Please do not forget the ✅' like '✅ button 🙏😊 & Share it with your friends; thanks, and Trade safe.

BTC Daily TA Neutral BearishBTCUSD daily guidance is neutral with a bearish bias. Recommended ratio: 40% BTC, 60% Cash.
* BOUNCE WATCH . Midterm elections are still undecided as results from Arizona, Nevada and Georgia are still being tallied. US October CPI report is due at 830am today , if it comes in lower we may get an intraday pump but the longer term trend is still down. In what feels like the most hectic two days in Crypto in a long time, Binance backed out of their bid to acquire FTX after looking into their balance sheet. Justin Sun tweeted that him and his team are putting together a solution for FTX ; FTX retweeted it . When LUNA/UST depegged and entered a death spiral on 05/07/22 - 05/09/22, Bitcoin went down 30% from 05/07/22 - 05/12/22; the FTX fiasco has brought Bitcoin down 25% from 11/08/22 - now. Cryptos are currently correcting up after a sharp downturn. Equity Futures, JPYUSD, GBPUSD, EURUSD, Natural Gas and Agriculture are also up. Whereas DXY, Long Term US Treasuries, HSI, NI225, Gold, Oil and CNYUSD are down. The third GDPNow US Q4 GDP estimate came in at 4%, up from 3.6% on 11/03/22 .
Key Upcoming Dates: US October CPI at 830am EST 11/10; UofM November US Consumer Sentiment Survey at 10am EST 11/11; Fourth GDPNow Q4 GDP estimate 11/16; Russia/Ukraine Grain Deal Expiration on 11/19; 2nd Estimate of US Q3 GDP at 830am (EST) 11/30; Last FOMC Rate Hike Announcement of 2022 at 2pm EST 12/14 . *
Price is currently bouncing off the uptrend line from March 2017 at ~$15750 as support and is also testing the descending trendline from November 2021 as support at ~$16700. Volume is back down to being Moderate (high) after reaching an all time in yesterday's session and is on track to break a four session streak of seller dominance if it can close today's session in the green. Parabolic SAR flips bullish at ~$21100, this margin is bullish at the moment. RSI is currently exhibiting bullish divergence with Price and is currently trending up at 32 after bouncing off of 25.60 support; the next resistance is the uptrend line from 01/22/22 at ~35. Stochastic is currently trending sideways and forming a trough at 6.50, a break above ~12 would be a bullish crossover. MACD is currently trending down at -449 with no signs of trough formation and is at risk of losing -232 minor support. ADX is currently trending up at 25 as Price continues to see selling pressure, this is bearish at the moment.
If Price is able to defend support at the descending trendline from November 2021 at ~$16700 then it will likely aim to retest $19417 resistance . However, if Price continues to fall below the uptrend line from March 2017 at ~$15750 , it will likely test $13477 minor support . Mental Stop Loss: (two consecutive closes above) $16700.

BTCUSDThe Godzilla will always find a resting place deep in the sea before it gains the energy to fight on the land. This is the same view I have with BTC, it looks like it loves its resting place at 200MA's before regaining its energy to rally. I am not saying that I am absolutely right, if I'm wrong then I am wrong. But looking at the pattern, still it couldn't convince me that price will make a reversal anytime soon.
In fact, in my opinion, it will keep continue resting until the 20k level, and you know what, it still won't make any difference until any price emerges which shows buying power overcome the selling pressure. It may also continue downwards to 6k level if sentiments continues, there is a chance that it will never go up.
Good Luck.

BTC Bitcoin Triple Bottom If you haven`t sold the regional Double Top on the Bearish Flag chart pattern:
Then you should know that now we have a Triple Top Bullish formation.
I expect BTC Bitcoin to make a bounce before retracing at the $15300 level before the year end.
Looking forward to read your opinion about it.

Bitcoin Forecast after the Elections The first price target from the previews chart was perfectly touched:
Now i expect either a drop to $14850 by the end of the year, or a small price increase followed by a dump to $17160.
Looking forward to read your opinion about it.

Bitcoin Crypto-Soap Opera Saga with FTXInv Cup and Handle formed on Bitcoin following FTX and Binance soap opera drama.
With investors and institutions being spooked out of the crypto market following the accusations of FTT being insolvent and with Binance CEO selling over half a billion US dollars, this is the reason why we saw other major cryptos like BTC, ETH, USDT, and FTX crashing like it did...
First target $12,759

Bitcoin Analyze (Short Term, Timeframe 15min,11/09/2022)!!!Bitcoin broke the support zone and is currently pulling back to the trend lines and this zone.
Also, we can see the divergence between Price and Volume.
I expect that Bitcoin will touch at least the last bottom (17166$).
Bitcoin Analyze ( BTCUSDT ), Timeframe 15min⏰.
Do not forget to put Stop loss for your positions (For every position that you want to open).
Please follow your strategy, this is just my Idea, and I will be glad to see your ideas in this post.
Please do not forget the ✅' like '✅ button 🙏😊 & Share it with your friends; thanks, and Trade safe.

2 TradingView indicators for trading BitcoinThe indicators offered by TradingView extend beyond their usefulness for forex, commodities, and stock trading and into the world of cryptocurreny.
In this article, I want to explore two TradingView indicators that Bitcoin traders may like to take a closer look at.
Sentiment Indicators
Cryptocurrency is an asset that can rely heavily on the sentiment of the market, perhaps more so than any other asset as its value is not so obviously tied to fundamental data like stocks and currencies. As such, paying attention to Bitcoin’s public and market sentiment can be vital in helping traders decipher the price action of this particular asset.
A few Bitcoin sentiment indicators exist on TradingView, with two freely available versions being the Bitcoin Futures Market Sentiment and the Bitcoin Binance Sentiment Index.
Bitcoin Futures Market Sentiment
You can use this indicator to simply illustrate optimistic and pessimistic market sentiment in the Bitcoin futures market. The red bars are indicative of pessimistic sentiment and green bars indicative of positive sentiment. The size of the bars also implies the degree to which the market is in either of these conditions.
Bitcoin Binance Sentiment Index.
The Bitcoin Binance Sentiment Index suggests market sentiment by measuring the divergence between futures and spot Bitcoin prices (as pulled from Binance). The sentiment must be decoded a little more than the Bitcoin Futures Market Sentiment Indicator but can still be done quickly and easily. When the value of the indicator is above 100, the average price of futures is above the spot price for a designated period suggesting a bullish outlook. Conversely, when the indicator’s value is below 100, the opposite is true.
Bitcoin Bullish Percent Index
The Bitcoin Bullish Percent Index analyses a wider segment of the cryptocurrency market in an attempt to understand Bitcoin. This indicator is designed off the assumption that a strong relationship can exist between some cryptocurrencies, and that individual cryptocurrencies typically like to move in unison
You can think of The Bitcoin Bullish Percent Index like a general RSI (Relative Strength Indicator). When the indicator is valued between 50.00 and 70.00, you might like to consider the cryptocurrency market as a whole (as well as Bitcoin) as overbought. When the Indicator is above the 70.00 level, you might like to consider it as extremely overbought.
Conversely, when the indicator is valued between 50.00 and 30.00, you might like to consider Bitcoin as oversold. When the Indicator is below the 30.00 level, you might like to consider it as extremely oversold.

Bitcoin – HUGE CRASH is not over!Hello, everyone!
Exactly! Exactly as was predicted. Bitcoin reached $21500 and crashed. I am proud that I finally learned a little bit about trading chaos approach and correctly anticipated the Elliott waves. In my last analysis I told you that that wave 5 of previous wave higher order will be finished at $21500. Today we saw the start of the wave 3 – the most impulsive wave. Let’s go!
Let’s take a look at the BTCUSDT chart 1h timeframe of the WhiteBit exchange. Here we can see that after the wave 1 have been finished wave 2 reached exactly 0.61 Fibonacci retracement before showing us the crash in the wave 3. Let’s notice that wave 3 reached exactly the 1.61 Fibonacci level and now I am waiting for the local correction to 0.61 Fibonacci level, approximately to $19k. Here will be the nice short opprtunity.
The dump have not finished, the bear market will continue to $12k. Of course I observe the market and can change my targets, but now I consider 1-2 months of dumping before the bear market end. I have been waiting for this dump 2 months earlier, but market decided to annoy me with the flat.
Best regards, Ivan

Bitcoin (BTC) formed bullish Shark for upto 16% pumpHi dear friends , hope you are well and welcome to the new trade setup of Bitcoin ( BTC )
During the previous dump, we cauth a nice pump of Bitcoin as below:
Now on a daily time frame, Bitcoin has formed a bullish Shark pattern.
Note: Above idea is for educational purpose only. It is advised to diversify and strictly follow the stop loss, and don't get stuck with trade

BITCOIN BTC bearish move ahead :(One last liquidity move up for btc before going to new lows.
setting two short orders at
21210 50%
21880 50%
take profit prices
19350$ 25%
18300$ 25%
17050$ 25%
15800$ 25%
this move is obviously going to take days.
follow for more and visit link in bio private signals.

What is going on with Bitcoin?!!!As we see this falling wedge being broken down to the price of approximately 19.7k we did wick to 19.3k to hit some stopp-losses and retested some important key price levels.
Should we be worried? No! Well no for now.... let me explain.
We need to see Bitcoin holding above some key levels. Those levels are:
19.3k
19.750k
20k
If we break 19.3k we could go down to 18.6k
Trade safe!

Bitcoin hit our target! Now what?Yesterday we spoke about breaking down. We hit the target but what can we expect for the next move?
Well we need to see Bitcoin going back above 21k for more upwards momentum and the possibility to break 21.5k if we don't get enough volume we might eveb break below 20.4k
Trade safe!

Bitcoin BTCUSD Next Possible Move#BTCUSD ( Bitcoin / U.S Dollar )
RISING WEDGE in Long Time Frame #LTF
Rejecting from the Upper Trend Line #UTL
ELLIOT WAVE - Completed " 12345 " Corrective Wave
Break of Structure #BOS need to wait for the Retracement
Selling Divergence

BITCOIN trade for the weekendWe hope that the market has already processed the news related to the Fed's actions and statements and has calmed down a bit.
So we can try a conservative trade of buying Bitcoin:
Entry $18651
Stop $18089 (-3%)
Take profit $21444 (+14.98%)
P/L ratio 5/1
_____________________
Did you like our analysis? Leave a comment, like, and follow to get more

BITCOIN - BULLISH MOVE 🚀🚀the BTCUSD price breaks the daily Resistance level ,the old resistance becomes new support level ✔
the last higher high is broken 🔥
so, i predict a bullish move 📈 i'm waiting for a pullback 📉
TARGET: 22380.92🎯
if you agreed with this IDEA, please leave a LIKE, FOLLOW or COMMENT!

October closing price $20,498 - could be a Buy signal for Nov it is quite obvious what bitcoin is about to do here.
Bitcoin is about to pump our bags. you dont have to short this.
dont get me wrong. nothing in the crypto market is for sure. . .
June - short (-76%)
July - Long ( +28%)
Aug - short ( - 21% )
sep - short ( - 18% )
oct - Long ( +13% )
Nov - Long ( +? )
Dec
Do I really need to go into detail here?
i think the bears in this quarter of the year got nothing to dump. anymore
the entire market in the past month has been on a selling spree,
i would speculate based of TA that bitcoin would hit the levels respectively
Level 1 - $ 23,288
Level 2 - $ 31, 861
tell me what do you think

Is Bitcoin ready to break out?!As we see a bull flag forming Bitcoin will likely break it to the upside with a price target of approximately 21.6k if we hit that expect a retest of 21.5k before moving up more.
Trade safe!

BTCA descending triangle has formed on the Bitcoin chart, this is a pattern of the continuation of the downward trend, and many expect it to be broken. However, in our case, it is possible to work in the opposite direction, and here's why.
I think several large traders have been gaining positions for 5 months already, at the levels of 18000-20000, and in order for them to gain a position, they should create sawtooth movements, i.e. false breakouts up and down. As a result of such actions on the chart, the descending triangle should become a rectangle with sides 18.000 - 22.500 (25.000) . At some point, it is likely that the price will follow the stops to the level of 16.000.
My opinion is that bitcoin is in accumulation, and this is a good sign of further rapid growth, under fundamental economic and other conditions.

BTCUSD - Risk Assessment (LOW!) An indicator showing the risk on BTC
Each period in blue down the bottom shows the low of each cycle
Interesting seeing the earlier peaks in red both topping out but the 2022 top is slightly below the top red, this may be an indicator that BTCUSD is becoming less volatile and a more stable asset
Regardless, price is currently within the blue zone, a good buy point
