Bitcoin Coffee Time- Very Quick and simple update.
- Everything is in graphic.
- Nothing much to say.
- Not a price prediction.
- Just tell me, how do you like your coffee ?
Happy Tr4Ding !
Bitcoinusd

BITCOIN📊 #BTCUSDT
⏱ TIME: 1D
📝According to the pinned analysis at the bottom of the page (previous post), Bitcoin is currently completing its fifth wave, with its first expected resistance range around $93,000 to $95,000.
If this range is lost, the next resistance level is between $111,000 and $115,000.
If a divergence appears with the RSI indicator at these resistance levels, it could be a signal to enter a sell position.
If the price gets rejected from the specified levels, I will announce the targets and update the analysis.
If you want me to analyze another currency, comment its name. Thank you❤️

Orca is Set to Flip Ray!COINBASE:ORCAUSD 🐋 BINANCE:SOLUSDT KRAKEN:RAYUSD COINBASE:SOLUSD BITSTAMP:BTCUSD
Orca is on track to surpass Raydium (RAY) as the top DEX in the Solana ecosystem! With an incredibly user-friendly interface, rapidly growing trading volume, and a limited token supply, Orca is attracting more users and major investors daily. Orca not only delivers speed and efficiency but also provides incentives that make it the favored choice among DeFi traders, setting the stage to flip Ray very soon!
Why Orca Will Flip Ray:
Superior Interface and User Experience: Orca makes DeFi accessible to everyone, whereas Raydium remains more technical and less user-friendly.
Growing Volume and Liquidity: Orca’s volume is rising fast, a clear sign that the market is shifting in its favor.
Attractive Tokenomics: With only 55 million tokens, Orca’s scarcity offers greater potential for value growth than Raydium.
Incentives and a Community Focused on Growth: Orca invests in its community with incentives that boost engagement and sustainable growth.
Orca is solidifying itself as the premier DeFi opportunity on Solana, and the anticipated flip of Ray is only a matter of time.
Get ready to see this DEX revolutionize the ecosystem!

Bitcoin could shock us- everything is in graphic as always.
- I have always been conservative about the next top.
- As trader i believe in trends.
- i always said : " more it takes time to go up, more higher we will go"
- be ready for the unexpected.
Happy Tr4Ding and Stay S4fe !

DOGE SWING DOGE COIN
Already the downtrend started in May.
Clear resistance at 0.13, breaking out this resistance can lead to an impulsive move to the 0.20

Bearish Signals Ahead:Pattern Could Trigger a Downtrendhello guys.
let's analyze btc!
Pattern Formation: The chart shows a classic "Head and Shoulders" pattern, a bearish reversal indicator. The pattern consists of a left shoulder, head, and right shoulder.
Resistance Level: The recent price action reached a resistance zone, forming a double top near 69,000. This is a key level where sellers have shown strength.
Blue Zone (Engulfing Condition): If price can break and close above this blue highlighted area, it could indicate a possible bullish recovery.
Potential Downward Movement: If the pattern plays out as expected, and price breaks below the neckline support (around 66,500), it may confirm the downtrend, targeting lower levels.
Key Support Zone: The ultimate support is marked around 64,500, where buyers might look to enter if price declines.
long story short, get a short position and put your stoploss behind the blue area if your stoploss hits then change the strategy to long! until the $69020 area!
short target is $64503

Bitcoin: Is a New Bullish Run on the Horizon? Despite Bitcoin's impressive 50% rise this year, the past six months have been challenging for investors. After the much-anticipated halving event in April, many expected a substantial surge in Bitcoin's price. However, since then, the cryptocurrency’s value has remained relatively stagnant, currently hovering around $68,600. This situation leaves investors at a crossroads: should they continue to invest in Bitcoin with hopes of significant gains, or is it time to explore other high-risk, high-reward alternatives?
The Investment Dilemma: Short-Term vs. Long-Term Outlook
If you are contemplating an investment in Bitcoin, managing expectations for the remainder of the year is crucial. Current predictions suggest that Bitcoin has about a 57% chance of reaching a new all-time high in 2024, making it essentially a coin toss as to whether it will surpass its previous peak of $73,750. The probability of Bitcoin hitting the much-anticipated $100,000 milestone this year stands at a modest 14%, further highlighting the uncertainty in the short term.
However, the long-term outlook for Bitcoin remains optimistic. For instance, investment firm Bernstein predicts that Bitcoin could reach $200,000 by the end of 2025. Visionaries like Cathie Wood, founder of Ark Invest, foresee Bitcoin soaring to $1 million by 2030. Even more ambitious, Michael Saylor, founder and executive chairman of MicroStrategy, believes that Bitcoin could reach a staggering $13 million by 2045.
For investors seeking short-term gains, Bitcoin may not be the best option at present. Tech stocks, such as Nvidia, which has seen a 159% increase this year, could offer more immediate returns. However, for those considering a longer investment horizon—five years or more—Bitcoin still presents a solid opportunity for growth.
Bitcoin’s Role in the Future Financial System
One of the most compelling reasons for Bitcoin’s long-term potential lies in its ability to transform the global financial landscape. Bitcoin is more than just a digital currency—it is underpinned by blockchain technology, which promises faster, cheaper, and more efficient financial transactions. The potential to disrupt traditional financial systems and become a cornerstone of the global economy is what makes Bitcoin an attractive investment.
Cathie Wood likens Bitcoin's potential to that of the "information superhighway" that revolutionized the internet. She envisions a "financial superhighway" where blockchain replaces the internet and economic value replaces digital information. Wood predicts that Bitcoin could reach $1.5 million within a few years, a reflection of its transformative power.
However, it's important to remain cautious about such lofty predictions. While Bitcoin’s revolutionary potential has been touted for over a decade, much of its promise as a viable payment method remains unfulfilled. For example, when was the last time you used Bitcoin for an everyday online purchase? Adoption, though growing, is still not at a level that justifies these sky-high predictions.
A New Wave of Political Support for Bitcoin
One significant shift in 2024 is the rise of political support for Bitcoin in the United States. There's growing awareness that the US is lagging behind other countries in terms of crypto adoption. High-profile politicians, including former President Donald Trump, have started advocating for America to become the “crypto capital of the world” and a “Bitcoin superpower.” The idea of a “Bitcoin arms race” with other nations is gaining traction.
In July, Senator Cynthia Lummis (R-Wyoming) proposed the idea of establishing a national strategic reserve for Bitcoin. She suggested that the US should commit to acquiring 5% of all Bitcoin in circulation, similar to how the country maintains a strategic oil reserve. While this may seem bold or even risky, it reflects the growing belief in Bitcoin’s long-term value.
These political developments add momentum to the optimistic price predictions, but it's important to remember that Bitcoin won’t skyrocket to $1 million overnight, even with the introduction of Bitcoin ETFs or strategic reserves.
Bitcoin’s Price Journey and Future Prospects
Since 2013, Bitcoin has risen from $100 to its current $68,600. If you believe in its continued upward trajectory over the next decade and are prepared to endure the inherent volatility of cryptocurrencies, it might be worth considering an investment while the price remains below $100,000.
However, the question remains: is Bitcoin ready for another major rally?
Technical and Market Insights
From a technical standpoint, Bitcoin is currently sitting on a significant dynamic resistance trendline, which it has failed to break through five times since March 2024. The more a support or resistance level is tested, the weaker it becomes. This suggests that Bitcoin may be gearing up for a potential breakout.
Additionally, the latest Commitment of Traders (COT) report reveals an interesting contrast. Commercial traders, often referred to as "smart money," are increasing their long positions, while large speculators have turned bearish. This divergence could indicate that the institutional market believes a bullish run is imminent, while retail traders remain cautious.
Adding to this, the seasonality pattern from last year showed a strong bullish run starting around this time. Could history repeat itself? The confluence of a weakening resistance, smart money bullishness, and favorable seasonality patterns could point to a new upward movement for Bitcoin.
Conclusion: Should You Buy Bitcoin Now?
Bitcoin's current situation presents a mix of opportunity and risk. While the short-term outlook remains uncertain, the long-term potential for Bitcoin as a transformative force in the global financial system is undeniable. With institutional investors showing increased interest and political support growing, Bitcoin could be on the verge of a significant breakthrough.
For those with a long-term investment horizon and the ability to weather volatility, Bitcoin remains a strong contender in the world of high-risk, high-reward assets. However, if you’re looking for short-term gains, you may want to explore other options like tech stocks, which have been delivering exceptional returns this year.
What do you think? Will Bitcoin finally break through its resistance and embark on a new bullish run? Let us know your thoughts in the comments below.

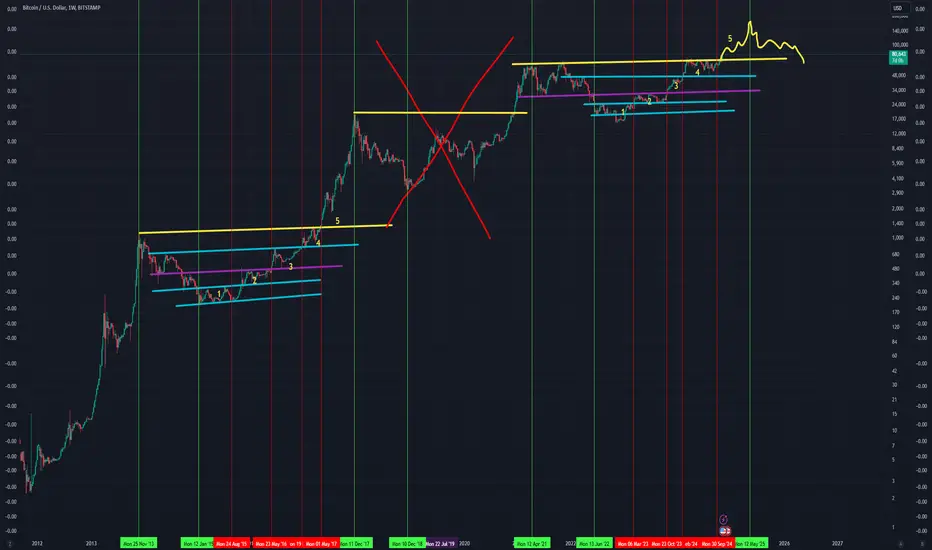
Bitcoin Cycle Analysis: Preparing for the Next Bull Market Peak
In my detailed Bitcoin market analysis, I have identified that we are currently navigating through *Phase 5 of the bull run cycle*. This phase marks the last segment of the upward trend within the broader market cycle, signaling an important period for long-term crypto investors and traders.
-Cycle Insights: Historically, Bitcoin has demonstrated distinct cyclical patterns, and by analyzing past market data, I project that the peak of this bull market cycle is likely to occur around **April to May 2025**. This projection aligns with market dynamics, on-chain data, and cyclical behavior that the crypto space has followed in previous cycles.
-Strategic Recommendations for Investors:
1. Prepare Your Strategy:
Now is the critical moment to solidify your exit strategy. Identify key targets for your holdings and set alerts for market movements as we approach the anticipated top.
2. Market Sentiment & Data Tracking:
Monitor sentiment closely; as we approach cycle peaks, irrational exuberance often takes hold. Combining technical indicators with on-chain data will help pinpoint optimal selling windows.
3. Manage Risk:
Avoid getting caught in the frenzy. Ensure you have a disciplined approach to profit-taking and risk management as market volatility is expected to rise.
Next Steps: We still have time to observe the final leg of this bull market. Being proactive in understanding the cycle's behavior will be the key to optimizing returns. Whether you are a long-term holder or a short-term trader, planning your moves ahead will differentiate strategic success from missed opportunities.
Let's keep our eyes on the charts and prepare our sell strategies accordingly to maximize this cycle's potential gains.
What do y'all think...Shall we continue the groove?Hey everyone, just messin around with random ideas. Who knows, honestly just wanted to publish this because it might just work.
Some close numbers in the previous two bear to bull cycles. I just measured the highs&lows of previous cycles along with duration.
The numbers for the two previous full cycles were pretty close, so I just mapped the average out for our current situation.
Still can retest lows but too much beyond that is probably out of sight.
Dunno, not financial advice and just experimenting.
Any insight?
Hope everyone is well, thanks for your time.

BUY Dogecoin finally !!If you like my Idea, Don't forget to Boost and comment on my Analysis.. The recommendations are purely for educational purpose only, consult you financial advisor before trading.
if you have any questions do not hesitate to contact me.

BTC - Kingdom I have this for Bitcoin... It's been a few months since I checked it
I specified the points that it reaches and the places that it is likely to reach and the reaction of the body.

HODL or FOLD - As always, everything is presented graphically.
- This isn't a price prediction.
- Which trend do you prefer: $125K or $250K?
- Share your thoughts in the comments!
Stay strong, don’t give food to the Whales!
Happy Tr4Ding!

Is It Too Late to Invest in Bitcoin? A Comprehensive Analysis
Bitcoin, the world's largest cryptocurrency, has once again defied expectations, reaching a new all-time high of nearly $77,000. This latest surge has ignited a wave of excitement and speculation within the crypto community. While some analysts warn of potential risks, others remain bullish on Bitcoin's long-term prospects.
A Bullish Outlook
It is believed that the recent price surge is driven by a combination of factors, including increasing institutional adoption, growing global interest, and the potential for further price appreciation.
The Role of Institutional Investors
One of the key drivers behind Bitcoin's bull run is the growing interest from institutional investors. Traditional financial institutions, such as hedge funds, pension funds, and corporations, are increasingly allocating a portion of their portfolios to cryptocurrencies. This institutional adoption has brought significant capital inflows to the crypto market, fueling price increases.
Technical Analysis: A Bullish Perspective
Technical analysts have identified several bullish indicators that suggest Bitcoin may continue its upward trajectory. The recent breakout above key resistance levels and the formation of a bullish flag pattern are positive signs for the cryptocurrency. However, it is important to note that technical analysis is not foolproof, and market conditions can change rapidly.
Potential Risks and Challenges
While the current market sentiment is overwhelmingly bullish, it is essential to acknowledge the potential risks and challenges facing Bitcoin. One of the primary concerns is the potential for a market correction, which could lead to significant price declines. Additionally, increased regulatory scrutiny and geopolitical tensions could also impact the cryptocurrency market.
The Future of Bitcoin
As Bitcoin continues to break new records, the future of the cryptocurrency remains uncertain. However, the long-term potential of Bitcoin as a store of value and a medium of exchange is undeniable. As the global financial landscape evolves, Bitcoin's role as a digital asset could become increasingly significant.
Conclusion
Bitcoin's recent price surge has captured the attention of investors and traders worldwide. While the cryptocurrency market is inherently volatile, the underlying fundamentals of Bitcoin remain strong. As institutional adoption continues to grow and technological advancements drive innovation, Bitcoin's potential for further appreciation is significant. However, investors should approach the market with caution and be prepared for potential volatility.
Disclaimer: This article is for informational purposes only and should not be construed as financial advice. It is important to conduct thorough research and consult with a financial advisor before making any investment decisions.

Bitcoin BTC price decides where to go nextAlmost all indicators are at extremely critical and decisive points:
1️⃣ CRYPTOCAP:BTC - $68300
2️⃣ BTC.D - 59% and continues to update local highs
3️⃣ USDT.D - 5.25% on the verge of a breakout or rebound upwards
4️⃣ Fear and Greed Index - 73 (greed)
🐳 Blue scenario - a sharp exit from the correction channel and movement towards $77-78k.
💔 Red scenario - correction OKX:BTCUSDT to $64000, and maybe even to $ 61k
Vote which scenario you think is more likely.
We will supplement this idea with interesting charts and our own opinion after we have 100+ votes.

Bitcoin standard in progress..This idea is more of a message than an investment speculation. And a reset of my previous ideas with shitcoins reminding me of where I was.
We need to learn from the past and put it behind us, looking to the future because our actions affect our future, not our past. Much has changed since my first experience with cryptocurrencies (early 18). Yes, it usually starts with cryptocurrencies, rarely bitcoin only. And when bitcoin only, few can resist the lure of shitcoiners, the potential profit. In short, I don't think a bitcoin maxis can grow without proof-of-work, without cutting through the jungle of scammers. But if the individual in question is a thoughtful creature and occasionally examines the arguments for/against, why yes/no, and is not lazy to verify the arguments in question, to read something, they will come to the inevitable conclusion, that's my opinion. My opinion is that we are very lucky that bitcoin was created, we have the hope of freedom, versus the inevitable inflationary, monetary and tax bullying, surveillance by the state. We are fortunate that it came into existence as it did - naturally, anonymously. That is unrepeatable in this day and age. That alone is a bulletproof foundation and a guarantee of my peaceful sleep. I could list dozens more. But I won't prolong it.
Thanks for bitcoin , for the hope of a better future.
Always and forever bullish , there is no ceiling. Dips are discounts, that's all. Volatility is a feature, not a flaw. Welcome volatility , learn to work with it. It's a game for the long term. Forget fiat profits, only increase the stack of bitcoins owned. Use HW wallets for your savings! Once the bull market hits, it's time to reward yourself, enjoy life, send some of that bitcoin back out into the world for some fine goods, services. Bitcoin is money that makes sense to save in. Simple.
Satoshi thank you!

bitcoin weekly analysisBitcoin experienced a bullish surge this week, successfully breaking through the resistance level that has been forming since March 2024. However, it is important to note that Bitcoin has now reached the resistance of the channel up pattern, and a correction toward the channel up support at the 70,329 level is possible.
This analysis will be updated if new key levels are identified. Thank you.

BTC Weekly Chart is Showing Major StrengthThe last weekly close and open for BTC have broken the overall weekly structure of consolidation. A weekly close above the support would confirm this. Things are looking good for BTC in the bigger picture. Hold on to your hats, we have a year of volatility coming to us.
Not financial advice.
Do your own DD.
Thanks for looking at the idea.

Where to from here $BTCSpeculation. What do you think has impacted the price action today was it all Trump fueled or was it other factors in play? Cheers

BTCUSD LONG FOR TARGET 69392At current label BTCUSD buy for the target of 69392 with a small stoploss 68749

BITCOINBitcoin analysis
Time frame of 4 hours
Due to the fact that the daily time frame of Bitcoin is bullish, you can enter into purchase transactions in the specified areas after seeing the confirmation.

Are We Approaching a New All-Time High for Bitcoin...?Bitcoin has been following a specific trendline for almost two months, a pattern that has seen it bounce back from this line four to five times in the past. As it stands, Bitcoin is currently facing strong resistance at its all-time high, which is around 73400 dollars. Meanwhile, the trendline serves as a crucial support level.
Investors and enthusiasts are closely watching this situation, as the coming days will be critical. The main question on everyone's mind is whether Bitcoin will manage to its all-time high resistance or if it will break below the trendline support. Keeping an eye on these key levels is essential, as they may present significant trading opportunities. Stay vigilant!

Bitcoin Approaches All-Time HighMarket Update - November 1 2024
Fueled by positive market sentiment, the price of bitcoin exceeded $73,100, just shy of its all-time high: The Fed’s decision on rate cuts could further fuel a price increase, but bitcoin pulled back Thursday toward $70,000 amid a broader tech sell-off.
US spot bitcoin ETFs recorded $870 million in inflows on Tuesday, led by BlackRock’s IBIT with $629 million: It’s believed that bitcoin’s swelling price might be contributing to investment in these funds.
Florida CFO Jimmy Patronis has requested an evaluation of the feasibility of adding bitcoin to the state’s public pension funds: The state of Florida has typically shown keen interest in crypto initiatives, with Governor DeSantis having made proposals to allow businesses to pay tax in bitcoin in 2022.
Hong Kong Exchanges and Clearing Ltd. (HKEX) will launch the “HKEX Virtual Asset Index Series” on November 15, providing reference prices for BTC and ETH during the Asian trading day: The indexes aim to offer transparency and support for virtual asset investment decisions in the region.
Weekly sales of NBA Top Shot NFTs have hit a six-month peak, with 43,600 NFTs sold as of October 27, marking a 94% jump from the previous week: Renewed excitement from the season opener is driving the surge in activity after a slow offseason.
Bitcoin Surges Past $73,000, Pulls Back on Thursday
Bitcoin climbed above $73,000 Tuesday, marking the first time it breached this level in over seven months. The renewed surge comes near the end of a strong year for bitcoin, partly driven by the SEC’s approval of spot bitcoin ETFs and anticipated rate cuts in the US. Tuesday was also reported to be bitcoin’s biggest trading day in months, as volumes skyrocketed. However, the price of bitcoin retreated Thursday, pulling back toward $70,000 as the broader tech market recorded mixed earnings results.
Federal Reserve decisions in particular have been playing a role in bitcoin’s recent rally, with bitcoin rising from around $54,000 in early September as expectations for a rate cut increased. A majority of analysts currently anticipate a 25 bps cut November 7, which could drop rates to the 4.5% to 4.75% range. If this comes to be, it would most likely add to the current bitcoin trading frenzy.
Some analysts are bitcoin to climb even higher before the end of the year as market conditions become more favorable. It could depend on numerous factors, and will most likely be influenced in some form by the results of the upcoming US presidential election.
💱 Topic of the Week: Traditional Lending vs. Crypto Lending
🫱 Read more here

Bitcoin Update: About to start rocketing to 100K!BTC is making a decent change of character on the daily chart and now it’s making new highs. According to my latest analysis on Bitcoin, the bullish scenario of breaking above 70K has played out and now we’re closing the price above 70K.
In the current situation, I expect a minor correction to 66K before starting the main rally for Bitcoin to higher price levels and making new all-time highs, with the major resistance target of 100K.
The correction is invalid if the price closes a daily candle above 74K, and the bullish impulse from 66K to 100K is dismissed for a while if the price breaks below 65K.
DYOR

#overbought bitcoin.. correction loading..Pull backs are market reality, as momentum decreased and rsi heading to overbought area , correction will not be a surprise.
shorting a trending market is not a good idea, but better to remain cautious and gradually taking profit can be a good approach.
