How Blockchain Works in 6 StepsThe future of apps, programmes, trading, investing and businesses all lie in one underlying technology – Blockchain.
You’ve probably heard about it when it comes to crypto-currencies.
But it extends so far beyond them.
In this section, you’ll think of it in a whole new level where you’ll be able to:
• Understand blockchain in a nutshell
• Understand the power and possibilities it will bring to the world
• See the trading and investment opportunities to come
Let’s get to it…
What blockchain is in a nutshell…
In short, a blockchain is one continuous digital ledger of records and transactions which are organised, verified, and positioned next to each other in ‘blocks’ linking a permanent and transparent chain of other ‘blocks’.
Here’s a short illustration on how a Blockchain works…
The important concept with blockchain is that, the chain “ledger” of transactions are neither stored in a central location nor is managed or run by a single entity.
We say the blockchain is decentralised, secure and the transactions are added permanently in a transparent and resilient manner using cryptography (special codes).
The parties between the transaction will also remain anonymous while enjoying the security, transparency, speed and cost efficiency.
This will have major advantages over centralised systems in a way that:
• The transactions will be easy to track
• There’ll be less manipulation and corruption
• There’s more transparency
• There’ll be less costs and less middlemen.
NOTE: To alter one block, you’ll need to change every block throughout the network (which is virtually impossible).
And as the historical blocks information stays the same – you’ll be able to forever track the old transactions with the given public information.
I’m talking about these main sets of information each ‘block’ has.
1. The data of the new block (code or digital fingerprint)
2. The hash of the previous block (code – letters & numbers)
3. A time stamp
4. Transaction data
Once you understand the process and how secure a blockchain is, you’ll see how it will not only disrupt industries but it will also change the global and financial economy as we know it.
Trade well, live free.
Timon
MATI Trader (Financial trader since 2003).
Feel free to follow my socials for more real-time posts!
Blockchain

BTC Dominance Structure Today I leave you with a rather interesting comparative analysis, introducing the much-studied and used concept of market capitalization dominance, in our case of Bitcon versus the rest of the crypto market.
The graph structured by TView gives us in this case a percentage of market dominance, that of Bitcoin against altcoins,
ideal for establishing migrations from bitcoin to altcoins according to their profitability at certain times or vice versa.
In general, it is well known that altcoins take a little longer than bitcoin to raise their prices, but when this happens they skyrocket above their profitability,
in the case of falls it is similar but inversely if bitcoin falls the alts tend to have much larger falls.
The comparison that we bring today with the graph in red shows us the concept of numerical dominance, without percentages, in this case the amount in the top 80 Cryptos that are in annual profitability above Bitcoin.
A very interesting concept that we will develop further in further analysis.
-------------------------------------------
Hoy os dejo un análisis comparativo bastante interesante, introduciendo el tan estudiado y usado concepto de dominancia de capitalización de mercado, en nuestro caso de Bitcon frente al resto del criptomercado.
El gráfico estructurado por TView nos da en este caso un porcentaje de dominancia de mercado, el de Bitcoin frente a las altcoins, ideal para establecer migraciones de bitcoin a altcoins según su rentabilidad en ciertos momentos o viceversa.
Por lo general es bien sabido que las altcoins tardan algo mas que bitcoin en levantar sus precios, pero cuando esto se da se disparan por encima de su rentabilidad, en el caso de las caídas es similar pero a la inversa si bitcoin cae las alts tienden a tener caidas mucho mayores.
La comparación que traemos hoy con el gráfico en rojo nos muestra el concepto de dominancia numérica, sin porcentajes, en este caso la cantidad en el top 80 Cryptos que se encuentran en rentabilidad anual por encima de Bitcoin. Un concepto muy interesante que desarrollaremos más a fondo en nuevos análisis.

January 6 BTCUSD BingX Chart Analysis and Today's HeadlineBingX’s Bitcoin Chart
In the first trading week of 2023, the market was still consolidated with extremely low volatility and trading volume. Bitcoin's volatility has hit record lows one after another, and a new round of changes is brewing. The probability of Bitcoin's upward turnup still exists, but it needs to wait patiently for market confidence to recover.
Today’s Cryptocurrency Headline
Shopify Supported All Merchants to Directly Sell and Mint NFT on Avalanche
According to Decrypt, the e-commerce giant Shopify announced that it has supported millions of online merchants on the platform to directly sell and mint NFT on the Avalanche chain without guiding customers to the NFT market such as OpenSea or Magic Eden. This function was developed in cooperation with Venly, a blockchain technology startup.
Disclaimer: BingX does not endorse and is not responsible for or liable for any content, accuracy, quality, advertising, products, or other materials on this page. Readers should do their own research before taking any actions related to the company. BingX is not responsible, directly or indirectly, for any damage or loss caused or alleged to be caused by or in connection with the use of or reliance on any content, goods, or services mentioned in the article.

ETH - Now We Wait!⏱Hello TradingView Family / Fellow Traders. This is Richard, as known as theSignalyst.
ETH has been slightly bullish trading inside the rising channel in brown.
ETH is currently sitting around the middle of the channel, which is a no-trade zone to me.
🗒 So now, we wait...
As ETH approaches the upper brown trendline and blue resistance, we will be looking for reversal sell setups.
In parallel, as ETH approaches the lower brown trendline and green support, we will be looking for trend-following buy setups.
We would be slightly bullish, unless or until we break below the lower brown trendline.
Always follow your trading plan regarding entry, risk management, and trade management.
Good luck!
All Strategies Are Good; If Managed Properly!
~Rich

January 5 BTCUSD BingX Chart Analysis and Today's HeadlineBingX’s Bitcoin Chart
Bitcoin has hit the resistance level of $17,000 twice in a row, and it still has not successfully broken through. At present, Bitcoin has risen and fallen back, but there is still the possibility of a rebound in the short term. If Bitcoin starts a rally, its sustainability will be crucial. This determines whether Bitcoin can break through the current narrow consolidation range to gain more upward momentum.
Today’s Cryptocurrency Headline
BlackRock Adds Bitcoin to Its Global Allocation Fund Portfolio
Asset management giant BlackRock has added bitcoin to the portfolio of its BlackRock Global Allocation Fund, Trustnode reported. BlackRock said in a filing that the fund may invest in cash-settled bitcoin futures traded on commodity exchanges registered with the Commodity Futures Trading Commission. It was one of the first general funds to add bitcoin to its portfolio. It is reported that the BlackRock Global Allocation Fund invests in stocks, bonds and short-term securities of corporate and government issuers on a global scale, without prescribed restrictions.
Disclaimer: BingX does not endorse and is not responsible for or liable for any content, accuracy, quality, advertising, products, or other materials on this page. Readers should do their own research before taking any actions related to the company. BingX is not responsible, directly or indirectly, for any damage or loss caused or alleged to be caused by or in connection with the use of or reliance on any content, goods, or services mentioned in the article.

Farming for Bitcoin?BitFarms is a nice little company hidden in the space with very few employees. Could make a moonshot once CBDCs are forced unto the world. stayu tunes to find out.

BTC Detailed Top-Down Analysis - Day 122Hello TradingView Family / Fellow Traders. This is Richard Nasr, as known as theSignalyst.
122 out of 500 days done.
I truly appreciate your continuous support everyone!
Let me know if you like the series, and if you would like me to change or add anything.
Always follow your trading plan regarding entry, risk management, and trade management.
Good Luck!.
All Strategies Are Good; If Managed Properly!
~Rich

Jan 3 BTCUSD BingX Chart Analysis and Today's HeadlineBingX’s Bitcoin Chart
blog.bingx.com
Bitcoin rebounded after stepping back on the support of $16,000, but whether a bottom structure has been formed still needs further confirmation. If BTC continues to rally above the $18,000 resistance this week, the market’s optimism will rise further. We also need to watch the $16,000 support level. If BTC falls below this position, it means that Bitcoin's rebound has come to an end and the market will bottom out again.
Today’s Cryptocurrency Headline
Turkey to Use Blockchain-Based Digital Identities for Online Public Services
Citizens will be able to use blockchain-based digital identities to access e-wallet applications, Turkish Vice President Fuat Oktay announced during the Digital Turkey 2023 event. Among them, E-Devlet, Turkey's digital government portal for accessing various public services, will use blockchain-based digital identities to verify Turkish citizenship during login.
Disclaimer: BingX does not endorse and is not responsible for or liable for any content, accuracy, quality, advertising, products, or other materials on this page. Readers should do their own research before taking any actions related to the company. BingX is not responsible, directly or indirectly, for any damage or loss caused or alleged to be caused by or in connection with the use of or reliance on any content, goods, or services mentioned in the article.

LINK - Once A Castle; Always A Castle! 🏚Hello TradingView Family / Fellow Traders. This is Richard, as known as theSignalyst.
LINK has been stuck inside a big range in green between 5.0 and 10.0 and it is currently sitting around the lower bound (5.0) so we will be looking for buy setups.
For the bulls to take over, we need a break from a short-term perspective, we need a break above the last minor resistance in orange around 6.5.
And for the bulls to take over from a medium-term perspective and then a long-term perspective, we need a break above the upper orange zone and green zone respectively.
Meanwhile, until the bulls take over, LINK can still trade lower to test the 5.0 zone or even break it downward.
Always follow your trading plan regarding entry, risk management, and trade management.
Good luck!
All Strategies Are Good; If Managed Properly!
~Rich

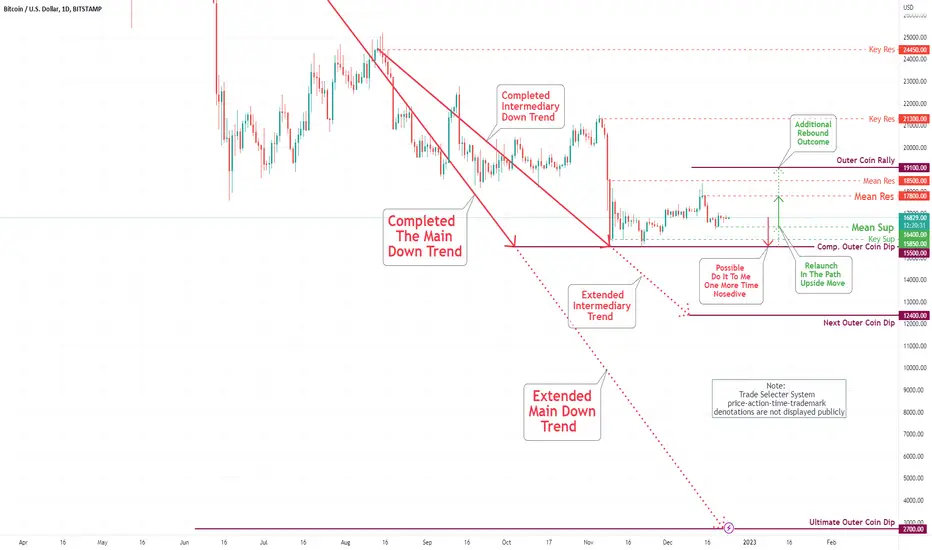
Bitcoin (BTC/USD) Daily Chart Analysis For Week of Dec 30, 2022Technical Analysis and Outlook:
Bitcoin decanted closer to our Mean Sup of $16,400 throughout the week. The retest of the Key Sup $15,850 is a high probability at this time. The upward movement to retest newly created Mean Res $17,000 extending to Mean Res $17,800, Mean Res $18,500 is pending on the hitting Key Sup $15,850. However, be aware there is the possibility that this puppy may break from the current position to create upward action as specified above.

December 30 BTCUSD BingX Chart Analysis and Today's HeadlineBingX’s Bitcoin Chart
Bitcoin is up 0.36% over the last 24 hours and rose to an intraday high of $16,660.00. The largest cryptocurrency continues to trade between $16,500 and its 20-day exponential moving average (EMA) of $16,822, suggesting investors are still not active. If the price turns down and slips below $16,500, the selling could pick up pace and the BTC/USDT pair could fall to the $16,000 to $15,476 support zone.
Today’s Cryptocurrency Headline
Alameda Research Liquidates Ethereum-Based Token
On-chain data cited by crypto research firm Arkham Intelligence suggested $1.7 million worth of tokens from Alameda-linked wallets were sold in the open market over several hours on Wednesday. Multiple tokens including USDC, DAI, CRV, ETH, and CVX were merged from several wallets into two wallets and then sold for USDT. The holdings were then converted into bitcoin (BTC) using swapping services like FixedFloat and ChangeNow. According to Arkham Intelligence data, Alameda still holds over $112 million worth of various cryptocurrencies, down from $140 million held in mid-November.
Disclaimer: BingX does not endorse and is not responsible for or liable for any content, accuracy, quality, advertising, products, or other materials on this page. Readers should do their own research before taking any actions related to the company. BingX is not responsible, directly or indirectly, for any damage or loss caused or alleged to be caused by or in connection with the use of or reliance on any content, goods, or services mentioned in the article.

#btcstarburst Things are Looking Interesting?I don’t know THings are looking awfully interesting rights about now? End of year… I have been saying there could be a massive cup and handle forming into 2023 if a bottom single is forming? Even if we do strike a little lower we are splitting hairs at this point DCA safely DYOR… Trying to time the market is everything at this point… could we go to 10k, that s a hard sell… Side not Dfinitity (ICP) seems like it may be the big winner next bull run interesting enough this is a Gann study… Dcap a real state tokenization platform and others tokenization platforms/company’s will have 16 trillion dumped into them by 2030 DYOR…

Bitcoin - More short positionsBitcoin is in a critical situation, as it has been in recent months. This cannot guarantee a bearish trend in the medium to long term, but this is the most likely scenario.
Monthly chart: On a quantitative level, we can observe that on the monthly chart, the price is entering below the 70 simple moving average (the 210 is not yet developed), with an RSI of 40.
Weekly chart: On the weekly chart, the price is below the 210, 70, and 14 SMA, with an RSI of around 33, very low.
There is probably no trend-following system that gives a buy order on tokenised assets currently, given that the blockchain market is in a bearish phase.
One of the, at least, optimistic concepts of this scenario is that the weight of the trend that started in June of this year 2022 has a lot of strength, and therefore, if the channel is broken to the upside, there may be a lot of institutional and retail volume in the asset.
For now, we have short Sell Stop positions in place, as well as active futures positions and, for now, we are not placing bullish Buy Stop positions.
Obviously, whether the asset breaks to the upside or the downside, we will be in, although the most likely scenario is a bearish trend and the risk/reward ratios should be freer on these positions.

December 28 BTCUSD BingX Chart Analysis and Today's HeadlineBingX’s Bitcoin Chart
According to CryptoQuant, more than $19 billion in BTC, ETH, stablecoins left crypto exchanges since November 5, 2022. Bitcoin is down 1.22% over the last 24 hours and fell to an intraday low of $16,589.28. The cryptocurrency market has experienced record-low volatility as investors have largely stayed away during the holiday season. The price of Bitcoin has been fluctuating in a tiny range for the past few days, suggesting traders are not clear about the next directional move. The BTC/USDT is likely to stay in the $16,000-$17,000 price zone for the next few days.
Today’s Cryptocurrency Headline
Crypto Investment Firm Midas Shuts Down Platform
Iakov "Trevor" Levin, CEO and founder of Midas Investments, an investment company focused on DeFi yields, issued an announcement stating that the company decided to close its platform after suffering significant losses in 2022. Last spring, the Midas DeFi portfolio lost $50 million, or 20% of its $250 million in assets under management (AUM), and after the collapse of Celsius and FTX, its platform experienced over 60% of AUM being withdrawn.
Disclaimer: BingX does not endorse and is not responsible for or liable for any content, accuracy, quality, advertising, products, or other materials on this page. Readers should do their own research before taking any actions related to the company. BingX is not responsible, directly or indirectly, for any damage or loss caused or alleged to be caused by or in connection with the use of or reliance on any content, goods, or services mentioned in the article.

December 27 BTCUSD BingX Chart Analysis and Today's HeadlineBased on Bitcoin's recent behavior, it is still trading below the $17,000 resistance level, which it has been unable to break effectively. The quick recovery from last night's slight drop in Bitcoin is a sign of jittery market sentiment. If bitcoin does not break through resistance in the near term, it will continue to oscillate between $16,500 and $16,880.
Today’s Cryptocurrency Headline
Fidelity Filed Three Metaverse Related Trademark Applications
Fidelity has filed three metaverse related trademark applications with The U.S. Patent and Trademark Office (USPTO), covering NFT and NFT markets, virtual real estate investments, crypto trading, and metaverse investment services, according to The Block. Fidelity has embraced digital assets more than most large investment firms. In October, Fidelity said it planned to hire 100 more people in cryptocurrencies, expanding its digital assets team to 500. The company also launched commission-free retail crypto trading accounts in November.
Disclaimer: BingX does not endorse and is not responsible for or liable for any content, accuracy, quality, advertising, products, or other materials on this page. Readers should do their own research before taking any actions related to the company. BingX is not responsible, directly or indirectly, for any damage or loss caused or alleged to be caused by or in connection with the use of or reliance on any content, goods, or services mentioned in the article.

Going to Start another RIOT?Looks like this will be 50% cheaper shortly. Buckley up boys get ready for the recession.

BTC Detailed Top-Down Analysis - Day 120Hello TradingView Family / Fellow Traders. This is Richard Nasr, as known as theSignalyst.
120 out of 500 days done.
I truly appreciate your continuous support everyone!
Let me know if you like the series, and if you would like me to change or add anything.
Always follow your trading plan regarding entry, risk management, and trade management.
Good Luck!.
All Strategies Are Good; If Managed Properly!
~Rich

December 26 BTCUSD BingX Chart Analysis and Today's HeadlineBingX’s Bitcoin Chart
Bitcoin has been on a downward trend since it fell from $69,000 to the present without a decent rally. Bitcoin is currently in a low volatility range for a long time, and has yet to see a major upward or downward trend. If BTC can pull back $18, 500, then there is a reasonable chance that the decline will be reversed and a choppy climb will follow. However, there is not enough liquidity in the market for the Christmas holiday, so the cryptocurrency is still down.
Today’s Cryptocurrency Headline
Bitcoin Mining Companies Have Racked Up $4 Billion in Debt This Year
Bitcoin mining companies have been struggling under the weight of a year-long bear market, with collective debt expected to surpass $4 billion by the end of 2022, according to a report from Hashrate Index. The worst case is Core Scientific, which owes $1.3 billion to creditors and has filed for Chapter 11 bankruptcy. Marathon Digital owes about $851 million, but most of it is convertible notes, meaning its creditors can exchange them for stock in the company.
Disclaimer: BingX does not endorse and is not responsible for or liable for any content, accuracy, quality, advertising, products, or other materials on this page. Readers should do their own research before taking any actions related to the company. BingX is not responsible, directly or indirectly, for any damage or loss caused or alleged to be caused by or in connection with the use of or reliance on any content, goods, or services mentioned in the article.

Merry Christmas BitcoinThis has been my main focus this December, and it will continue being till Tuesday when we can expect more Data release to Support or Suppress Inflation for the next year.
We’re sticking to our strategy; till we see otherwise.
Holding Short long term. Projections towards 9k-7k
Ps. Hashrate had some influence today for sure, not really sure how The FED will play it on their plans for the Slow Growth Economy plan.
Merry Christmas!!
Cheers,

Is it possible that XEM like Bitcoin decides to be a butterfly?butterfly harmonic pattern:
AB=0.78 XA
BC=0.88 AB
CD=1.6 BC
or
CD=2.24 BC

Bitcoin (BTC/USD) Daily Chart Analysis For Week of Dec 23, 2022Technical Analysis and Outlook:
Bitcoin stays put above our Mean Sup of $16,400. The upward movement is in the process to Mean Res $17,800, extending to Mean Res $18,500 with high degree aftermath. The retest of the Key Sup $15,850 is continuously low at this time, pending the above scenario being played out.
December 23 BTCUSD BingX Chart Analysis and Today's HeadlineBingX’s Bitcoin Chart
Bitcoin price is almost flat over the last 24 hours. The largest cryptocurrency has been trading below the 20-day exponential moving average ($16,985) since Dec. 16, which has become a crucial resistance level. A breakout from here will potentially initiate an uptrend in the short term. The flattish 20-day EMA and the relative strength index (RSI) near 46 do not give a clear advantage either to the bulls or the bears. The BTC/USDT pair is likely to stay in the $16,000-$17,000 price zone until the holiday season is over.
Today’s Cryptocurrency Headline
Brazilian President Signs Off on National Crypto Rules
Brazil President Jair Bolsonaro on Thursday approved a crypto regulation bill recently passed by that country’s Chamber of Deputies and the Senate. The new law establishes a crime of fraud involving virtual assets, with a penalty of between four and six years in jail plus a fine. It also creates a “virtual service provider” license, which is to be requested by digital asset companies, including exchanges and trading intermediaries.
Digital assets that are considered securities will be regulated by the Brazilian Securities and Exchange Commission (CVM), while assets that do not fall into this category will be regulated by another yet-to-be-established agency. Companies will have 180 days to adapt to the new rules.
Disclaimer: BingX does not endorse and is not responsible for or liable for any content, accuracy, quality, advertising, products, or other materials on this page. Readers should do their own research before taking any actions related to the company. BingX is not responsible, directly or indirectly, for any damage or loss caused or alleged to be caused by or in connection with the use of or reliance on any content, goods, or services mentioned in the article.

Entering long in Sugar futures We have entered long in Sugar futures.
This position is not validated with all the patterns of our TTW system, so the percentage of liquidity assigned to the series of positions is very low.
Using our algorithmic trend-following system, Sugar futures are at 3-year highs, with an RSI of 63.57 on the weekly chart, and 65.64 on the monthly chart. The asset has broken one horizontal resistance and is above the 210, 70 and 14 SMAs, with a crossover between the 14 and 70 SMAs.
We have targets around 24 in the coming months, but there is a high probability of a pullback.
In the event of a pullback, we could re-enter.
Position :
Entry: Market price
Guaranteed trailing stop loss: 0.4% of the portfolio.
Target: 24-25.
Financial Engineering: Futures (without OTC derivatives)
