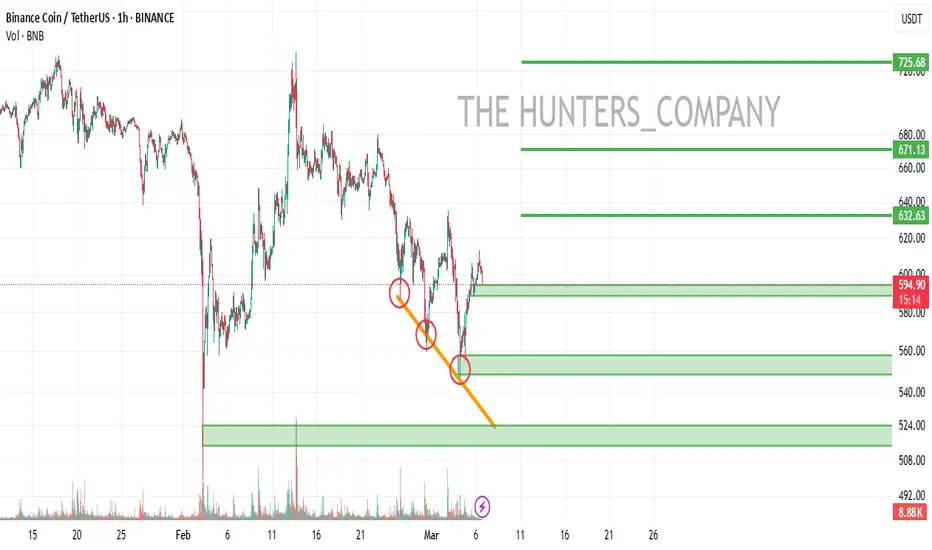
BNB Channel and Areas of SupportBNB 3 day chart-
Current PA is still trading within the channel, though not ideally positioned as we approach its lower boundary. I anticipate the wick from February 3 will be filled, which aligns with our initial support zone. Should that support fail, I expect the wick from August 4 to also be filled, indicating the next support level.
These areas can provide short-term bounces or reversals.
Thanks for your time. Chat soon!
BNBUSDT

BNB/USDT UPDAEHello friends
With the price drop, we now see that the sellers are gradually failing and the buyers have succeeded in supporting the price.
Now we can buy in stages and with capital management and move towards the specified goals.
*Trade safely with us*
bnb sell midterm"🌟 Welcome to Golden Candle! 🌟
We're a team of 📈 passionate traders 📉 who love sharing our 🔍 technical analysis insights 🔎 with the TradingView community. 🌎
Our goal is to provide 💡 valuable perspectives 💡 on market trends and patterns, but 🚫 please note that our analyses are not intended as buy or sell recommendations. 🚫
Instead, they reflect our own 💭 personal attitudes and thoughts. 💭
Follow along and 📚 learn 📚 from our analyses! 📊💡"

BNB Ready for a Breakout? Cup & Handle Pattern in Play!#BNB is in a strong uptrend and is currently forming a cup and handle pattern on the 30-minute timeframe. This is a classic bullish continuation pattern, signaling a potential breakout.
Key Observations:
🔹 Higher Highs (HH) & Higher Lows (HL) indicate a healthy uptrend.
🔹 Bearish divergence spotted—indicating a possible retracement.
🔹 If support breaks, we may see a trend reversal.
🔹 If the handle completes and #BNB breaks out, it could be an ideal buying opportunity.
Strategy:
🔹 Wait for breakout confirmation above the cup resistance.
🔹 Entry: On breakout with volume.
🔹 Stop Loss: Below recent HL.
🔹 Target: Measure the depth of the cup for a price target.
Final Thoughts:
This setup has high potential, but always use proper risk management.
What’s your take on #BNB? Will it break out or break down? Comment below!

Binance Coin (BNB) Market AnalysisRecent Price Action & Breakdown
BNB lost the key $600 support level due to strong selling pressure, dropping 12% over the past week, aligning with the broader market downturn.
The break below $600 signals increased bearish momentum, but BNB has yet to form a lower low, indicating relative strength compared to most altcoins.
Key Support Levels to Watch
If the decline continues, buyers may step in between $550 and $500, with $500 being a historically strong support zone.
Holding above $500 is crucial, as a sustained drop below this level could lead to further downside pressure.
Potential Recovery Scenario
If $500 holds, there remains potential for a recovery, especially if the overall crypto market stabilizes.
A move back above $600 would be a bullish signal, confirming a potential rebound and resumption of BNB’s upward trend.
Conclusion
BNB is at a critical juncture. The $500 support level must hold to avoid a deeper correction.
Despite the drop, BNB shows relative strength compared to most altcoins.
Traders should watch for buying activity around the $500-$550 range, as this could indicate a recovery in the near term.

BNB/USDT weekly chart indicates a few key points for analysis:As of the latest update, BNB is trading around $614.87.
Strong resistance is visible around $663.27.
Key support levels are highlighted around $478.30 and $205.25.
The chart shows a potential cup-and-handle formation, suggesting a bullish outlook if the price breaks above the resistance level.
Recent price action indicates a potential consolidation period, with movement occurring between established support and resistance.
For a more detailed analysis, consider factors such as trading volume, market news, and overall trends in the cryptocurrency market. Always exercise caution and do further research before making any trading decisions.
If you found this analysis helpful, hit the Like button and share your thoughts or questions in the comments below. Your feedback matters!
Thanks for your support!
DYOR. NFA

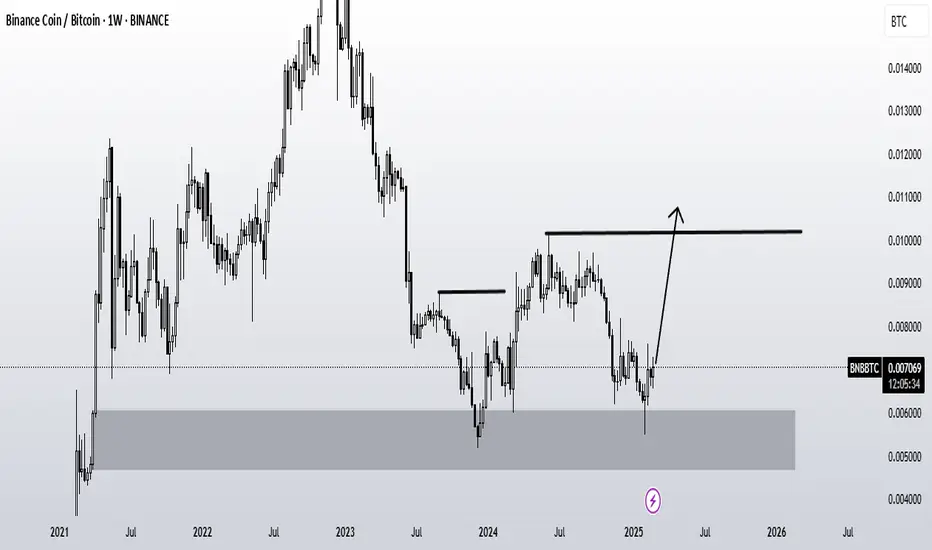
BNB/BTC : BNB Ready to Outperform Bitcoin?"Analyzing the BNBBTC weekly timeframe and the current market structure, I anticipate that BNB will outperform Bitcoin by a factor of two. In other words, if Bitcoin rallies 50%, we could see BNB doubling in value. Do you think BNB is positioned to reach $1,000?"
BNB New Update (1W)If you have been following our BNB analyses, you would know that we previously identified its pattern as a triangle.
The price reacted to the green zones from our previous analysis, but based on the weekly candles, it seems that wave E will be deeper.
We are looking for buy opportunities within the green zone, with a minimum target of $800.
This is our current outlook on BNB.
For risk management, please don't forget stop loss and capital management
Comment if you have any questions
Thank You

bnb buy midterm"🌟 Welcome to Golden Candle! 🌟
We're a team of 📈 passionate traders 📉 who love sharing our 🔍 technical analysis insights 🔎 with the TradingView community. 🌎
Our goal is to provide 💡 valuable perspectives 💡 on market trends and patterns, but 🚫 please note that our analyses are not intended as buy or sell recommendations. 🚫
Instead, they reflect our own 💭 personal attitudes and thoughts. 💭
Follow along and 📚 learn 📚 from our analyses! 📊💡"

BNB Ready for a Major Breakout? Head & Shoulders Pattern in PlayMarket Insight:
#BNB is currently trading in a prime buying zone for spot traders, showing strong price action on the 4-hour timeframe. A Head and Shoulders (H&S) pattern is forming, and we are closely monitoring its breakout for a potential bullish move.
🔹 Bearish Signs? None so far! The market structure remains intact, and buyers seem to be in control.
Trade Plan for Bulls:
🔹 Breakout Confirmation: A clean break above the neckline of the H&S pattern will confirm bullish momentum.
🔹 Entry Zone: After confirmation, a long position can be initiated with proper risk management.
🔹 Stop Loss & Risk Management: Place a stop-loss below the right shoulder to manage risk effectively.
🔹 Potential Target: If the breakout holds, we could see a strong upward move toward key resistance levels.
🔹 Chart Analysis: (Attach a well-annotated chart with clear trendlines, breakout zones, and risk-reward levels)
🔹 What’s Your Take?
Do you think #BNB will break out or face rejection? Drop your thoughts in the comments!
Like & Follow for more real-time trade setups!

BNB at a Crossroads: Can It Hold Above $600?BNB has been making headlines with rising trading volumes and growing ecosystem interest, particularly around meme coins like TST. But while attention is increasing, BNB’s price has slipped over 3% this week, showing that hype alone isn’t enough to sustain momentum.
Technical Indicators Signal Uncertainty
BNB’s Directional Movement Index (DMI) paints a picture of indecision:
📊 ADX at 14 – Trend strength remains weak after fluctuating between 11.1 and 16 in recent hours.
📉 +DI (Buyers) at 22.5 – Briefly surged but lost steam after peaking at 30.3 earlier.
📈 -DI (Sellers) at 23.5 – Gaining momentum, up from 14.2 yesterday.
Meanwhile, the EMA lines are tightening, signaling consolidation rather than a decisive uptrend or downtrend. The Ichimoku Cloud also leans bearish, suggesting BNB is at a critical moment.
What’s Next for BNB?
📌 Bullish Scenario – If BNB holds its ground, it could regain momentum and retest key resistance levels.
📌 Bearish Scenario – If selling pressure continues, BNB risks falling below $600 in the short term.
Despite its ecosystem growth and increased trading volume, the market’s hesitation shows that investors are waiting for a clear direction. Will BNB bounce back or break down?

BNBUSDT Triangle PatternThe BNBUSDT H4 chart shows a triangle pattern forming. I believe the price will make new higher highs, but trading is still not recommended during this period.

AUCTIONUSDT UPDATE
AUCTIONUSDT is a cryptocurrency trading at $14.18. Its target price is $26.00, indicating a potential 100%+ gain. The pattern is a Bullish Falling Wedge, a reversal pattern signaling a trend change. This pattern suggests the downward trend may be ending. A breakout from the wedge could lead to a strong upward move. The Bullish Falling Wedge is a positive signal, indicating a potential price surge. Investors are optimistic about AUCTIONUSDT's future performance. The current price may be a buying opportunity. Reaching the target price would result in significant returns. AUCTIONUSDT is poised for a potential breakout and substantial gains

BNB (SHORT+LONG TERM) Outlook After a good reaction from a Fib-Golden Zone from Daily Chart.
+MSS is done on Internal structure on 1hr, it hopfelly will go +MSS on 4HRs.
Then, based on Fib, will reach 1,000$ with the support of Fundamentals of Alt coin Season, and maybe exceeding 1,000 to 1,400 - 1,500 $.
Best of luck and you feedback is important.


bnb sell midterm"🌟 Welcome to Golden Candle! 🌟
We're a team of 📈 passionate traders 📉 who love sharing our 🔍 technical analysis insights 🔎 with the TradingView community. 🌎
Our goal is to provide 💡 valuable perspectives 💡 on market trends and patterns, but 🚫 please note that our analyses are not intended as buy or sell recommendations. 🚫
Instead, they reflect our own 💭 personal attitudes and thoughts. 💭
Follow along and 📚 learn 📚 from our analyses! 📊💡"

BNBUSDT - Another Moonshot UpA channel can be drawn between the bottoms and the peak showing a potential top with a comparable %increase to the first massive run
Another run like this would put BNB at 13K
I think BNB coin is at the early stages of its evolution which allows massive moves like this
Very bullish on this one
Monthly chart

BNB’s Correction Could Trigger a Major Move—Are You Ready ?Yello Paradisers! Have you been keeping an eye on #BNBUSDT? If not, now’s the time to focus. BNB is currently in a corrective phase after its recent surge, and this pullback could be setting up a major opportunity for those who know when to strike. But timing is everything, and jumping in too early could be a costly mistake.
💎Right now, we expect BNB to follow a flat zigzag correction pattern of Elliott Wave. The price action shows signs of an imbalance (IMB) and a change of character (CHOCH), suggesting that we might see a further dip before the bulls take over again. You can switch to lower timeframes, like the 15-minute chart, to get a clearer validation of the wave structure. The key here is to wait for a bullish divergence on the RSI and MACD, which will signal that the correction is nearing its end and a rebound is likely.
💎The bullish order block (OB) between $582 -$577 is the crucial demand zone to watch. We anticipate BNB dipping into this zone before finding strong support for a potential upward impulsive wave. However, if BNB closes below this order block, the setup becomes invalid, and we could see further downside toward $560. It’s essential to remain patient and disciplined rushing in without confirmation could lead to unnecessary losses.
💎Once we get the bullish divergence, we expect BNB to target the $643-$646 supply zone in the next move. This could be a sharp and profitable rally for those who wait for the right signals. But remember, if the price closes below the bullish OB, it’s time to step back and reassess. Protecting your capital is just as important as making profits.
Be patient, stay focused, and let the market come to you. That’s how you secure long-term success in this game.
MyCryptoParadise
iFeel the success🌴

BNB ANALYSIS ( UPDATE ) 📊 #BNB Analysis : Update
✅As we said earlier, #BNB performed same. Now we can see that #BNB is trading around a major support area and following a trendline. We could expect around 10% bullish move if it sustain its major support area
👀Current Price: $673
🚀 Target Price: $745
⚡️What to do ?
👀Keep an eye on #BNB price action and volume. We can trade according to the chart and make some profits⚡️⚡️
#BNB #Cryptocurrency #TechnicalAnalysis #DYOR

$BNB LONG SETUP | Binance Coin Price Predictions for This Week Binance Coin (BNB) Price Predictions for This Week
Key Support levels: $600
Key Resistance levels: $701. Massive Bounce off Key Support
After BNB touch $500 for a brief moment in early February, the price shot up to $700 in less than 10 days. This reversal was abrupt and significant, confirming that the support at $600 is well defended by buyers. At the time of this post, BNB is under the key resistance at $700.2. Sellers are Defending the $700 Resistance
As soon as the price moved above $700, sellers came in strong to push the price under this key level. After an impressive performance, BNB could not break this level which continues to act as a key resistance at the time of this post. Nevertheless, buyers could attempt another breakout later.3. Sustained Buy Volume Meets Sellers
Prior to BNB reaching $700, the buy volume was sustained and increased gradually. However, as soon as the price moved above $700 sellers dominated with the highest daily volume recorded so far in 2025. This has put a pause to the rally, and for it to continue, buyers need to turn $700 into a key support.
🔥 Market Analytics Info ( CRYPTOCAP:BNB )
Fully Diluted Market Cap: $94.2B
Volume 24 hour: $2.25 B
Total Supply: 142.48 B BNB
Circulating Supply: 142.48 B BNB
Market Cap: $94.02 B
All Time High: $793.35
All Time Low: $0.0961
Already have 90 Day Returns 2.84%
Now 7 Day Returns 13.99%
🔥Chart Analysis ( CRYPTOCAP:BNB )
💫2025 ATH : $793.35
🎆ENTRY POINT : $613.63, $588.50, $564.54
🎇STOPLOSS ZONE : $502.87
1ST TARGET $684.43
2ND TARGET $745.47
3RD TARGET $792.78
ATH 4TH TARGET $877.85
Disclaimer: This article is for informational purposes only and does not constitute financial advice. Always conduct your own research before making any investment decisions. Digital asset prices are subject to high market risk and price volatility. The value of your investment may go down or up, and you may not get back the amount invested. You are solely responsible for your investment decisions and Binance is not available for any losses you may incur. Past performance is not a reliable predictor of future performance. You should only invest in products you are familiar with and where you understand the risks. You should carefully consider your investment experience, financial situation, investment objectives and risk tolerance and consult an independent financial adviser prior to making any investment.

Can BNB reach around $1000 ?...Currently, BNB is forming an ascending triangle, indicating a potential price increase. It is anticipated that the price could rise, aligning with the projected price movement (AB=CD).
However, it is crucial to wait for the triangle to break before taking any action.
Give me some energy !!
✨We spend hours finding potential opportunities and writing useful ideas, we would be happy if you support us.
Best regards CobraVanguard.💚
_ _ _ _ __ _ _ _ _ _ _ _ _ _ _ _ _ _ _ _ _ _ _ _ _ _ _ _ _ _ _ _
✅Thank you, and for more ideas, hit ❤️Like❤️ and 🌟Follow🌟!
⚠️Things can change...
The markets are always changing and even with all these signals, the market changes tend to be strong and fast!!

BNB - will there be enough time for further growth in this cycleHello everyone, I invite you to review the current situation on BNB. When we enter the one-month interval, we can see how the price, after a long period of bearishness, turned into an upward trend in which it came out on top of the long-term downward trend line. Currently, we can see the movement along the upward trend line, which is also a support line for declines.
Here we can see how the price is currently based on support at $ 670, however, if this support is broken, we can then see the price quickly descending again to the area of a strong support zone from $ 540 to $ 460.
Looking the other way, we can see that when the trend reverses, we first have a resistance zone from $ 744 to $ 810, only when we come out on top of this zone can we see further movement towards $ 893, which may open the way towards another strong resistance in the area of $ 1134.
The RSI indicator shows that we are staying above the upper limit, which could potentially indicate an approaching larger rebound, but before that we may still see an attempt at growth so that the indicator reaches its previous highs.

BNB Price Analysis: Can Binance Coin Hit $750 Next?The last two quarters have been fruitful for native exchanges' coins.
After WhiteBIT's WBT updated its ATH several times, now Binance Coin (BNB) is surging, reclaiming $700 with an 11% intraday jump and trading at $708.10. With daily trading volume up 88%, bullish momentum is building, making BNB a key contender in this month’s altcoin market rally.
BNB Market Overview:
📈 +11.17% in 24 hours – Trading volume at $3.71B (+87.43%)
📈 +21.47% in a week – Bullish trend intensifies
📈 Market Cap: $99.55B – 5th largest crypto, 3.14% market dominance
Technical Indicators Favor Bulls:
- RSI Surges Toward Overbought Levels – Strong bullish momentum.
- EMA 50/200 Shows Positive Crossover – Confirming trend continuation.
Key Price Levels to Watch:
🔼 Immediate Resistance: $720 – A break here could send BNB toward $750.
🔽 Key Support: $635 – A breakdown could lead to $600.
With market sentiment bullish, BNB could test $750 this month if the trend holds. However, a trend reversal could see a pullback to $635 or $600.

BNB ANALYSThe analysis is on daily time frame and will give you a long term view
If these analyses help you to make better profits then share this analysis with your friends
And post your questions below this analysis
