$NASDAQ:LCID Monitoring for a 168% breakoutWatching Lucid for a breakout from its falling wedge pattern. This may retest the support at ~$3.20 before breaking out.
Entry: ~3.30
Confirmation: A spike in volume and a good % uptick in the price.
Stop loss: 200 day moving average (~$2.92)
Price Target: 8.84
Breakouttrading

Moodeng/USDT Breaks Resistance: Major Rally Ahead?Moodeng/USDT has successfully broken above the descending resistance line and is moving upward, supported by the rising trendline.
If the price breaks above the marked resistance zone and secures a proper closing, it could trigger a significant upward move.

Amazing breakout on Weekly Timeframe - ORBTEXPCheckout an amazing breakout happened in the stock in Weekly timeframe, macroscopically seen in Daily timeframe. Having a great favor that the stock might be bullish expecting a staggering returns of minimum 25% TGT. IMPORTANT BREAKOUT LEVELS ARE ALWAYS RESPECTED!
NOTE for learners: Place the breakout levels as per the chart shared and track it yourself to get amazed!!
#No complicated chart patterns
#No big big indicators
#No Excel sheet or number magics
TRADE IDEA: WAIT FOR THE STOCK TO BREAKOUT IN LOWER TIMEFRAME AND RETRACE IF NEEDED. SL IS NEARER SUPPORT ZONE IN Daily TIMEFRAME.
Checkout an amazing breakout happened in the stock in Weekly timeframe.
Breakouts happening in longer timeframe is way more powerful than the breakouts seen in Daily timeframe. You can blindly invest once the weekly candle closes above the breakout line and stay invested forever. Also these stocks breakouts are lifelong predictions, it means technically these breakouts happen giving more returns in the longer runs. Hence, even when the scrip makes a loss of 10% / 20% / 30% / 50%, the stock will regain and turn around. Once they again enter the same breakout level, they will flyyyyyyyyyyyy like a ROCKET if held in the portfolio in the longer run.
Time makes money, GREEDY & EGO will not make money.
Also, magically these breakouts tend to prove that the companies turn around and fundamentally becoming strong. Also the magic happens when more diversification is done in various sectors under various scripts with equal money invested in each N500 scripts.
The real deal is when to purchase and where to purchase the stock. That is where Breakout study comes into play.
LET'S PUMP IN SOME MONEY AND REVOLUTIONIZE THE NATION'S ECONOMY!

GOLDEN Breakout setup on Nifty 50 for (30-12-24)Nifty 50 index was going sideways for 3 days, today it gave bull breakout but not sustained properly. So next trading day can become significantly important if you do breakout trades!
ANALYSIS :
On chart you can see I am using my custom build indicator named Golden Trading System (GTS) it shows two significant support and resistance zones which works like magic! as of now it is not published but you can follow us to get notified when we publish this.
How you can use it ?
Alternatively you can use standard pivot point and change the pivot type to camarilla. Here we will only use H3-H4 and L3-L4.
In the chart you can see I already marked the H3-H4 and L3-L4 for tomorrow (30-12-24) so you can use that instead.
How to TRADE ?
Tomorrow (30-12-24) three thing can happen :-
(i) If market gave breakout the green band (H3-H4) we can look Long setup.
(ii) If market gave breakout the red band (L3-L4) we can look Short setup.
(iii) Market can go sideways / range bound between green band and red band.
CAUTION :-
While taking bullish trades we should not neglect the red resistance line and also While taking bearish trades we should not neglect the red support line because form those points market can reverse so trade cautiously and with "Stop Loss".

Will GBP/JPY Break the 200.000 Level? A Bullish OutlookThe pair GBP/JPY trading near the key horizontal resistance zone around 200.000. A breakout and sustained move above this level could signal a continuation of the bullish trend, targeting higher levels.
The ascending trendline below serves as strong dynamic support, indicating buyers' interest. Invalidations occur if the price closes below the trendline.
DYOR, NFA

Xrp - The First Of Two Massive Breakouts!Xrp ( BITSTAMP:XRPUSD ) is still creating bullish structure:
Click chart above to see the detailed analysis👆🏻
Despite the overall crypto market weakness Xrp is still holding and even rejecting the lower support trendline of the symmetrical triangle pattern. Xrp also created another short term triangle within the long term triangle, so two major breakouts might happen pretty soon.
Levels to watch: $0.6, $1.0
Keep your long term vision,
Philip (BasicTrading)

The Impact of KULR's Investment & Israel's Bitcoin Mutual FundsThe cryptocurrency market, particularly Bitcoin ( CRYPTOCAP:BTC ), has seen significant movements recently, influenced by both institutional buying and regulatory developments. Two key events stand out: KULR Technology Group's substantial investment in Bitcoin and the upcoming launch of Bitcoin mutual funds in Israel.
Technical Analysis:
Bitcoin experienced a notable "spiral movement," reaching a peak of $99,000 before a sharp 4% dip, settling at around $95,481.85. This volatility can be attributed to immediate market reactions to news like KULR's purchase of 217.18 BTC for about $21 million. The Relative Strength Index (RSI) at 44 indicates a potentially weak growth pattern, suggesting that Bitcoin might be overbought in the short term, prompting traders to be cautious.
The 24-hour trading volume of over $46 billion points to significant interest, yet the downward trend in price despite high volume might signal profit-taking or a shift in market sentiment. This could be interpreted as a consolidation period following a rapid ascent, with investors possibly waiting for more clarity or another catalyst.
The current trend for Bitcoin appears weak, as observed from the RSI and the market's reaction to new institutional investments. This might suggest a period of stabilization or correction is on the horizon before the next potential bull run.
Institutional Adoption
KULR Technology's decision to allocate up to 90% of its surplus cash into Bitcoin, following in the footsteps of giants like MicroStrategy, underscores a growing trend of corporate treasuries diversifying into cryptocurrencies. This move not only legitimizes Bitcoin as an asset class but also potentially influences its price through increased demand.
Regulatory Developments in Israel
The introduction of six Bitcoin mutual funds in Israel, set to launch on December 31, 2024, is a pivotal moment for crypto investments in the region. This development aligns with global trends where regulatory clarity often leads to increased institutional investment. The funds, managed by well-known firms, will offer investors a regulated, less volatile way to gain exposure to Bitcoin, potentially driving further adoption and demand.
The U.S. SEC's approval of spot Bitcoin ETFs earlier in the year has set a precedent, showing that with regulatory support, Bitcoin can attract significant institutional capital. Israel's move might follow this path, enhancing the perception of Bitcoin as a legitimate investment asset, not just a speculative one.
Economic Implications
By allowing transactions in shekels, these funds bridge the gap between traditional and digital finance, making Bitcoin more accessible to the average investor. This could lead to broader economic implications, including increased liquidity for Bitcoin and possibly influencing the digital shekel's development.
Conclusion:
The combination of KULR's bold investment strategy and Israel's innovative approach to Bitcoin through mutual funds paints a picture of a maturing market. Technically, Bitcoin might be facing short-term headwinds, but fundamentally, these developments suggest a robust future. Investors should watch for how these factors play out in terms of price stability, regulatory responses, and further institutional involvement. The narrative around Bitcoin continues to evolve from a digital currency to a recognized financial instrument in both corporate and national strategies.

POND/USDT: Small Waves , Big Ripples, Targeting 20%,60%,100%+To examine POND/USDT for both immediate and long-term prospects:
Key Findings from the Chart: Signal for Trend Reversal:
A possible upward advance is indicated by the most recent green "Buy" indicator.
Because the price is above short-term EMAs, bullish momentum is supported.
Encouragement and Opposition:
Support: The yellow line, or 0.01730, is a strong support.
0.01671 is secondary support.
Resistance: 0.0260 is the immediate resistance.
notable resistance at historical values of 0.03019 and 0.03490.
Momentum & MACD:
Bullish momentum is shown by the increasing green bars on the MACD histogram.
MACD line crossovers are conducive to continuation.
Objectives:
Short-Term Objective:
20 percent first TP: 0.0275.
Entry between current levels of 0.0225 and 0.0230.
Stop Loss (SL): Below the current support level of 0.0170.
Mid-Term Goal:
60 percent second TP: 0.0340.
Long-Term Goal:
100 percent third TP: 0.0420.
In the long run, we can expect significant gains of 150%–200% if the price breaks over 0.0420.
Approach:
Short-term traders should tighten their stop loss at 0.0200 and buy close to 0.0225 with a goal of 0.0275.
Mid-Term Investors: Build up on declines around 0.0173-0.0180 in order to reach 0.034.
Long-Term Holders: For higher returns, wait for a possible breakout over 0.0420.
Risks: Bearish emotion could resurface and render the setup useless if the price drops below 0.0167.

FTT Breaks Out: Bullish Trend Targets 4.00+ FTT has broken out of a symmetrical triangle and is consolidating above a key support zone.
The ascending trendline supports the bullish structure, with potential upside toward $4.00+.
The bullish trend remains intact as long as the price holds the trendline.

TSM LOOKING BULLISH|READ NOTES|24DEC 2024TSM is looking bullish to breakout but if it does not then $180 is very much a possibility. In nutshell Iam just explaining you what I am getting into. Always know the risk.
I am expecting a green candle in TSM so i am long here

Is trying and is going to make itPrice has tried many tome to break that resistance. Eventually is going to make it. Also looks liken an inverse HS. I opened a long position. Is a very volatile stock so hang tight. SL triggers is a daily candle closes at the level shown. But it has to close.

Can DXYZ Reach $199? Here’s How!Good morning, trading family!
DXYZ is at an important point, and here’s what could happen:
-If the price breaks above $62.74: We’re looking at a first target of $127, with the potential to climb to $199 or higher.
-If the price falls below $56.12: We could see a drop to levels between $43-$46.
This is a setup worth watching. Let’s stay sharp and trade smart!
Wellness Tips of the Day:
Eat brain-boosting snacks: Reach for a handful of nuts, some fresh fruit, or a piece of dark chocolate to keep your energy and focus steady throughout the day.
Comment, like, follow, or send me a message if you want more details on this analysis!
Kris/Mindbloome Exchange
Trade What You See

$NYSE:RDW Attempting to breakout of Bullish FlagNYSE:RDW appears to be preparing to break out of a bullish flag.
Buy-in: I'm setting my buys to be when the stock closes above $13.79
Price target: ~$21.50
Confirmation: Relatively higher volume (~1M shares for the day)
Good luck!

Amazing breakout on Weekly Timeframe - PAYTMCheckout an amazing breakout happened in the stock in Weekly timeframe, macroscopically seen in Daily timeframe. Having a great favor that the stock might be bullish expecting a staggering returns of minimum 25% TGT. IMPORTANT BREAKOUT LEVELS ARE ALWAYS RESPECTED!
NOTE for learners: Place the breakout levels as per the chart shared and track it yourself to get amazed!!
#No complicated chart patterns
#No big big indicators
#No Excel sheet or number magics
TRADE IDEA: WAIT FOR THE STOCK TO BREAKOUT IN LOWER TIMEFRAME AND RETRACE IF NEEDED. SL IS NEARER SUPPORT ZONE IN Daily TIMEFRAME.
Checkout an amazing breakout happened in the stock in Weekly timeframe.
Breakouts happening in longer timeframe is way more powerful than the breakouts seen in Daily timeframe. You can blindly invest once the weekly candle closes above the breakout line and stay invested forever. Also these stocks breakouts are lifelong predictions, it means technically these breakouts happen giving more returns in the longer runs. Hence, even when the scrip makes a loss of 10% / 20% / 30% / 50%, the stock will regain and turn around. Once they again enter the same breakout level, they will flyyyyyyyyyyyy like a ROCKET if held in the portfolio in the longer run.
Time makes money, GREEDY & EGO will not make money.
Also, magically these breakouts tend to prove that the companies turn around and fundamentally becoming strong. Also the magic happens when more diversification is done in various sectors under various scripts with equal money invested in each N500 scripts.
The real deal is when to purchase and where to purchase the stock. That is where Breakout study comes into play.
LET'S PUMP IN SOME MONEY AND REVOLUTIONIZE THE NATION'S ECONOMY!

Amazing breakout on Weekly Timeframe - BLSCheckout an amazing breakout happened in the stock in Weekly timeframe, macroscopically seen in Daily timeframe. Having a great favor that the stock might be bullish expecting a staggering returns of minimum 25% TGT. IMPORTANT BREAKOUT LEVELS ARE ALWAYS RESPECTED!
NOTE for learners: Place the breakout levels as per the chart shared and track it yourself to get amazed!!
#No complicated chart patterns
#No big big indicators
#No Excel sheet or number magics
TRADE IDEA: WAIT FOR THE STOCK TO BREAKOUT IN LOWER TIMEFRAME AND RETRACE IF NEEDED. SL IS NEARER SUPPORT ZONE IN Daily TIMEFRAME.
Checkout an amazing breakout happened in the stock in Weekly timeframe.
Breakouts happening in longer timeframe is way more powerful than the breakouts seen in Daily timeframe. You can blindly invest once the weekly candle closes above the breakout line and stay invested forever. Also these stocks breakouts are lifelong predictions, it means technically these breakouts happen giving more returns in the longer runs. Hence, even when the scrip makes a loss of 10% / 20% / 30% / 50%, the stock will regain and turn around. Once they again enter the same breakout level, they will flyyyyyyyyyyyy like a ROCKET if held in the portfolio in the longer run.
Time makes money, GREEDY & EGO will not make money.
Also, magically these breakouts tend to prove that the companies turn around and fundamentally becoming strong. Also the magic happens when more diversification is done in various sectors under various scripts with equal money invested in each N500 scripts.
The real deal is when to purchase and where to purchase the stock. That is where Breakout study comes into play.
LET'S PUMP IN SOME MONEY AND REVOLUTIONIZE THE NATION'S ECONOMY!

Amazing breakout on Weekly Timeframe - MAHSEAMLESCheckout an amazing breakout happened in the stock in Weekly timeframe, macroscopically seen in Daily timeframe. Having a great favor that the stock might be bullish expecting a staggering returns of minimum 25% TGT. IMPORTANT BREAKOUT LEVELS ARE ALWAYS RESPECTED!
NOTE for learners: Place the breakout levels as per the chart shared and track it yourself to get amazed!!
#No complicated chart patterns
#No big big indicators
#No Excel sheet or number magics
TRADE IDEA: WAIT FOR THE STOCK TO BREAKOUT IN LOWER TIMEFRAME AND RETRACE IF NEEDED. SL IS NEARER SUPPORT ZONE IN Daily TIMEFRAME.
Checkout an amazing breakout happened in the stock in Weekly timeframe.
Breakouts happening in longer timeframe is way more powerful than the breakouts seen in Daily timeframe. You can blindly invest once the weekly candle closes above the breakout line and stay invested forever. Also these stocks breakouts are lifelong predictions, it means technically these breakouts happen giving more returns in the longer runs. Hence, even when the scrip makes a loss of 10% / 20% / 30% / 50%, the stock will regain and turn around. Once they again enter the same breakout level, they will flyyyyyyyyyyyy like a ROCKET if held in the portfolio in the longer run.
Time makes money, GREEDY & EGO will not make money.
Also, magically these breakouts tend to prove that the companies turn around and fundamentally becoming strong. Also the magic happens when more diversification is done in various sectors under various scripts with equal money invested in each N500 scripts.
The real deal is when to purchase and where to purchase the stock. That is where Breakout study comes into play.
LET'S PUMP IN SOME MONEY AND REVOLUTIONIZE THE NATION'S ECONOMY!

Amazing breakout on Weekly Timeframe - PAGEINDCheckout an amazing breakout happened in the stock in Weekly timeframe, macroscopically seen in Daily timeframe. Having a great favor that the stock might be bullish expecting a staggering returns of minimum 25% TGT. IMPORTANT BREAKOUT LEVELS ARE ALWAYS RESPECTED!
NOTE for learners: Place the breakout levels as per the chart shared and track it yourself to get amazed!!
#No complicated chart patterns
#No big big indicators
#No Excel sheet or number magics
TRADE IDEA: WAIT FOR THE STOCK TO BREAKOUT IN LOWER TIMEFRAME AND RETRACE IF NEEDED. SL IS NEARER SUPPORT ZONE IN Daily TIMEFRAME.
Checkout an amazing breakout happened in the stock in Weekly timeframe.
Breakouts happening in longer timeframe is way more powerful than the breakouts seen in Daily timeframe. You can blindly invest once the weekly candle closes above the breakout line and stay invested forever. Also these stocks breakouts are lifelong predictions, it means technically these breakouts happen giving more returns in the longer runs. Hence, even when the scrip makes a loss of 10% / 20% / 30% / 50%, the stock will regain and turn around. Once they again enter the same breakout level, they will flyyyyyyyyyyyy like a ROCKET if held in the portfolio in the longer run.
Time makes money, GREEDY & EGO will not make money.
Also, magically these breakouts tend to prove that the companies turn around and fundamentally becoming strong. Also the magic happens when more diversification is done in various sectors under various scripts with equal money invested in each N500 scripts.
The real deal is when to purchase and where to purchase the stock. That is where Breakout study comes into play.
LET'S PUMP IN SOME MONEY AND REVOLUTIONIZE THE NATION'S ECONOMY!

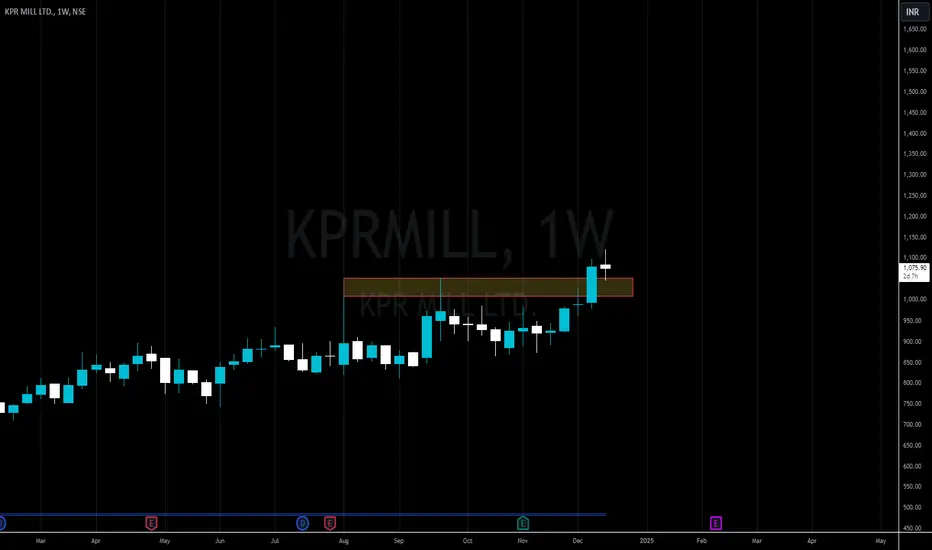
Amazing breakout on Weekly Timeframe - KPRMILLCheckout an amazing breakout happened in the stock in Weekly timeframe, macroscopically seen in Daily timeframe. Having a great favor that the stock might be bullish expecting a staggering returns of minimum 25% TGT. IMPORTANT BREAKOUT LEVELS ARE ALWAYS RESPECTED!
NOTE for learners: Place the breakout levels as per the chart shared and track it yourself to get amazed!!
#No complicated chart patterns
#No big big indicators
#No Excel sheet or number magics
TRADE IDEA: WAIT FOR THE STOCK TO BREAKOUT IN LOWER TIMEFRAME AND RETRACE IF NEEDED. SL IS NEARER SUPPORT ZONE IN Daily TIMEFRAME.
Checkout an amazing breakout happened in the stock in Weekly timeframe.
Breakouts happening in longer timeframe is way more powerful than the breakouts seen in Daily timeframe. You can blindly invest once the weekly candle closes above the breakout line and stay invested forever. Also these stocks breakouts are lifelong predictions, it means technically these breakouts happen giving more returns in the longer runs. Hence, even when the scrip makes a loss of 10% / 20% / 30% / 50%, the stock will regain and turn around. Once they again enter the same breakout level, they will flyyyyyyyyyyyy like a ROCKET if held in the portfolio in the longer run.
Time makes money, GREEDY & EGO will not make money.
Also, magically these breakouts tend to prove that the companies turn around and fundamentally becoming strong. Also the magic happens when more diversification is done in various sectors under various scripts with equal money invested in each N500 scripts.
The real deal is when to purchase and where to purchase the stock. That is where Breakout study comes into play.
LET'S PUMP IN SOME MONEY AND REVOLUTIONIZE THE NATION'S ECONOMY!
SOL pending breakoutBINANCE:SOLUSDT.P the bull flag seems to be holding quite well,
I'm getting in ahead of the breakout. If it fails, I'll catch the second.

$NASDAQ:QUBT Breaking Out of Bullish PennantNASDAQ:QUBT Looks like this is breaking out with an ~$8 upside (~$16 Price Target). Waiting for validation on volume, but we're already above 28M shares traded in the first 2 hours.

$NASDAQ:QUBT bullish pennant formation NASDAQ:QUBT is showing a bullish pennant formation which started after they released earnings (November). The price target if the pattern completes is ~$16.
Entry points:
The more conservative entry is above $8 after confirmation of a breakout (relatively higher volume, etc.)
Note:
Pennants (triangular in shape) can turn into flags (rectangular parallelogram). Both of which are bullish, but the flag can continue downwards making them look like they’re breaking down. All of this to say buying early and setting stops is more tricky. You’ll need to establish a stop based on your own comfort with risk.
Good luck!

Amazing breakout on Weekly Timeframe - LORDSCHLOCheckout an amazing breakout happened in the stock in Weekly timeframe, macroscopically seen in Daily timeframe. Having a great favor that the stock might be bullish expecting a staggering returns of minimum 25% TGT. IMPORTANT BREAKOUT LEVELS ARE ALWAYS RESPECTED!
NOTE for learners: Place the breakout levels as per the chart shared and track it yourself to get amazed!!
#No complicated chart patterns
#No big big indicators
#No Excel sheet or number magics
TRADE IDEA: WAIT FOR THE STOCK TO BREAKOUT IN LOWER TIMEFRAME AND RETRACE IF NEEDED. SL IS NEARER SUPPORT ZONE IN Daily TIMEFRAME.
Checkout an amazing breakout happened in the stock in Weekly timeframe.
Breakouts happening in longer timeframe is way more powerful than the breakouts seen in Daily timeframe. You can blindly invest once the weekly candle closes above the breakout line and stay invested forever. Also these stocks breakouts are lifelong predictions, it means technically these breakouts happen giving more returns in the longer runs. Hence, even when the scrip makes a loss of 10% / 20% / 30% / 50%, the stock will regain and turn around. Once they again enter the same breakout level, they will flyyyyyyyyyyyy like a ROCKET if held in the portfolio in the longer run.
Time makes money, GREEDY & EGO will not make money.
Also, magically these breakouts tend to prove that the companies turn around and fundamentally becoming strong. Also the magic happens when more diversification is done in various sectors under various scripts with equal money invested in each N500 scripts.
The real deal is when to purchase and where to purchase the stock. That is where Breakout study comes into play.
LET'S PUMP IN SOME MONEY AND REVOLUTIONIZE THE NATION'S ECONOMY!

Amazing breakout on Weekly Timeframe - RVHLCheckout an amazing breakout happened in the stock in Weekly timeframe, macroscopically seen in Daily timeframe. Having a great favor that the stock might be bullish expecting a staggering returns of minimum 25% TGT. IMPORTANT BREAKOUT LEVELS ARE ALWAYS RESPECTED!
NOTE for learners: Place the breakout levels as per the chart shared and track it yourself to get amazed!!
#No complicated chart patterns
#No big big indicators
#No Excel sheet or number magics
TRADE IDEA: WAIT FOR THE STOCK TO BREAKOUT IN LOWER TIMEFRAME AND RETRACE IF NEEDED. SL IS NEARER SUPPORT ZONE IN Daily TIMEFRAME.
Checkout an amazing breakout happened in the stock in Weekly timeframe.
Breakouts happening in longer timeframe is way more powerful than the breakouts seen in Daily timeframe. You can blindly invest once the weekly candle closes above the breakout line and stay invested forever. Also these stocks breakouts are lifelong predictions, it means technically these breakouts happen giving more returns in the longer runs. Hence, even when the scrip makes a loss of 10% / 20% / 30% / 50%, the stock will regain and turn around. Once they again enter the same breakout level, they will flyyyyyyyyyyyy like a ROCKET if held in the portfolio in the longer run.
Time makes money, GREEDY & EGO will not make money.
Also, magically these breakouts tend to prove that the companies turn around and fundamentally becoming strong. Also the magic happens when more diversification is done in various sectors under various scripts with equal money invested in each N500 scripts.
The real deal is when to purchase and where to purchase the stock. That is where Breakout study comes into play.
LET'S PUMP IN SOME MONEY AND REVOLUTIONIZE THE NATION'S ECONOMY!
