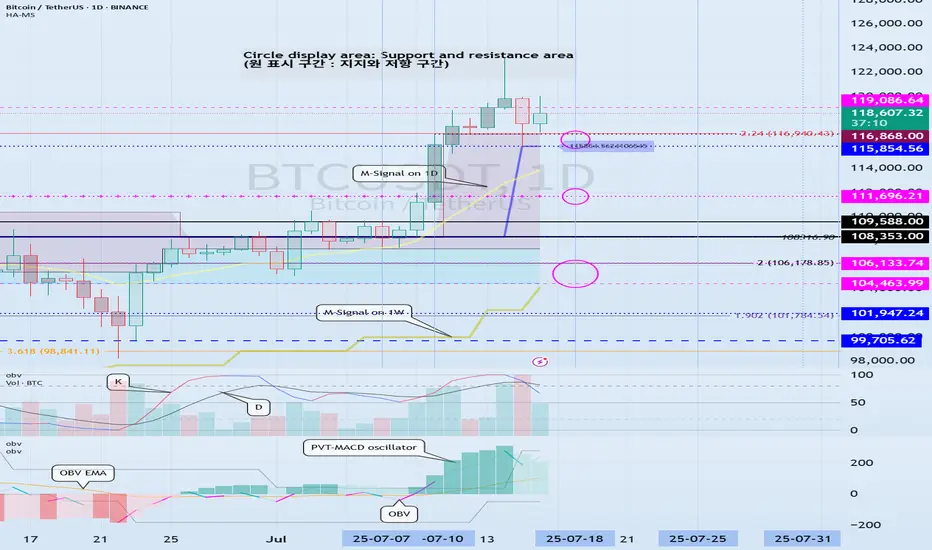
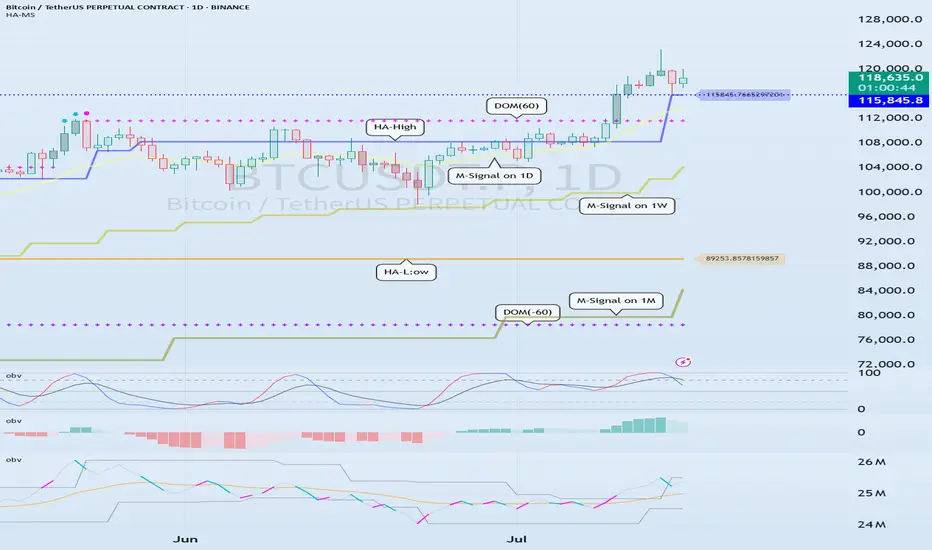
Check support at 115854.56-119086.64
Hello, traders.
If you "Follow", you can always get new information quickly.
Have a nice day today.
-------------------------------------
(BTCUSDT 1D chart)
On the 1W chart, the DOM(60) indicator was created at the 119086.64 point.
Accordingly, the key is whether it can be supported near 119086.64.
The meaning of the DOM(60) indicator is to show the end of the high point.
In other words, if it rises above HA-High ~ DOM(60), it means that there is a high possibility of a stepwise upward trend.
On the other hand, if it fails to rise above DOM(60), it is likely to turn into a downtrend.
The basic chart for chart analysis is the 1D chart.
Therefore, if possible, check the trend of the 1D chart first.
The DOM(60) indicator of the 1D chart is currently formed at the 111696.21 point.
And, the HA-High indicator was created at the 115854.56 point.
Therefore, since it cannot be said that the DOM(60) indicator of the 1D chart has been created yet, if the price is maintained near the HA-High indicator, it seems likely to rise until the DOM(60) indicator is created.
We need to look at whether the DOM(60) indicator will be created while moving sideways at the current price position or if the DOM(60) indicator will be created when the price rises.
If the price falls and falls below 111696.21, and the HA-High indicator is generated, the HA-High ~ DOM(60) section is formed, so whether there is support in that section is the key.
-
Since the DOM(60) indicator on the 1W chart was generated, if it fails to rise above the DOM(60) indicator, it is highly likely that the HA-High indicator will be newly generated as it eventually falls.
Therefore, you should also look at where the HA-High indicator on the 1W chart is generated when the price falls.
-
The next volatility period is around July 18 (July 17-19).
Therefore, you should look at which direction it deviates from the 115854.56-119086.64 section after this volatility period.
Since the K of the StochRSI indicator fell from the overbought section and changed to a state where K < D, it seems likely that the rise will be limited.
However, since the PVT-MACD oscillator indicator is above 0 and the OBV indicator is OBV > OBV EMA, it is expected that the support around 115845.56 will be important.
-
Thank you for reading to the end.
I hope you have a successful trade.
--------------------------------------------------
- Here is an explanation of the big picture.
(3-year bull market, 1-year bear market pattern)
I will explain the details again when the bear market starts.
------------------------------------------------------
Btc!
When will Altseason start?So with ETH.D sweeping its all time low I feel very confident that eth has made the low for this cycle as well as BTC.D retracing providing further confluence that this is the case and we will see eth start to outperform bitcoin but I begun to question where altcoins stand currently stand and when we will start to see them outperform both BTC and ETH as they currently bleed to them as Both ETH and BTC make higher lows while altcoin pairs are making lower lows. I feel like until we see a run above this trend line above the .82 lvl we will see altcoins bleed against ETH and BTC.

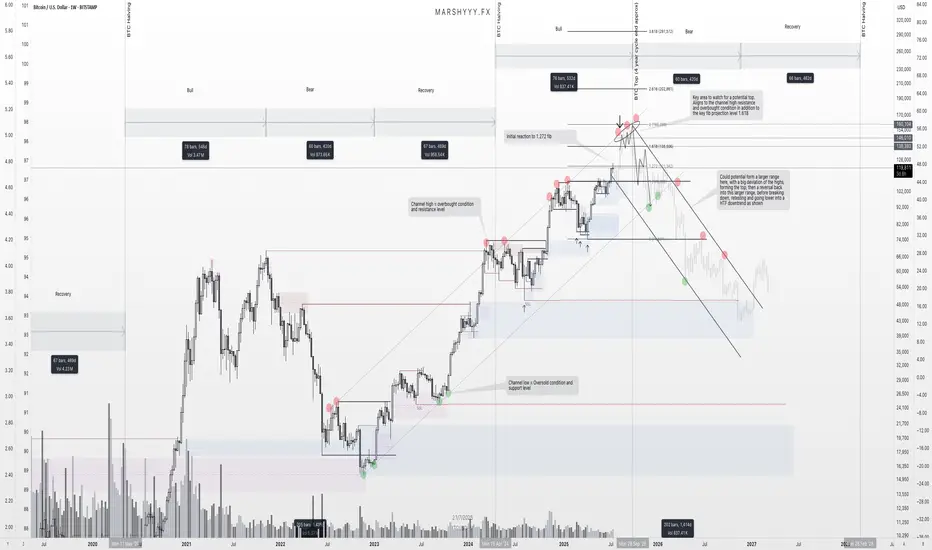
BTC – Final Push Before the Top? Here's What I’m WatchingBeen getting a lot of questions recently about where I think BTC tops this cycle, so I figured it’s time to lay out what I’m seeing on the higher timeframes and what could be coming next.
First off, I want to stress this again — USDT.D will be the key chart for spotting the top. It’s been one of the most accurate indicators across the board for understanding tops and bottoms. But it’s even more powerful when used alongside broader structure and confluence, which is what I’m doing here.
Looking at BTC’s high timeframe structure, I’ve been tracking this ascending trend channel since 2023 — and we’ve remained within its bounds beautifully. Every leg up has been met with a reaction near the channel highs, while each major correction has tapped into the lower channel support or just below midline before continuing the trend.
Right now, price is pushing back up toward that upper channel resistance, and if it behaves like it has previously, I’d expect it to act as a major magnet again. That aligns with a projected range of $140,000 to $160,000, depending how deep the wick runs or how extended this move gets from the channel midline.
On top of that, fib extensions from the previous high to low give us another layer of confidence. We’ve already seen a reaction at the 1.272 level, which paused price temporarily. The next big fib? The 1.618 — which sits right around $138k — adding confluence with the top of this HTF trend channel.
What makes this even more interesting is that this move is aligning near-perfectly with the 4-year cycle structure, which suggests a potential cycle top around September 2025. That’s roughly two months away, and it fits the pattern of previous cycles where BTC tops approximately 18–20 months post-halving.
As we approach this zone, I’ll be watching for the usual signs: slowing momentum, bearish divergence, volume anomalies, and rejection candles into resistance. But I won’t just be relying on the BTC chart alone. I’ll be stacking confluences from other key indicators too — USDT.D, BTC.D, macro risk indicators, and stablecoin flows — to confirm if this is truly the top or if there’s one more leg left in the tank.
Once the top does form, whether it's $138k or $160k or somewhere in between, I think we move into the distribution phase that begins the next macro downtrend. The next few years will be about preservation and accumulation again, and I’m already eyeing zones like $49k and below as potential long-term HTF demand levels when that time comes.
For now, we’re in what I believe is the final bullish leg of this cycle. I’m positioned, prepared, and watching closely for signs of exhaustion as we move into this zone of confluence.
Let the market do its thing — just make sure you’ve got a plan for when the music stops.
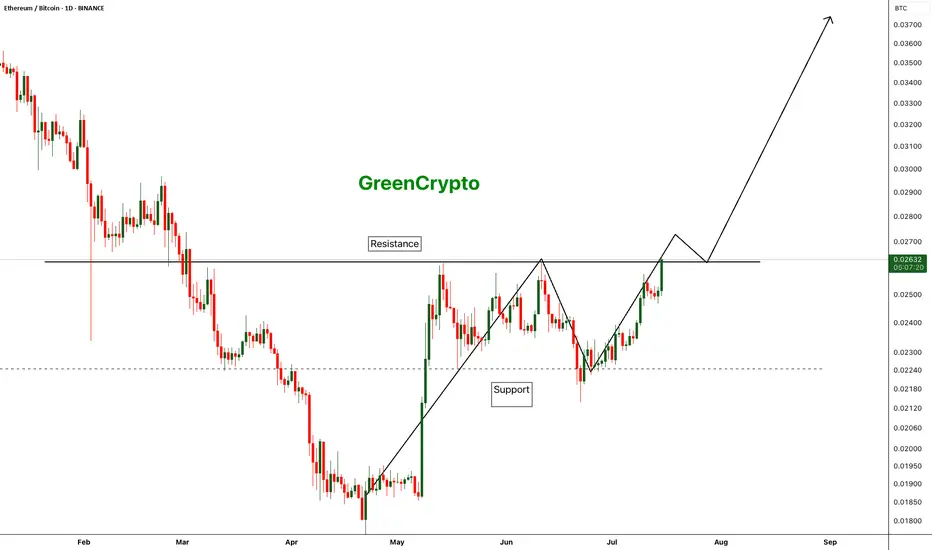
ETH/BTC - Finally Trend is reversing - After a long time we are finally seeing a change in the trend of ETH/BTC pair.
- Compared to BTC, ETH was underperforming for last couple of years and we are seeing some strength in ETH
- If this trend continue we can finally see some new ATH on ETH
Entry: 0.02633
StopLoss: 0.02125
TP1: 0.02825
TP2: 0.03168
TP3: 0.03592
Don't forget to keep stop loss. Stay tuned for more updates
Cheers
GreenCrypto

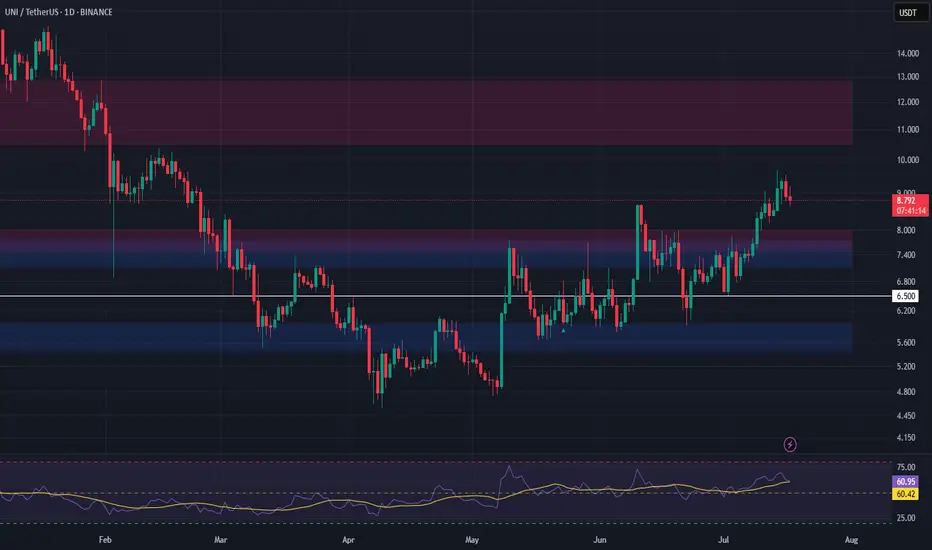
UNI Long Setup – Breakout Retest into High-Confluence SupportUniswap (UNI) has broken out of resistance and is now pulling back into a high-confluence zone, forming a strong bullish structure. The $7.13–$7.73 area presents a favorable entry on the retest.
📌 Trade Setup:
• Entry Zone Around: $7.13 – $7.73
• Take Profit Targets:
o 🥇 $10.50 – $12.85
• Stop Loss: Daily close below $6.50
THAT WHAT YOU NEED TO KNOW ABOUT BTC IN 2025Professional Technical Analysis & Trading Plan for BTC/USD (Hypothetical 2025 Data)
---
1. Technical Structure & Key Observations
A. Price Context:
- **Current Price:** ~84,197 (below SMA 81,998).
- **SMA (Simple Moving Average):** 81,998 (likely 200-day SMA, acting as dynamic resistance).
- **Volume:** 52K (low volume suggests consolidation; watch for spikes to confirm breaks).
C. Key Levels (From Data):
- **Resistance:**
- Immediate: 81,998 (SMA).
- Major: 90,000, 100,000, 130,000 (swing highs).
- **Support:**
- Near-term: 74,000 (psychological),
---
2. Advanced Indicator Analysis
A. Momentum (RSI & MACD):**
- **RSI (14):** Likely near 40–45 (neutral-bearish zone). A break below 30 signals oversold; above 55 confirms bullish momentum.
- **MACD:** Bearish crossover possible (signal line above MACD line). Watch for reversal above SMA.
B. Volume Profile:
- **Low Volume (52K):** Indicates weak participation. A surge above 100K on a breakout/breakdown would validate direction.
- **Volume-Weighted Average Price (VWAP):** If price trades above VWAP, bullish bias strengthens.
---
3. Trading Strategies
Scenario : Bullish Reversal (30% Probability)
- **Trigger:** Daily close above SMA (81,998) with volume >100K.
- **Entry:** Long at 74,500 (confirmation of strength).
- **Targets:**
- TP1: 90,000 (8.5% move).
- TP2: 100,000 (19% move).
- **Stop Loss:** 71,500
---
5. Sentiment & Catalyst Watch
- **Bullish Catalysts:** Institutional ETF inflows, Fed rate cuts, Bitcoin halving momentum.
- **Bearish Risks:** Regulatory crackdowns, exchange hacks, macro recession.
-Conclusion
BTC/USD is at a critical juncture. *Trade the SMA break/breakdown with volume confirmation*, and prioritize risk-reward ratios. Always cross-verify with real-time data and news.
Disclaimer: Hypothetical analysis for educational purposes. Not financial advice.* 🚀

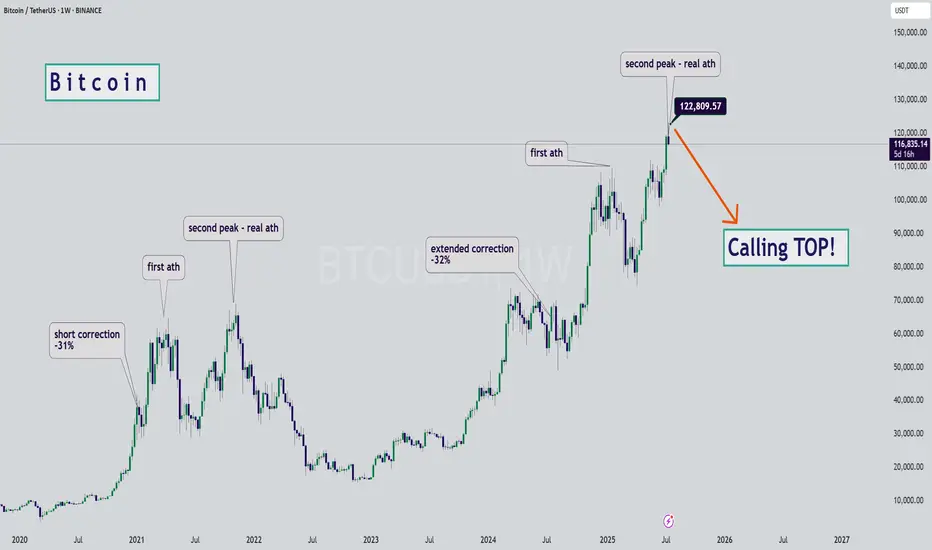
BTC - Calling the Start of the Bearish SeasonHello Watchers ☕
This was my previous Bitcoin update where I had a target of $116K, and also then closed all open positions at $122K:
I'm calling the top here mainly because of the way the chart looks, it really is classic Wyckoff if you look at the duration of the current bullish cycle, which has lasted a whole 973 Days with a 564% increase. What goes up, must come down!
Just for interest sake, the previous bullish cycle ran for 600 days with a 700% increase.
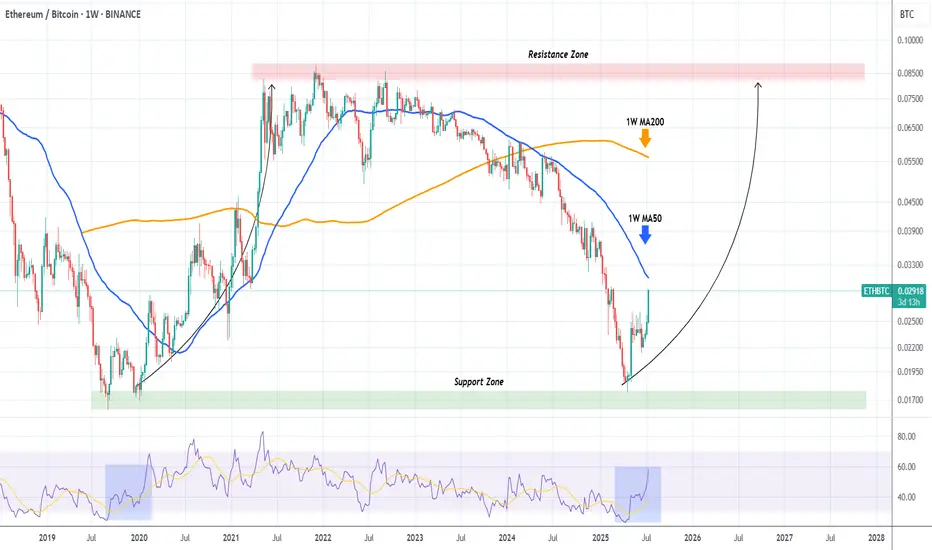
ETHBTC shows that Ethereum will outperform Bitcoin MASSIVELY!The ETHBTC pair has been rebounding hyper aggressively after the April 21 2025 Low on the 6-year Support Zone, and is now facing it's most important test, the 1W MA50 (blue trend-line).
This trend-line has been its Resistance since basically March 13 2023, so if broken, it will be a massive bullish break-out signal.
In fact during the 2020 - 2021 Bullish Leg, once the price broke above the 1W MA50, the market got the final confirmation of the upcoming long-term rally.
We expect Ethereum to outperform Bitcoin for the rest of the year at least.
-------------------------------------------------------------------------------
** Please LIKE 👍, FOLLOW ✅, SHARE 🙌 and COMMENT ✍ if you enjoy this idea! Also share your ideas and charts in the comments section below! This is best way to keep it relevant, support us, keep the content here free and allow the idea to reach as many people as possible. **
-------------------------------------------------------------------------------
💸💸💸💸💸💸
👇 👇 👇 👇 👇 👇

Bitcoin Dominance BTC.D analysisCurrently, the maximum of BTC.D was 65.38% and the absolute maximum is very close, and then the capital will start flowing into altcoins.
We will have to keep a close eye on where the capital will go: only to highly liquid altcoins, or to a certain industry, or to a narrative, as it was before: “defi”, “memecoin”, and so on...
Do you have any ideas where the capital can go? Write in the comments!
❗️ Also, it is worth noting that such a popular term as "alt-season" lasts less and less, and you have to wait longer and longer for it!
It seems that this time the "alt-season" has every chance to last until the end of 2025, and then... it will be seen. Perhaps the market will gain capital and new powerful players who will set a new vector and new rules by 2028....
But first... we have to live to see it!)
_____________________
Did you like our analysis? Leave a comment, like, and follow to get more

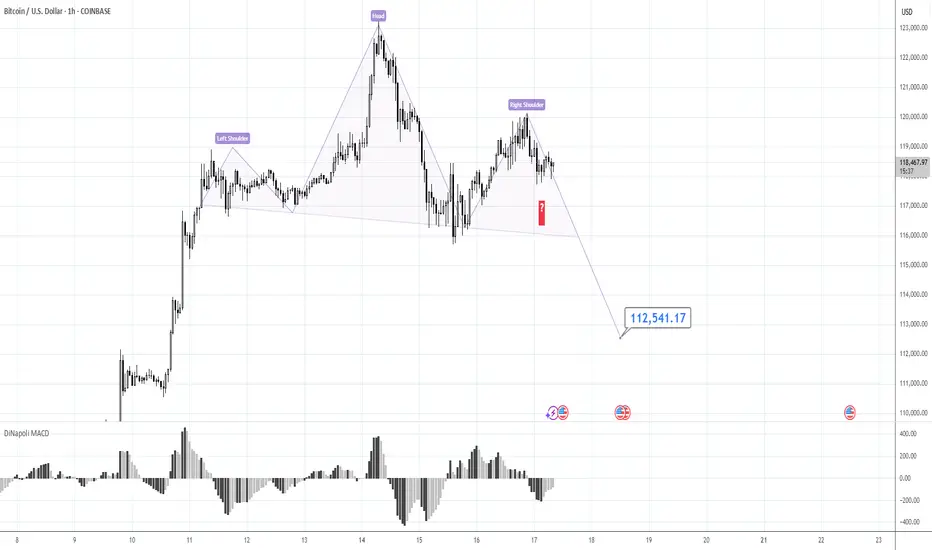
120K is the Key.Morning folks,
Our last plan worked perfect - market re-tested 117K support and jumped out. If you have longs - you could keep it.
We consider now two alternative scenarios, although we think that this one with triangle is more probable, we do not exclude the H&S shape on 1H chart that could lead BTC down to 112-113K support area.
So, if you do not know how to deal with this - keep an eye on the 120K area and top of the right arm. Upside breakout will confirm H&S failure and triangle scenario. Otherwise, until market stands under 120K - consider H&S as a basic scenario, just for safety.
Take care, S.
Bitcoin and Upcoming TrendBitcoin’s trend has been growing from strength to strength — and it’s likely to stay that way. Why?
This trend isn’t driven purely by speculation; it’s supported by strong fundamental reasons.
One of the most widely debated topics in finance today is the comparison between Bitcoin and gold. While both are viewed as stores of value, their long-term roles may diverge significantly.
Yet, they’ve been moving in near-perfect synchronization, with potential resistance ahead, but their trend still remain intact — and here’s why.
Mirco Bitcoin Futures and Options
Ticker: MBT
Minimum fluctuation:
$5.00 per bitcoin = $0.50 per contract
Disclaimer:
• What presented here is not a recommendation, please consult your licensed broker.
• Our mission is to create lateral thinking skills for every investor and trader, knowing when to take a calculated risk with market uncertainty and a bolder risk when opportunity arises.
CME Real-time Market Data help identify trading set-ups in real-time and express my market views. If you have futures in your trading portfolio, you can check out on CME Group data plans available that suit your trading needs www.tradingview.com

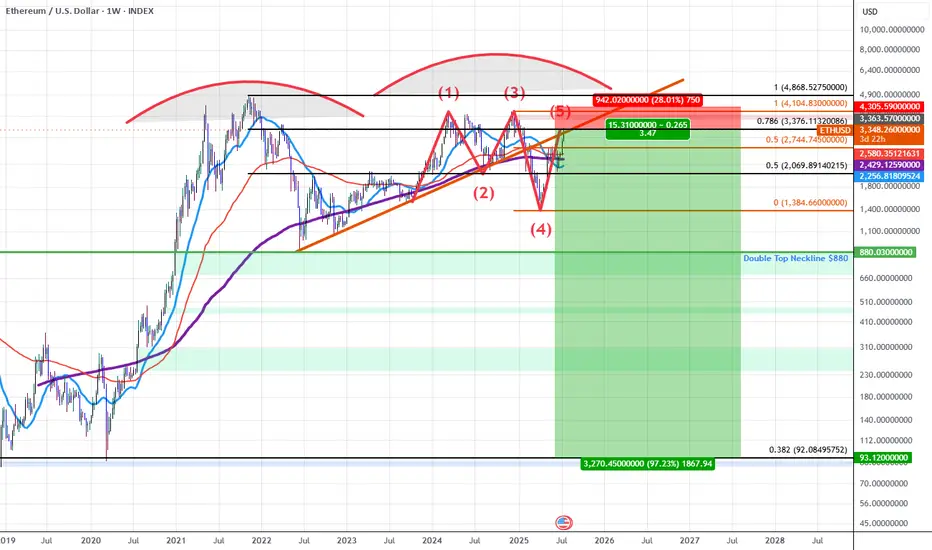
ETHUSD: Double Top into A Bearish 5-0 Breakdown (Extended)Updated Commentary: ETH has extended a bit further than projected as the Pattern Completed at the 0.618 but ETH gapped into the 0.786 instead. The gap up aligned with an upside gap fill on the CME futures as well as a gap fill on the grayscale ETH futures ETF $ETHE. The easier move from here to simply add to the ETH shorts and adjust the stop to be above the previous highs while sizing up at the 0.786 and playing off this gap higher as an anomaly. Beyond this, my view on ETH at the current 0.786 retrace remains the same as the original Idea posted as ETH rose into the initial 0.618 PCZ the details of which I will also include once again below as it still remains relevant.
ETH for the last 5 years has been developing a Double Topping pattern which has put in a series of lower highs during the most recent 2nd run up. As we've confirmed these lower highs we've broken down below trendline and are finding resistance at the trendline which happens to have confluence with the PCZ of a Bearish 5-0 wave formation near a 0.786 retrace.
As we begin to find weakness and Bearish price action begins I suspect price will make it's way towards the neckline of the double top aligning with the $880 price level if ETH breaks below that level there will be no significant support until it reaches the all-time 0.382 retrace down at around $92.10.
In short it seems ETH is in the early stages of a macro breakdown which could result in value declines greater than 80%.
I also suspect that we will see many of the assets that ran up significantly going into this week to sharply reverse those run-ups as this week comes to a close and the new week begins mainly due to the effects of OpEx, this includes: Bitcoin, MSTR, SOL, XLC, META, and BTBT. Long-dated Put accumulation on these assets at these levels is far easier to manage than naked short positions and that's how I will go about positioning here.
Need a trading strategy to avoid FOMO
Hello, traders.
If you "Follow", you can always get new information quickly.
Have a nice day today.
-------------------------------------
1D chart is the standard chart for all time frame charts.
In other words, if you trade according to the trend of the 1D chart, you can make profits while minimizing losses.
This can also be seen from the fact that most indicators are created based on the 1D chart.
In that sense, the M-Signal indicators of the 1M, 1W, and 1D charts are suitable indicators for confirming trends.
If the price is maintained above the M-Signal indicator of the 1M chart, it is highly likely that the upward trend will continue in the medium to long term, so it is recommended to take note of this advantage especially when trading spot.
The M-Signal indicator on the 1W, 1D chart shows the medium-term and short-term trends.
The M-Signal indicator uses the MACD indicator formula, but it can be seen as a price moving average.
You can trade with just the price moving average, but it is difficult to select support and resistance points, and it is not very useful in actual trading because it cannot cope with volatility.
However, it is a useful indicator when analyzing charts or checking general trends.
Therefore, what we can know with the M-Signal indicator (price moving average) is the interrelationship between the M-Signal indicators.
You can predict the trend by checking how far apart and close the M-Signal indicators are, and then checking the direction.
-
If you have confirmed the trend with the M-Signal indicator, you need support and resistance points for actual trading.
Support and resistance points should be drawn on the 1M, 1W, and 1D charts.
The order of the roles of support and resistance points is 1M > 1W > 1D charts.
However, the strength of the role of support and resistance points can be seen depending on how long the horizontal line is.
Usually, in order to perform the role of support and resistance points, at least 3 candles or more form a horizontal line.
Therefore, caution is required when trading when the number of candles is less than 3.
The indicators created considering this point are the HA-Low and HA-High indicators.
The HA-Low and HA-High indicators are indicators created for trading on the Heikin-Ashi chart and indicate when the Heikin-Ashi candle turns upward or downward.
Therefore, the creation of the HA-Low indicator means that there is a high possibility of an upward turn.
In other words, if it is supported by the HA-Low indicator, it is a time to buy.
However, if it falls from the HA-Low indicator, there is a possibility of a stepwise decline, so you should also consider a countermeasure for this.
The fact that the HA-High indicator was created means that there is a high possibility of a downward turn.
In other words, if there is resistance from the HA-High indicator, it is a time to sell.
However, if it rises from the HA-High indicator, there is a possibility of a stepwise upward turn, so you should also consider a countermeasure for this.
This is where a dilemma arises.
What I mean is that the fact that the HA-High indicator was created means that there is a high possibility of a downward turn, so you know that there is a high possibility of a downward turn, but if it receives support and rises, you think that you can make a large profit through a stepwise upward turn, so you fall into a dilemma.
This is caused by greed that arises from falling into FOMO due to price volatility.
The actual purchase time should have been when it showed support near the HA-Low indicator, but when it showed a downward turn, it ended up suffering a large loss due to the psychology of wanting to buy, which became the trigger for leaving the investment.
Therefore, if you failed to buy at the purchase time, you should also know how to wait until the purchase time comes.
-
It seems that you can trade depending on whether the HA-Low and HA-High indicators are supported, but the task of checking whether it is supported is quite difficult and tiring.
Therefore, to complement the shortcomings of the HA-Low and HA-High indicators, the DOM(60) and DOM(-60) indicators were added.
The DOM(-60) indicator indicates the end of the low point.
Therefore, if it shows support in the DOM(-60) ~ HA-Low section, it is the purchase time.
If it falls below the DOM(-60) indicator, it means that a stepwise downtrend is likely to begin.
The DOM(60) indicator indicates the end of the high point.
Therefore, if it is supported and rises in the HA-High ~ DOM(60) section, it means that a stepwise uptrend is likely to begin.
If it is resisted and falls in the HA-High ~ DOM(60) section, it is likely that a downtrend will begin.
With this, the basic trading strategy is complete.
This is the basic trading strategy of buying when it rises in the DOM(-60) ~ HA-Low section and selling when it falls in the HA-High ~ DOM(60) section.
For this, the trading method must adopt a split trading method.
Although not necessarily, if it falls in the DOM(-60) ~ HA-Low section, it will show a sharp decline, and if it rises in the HA-High ~ DOM(60) section, it will show a sharp rise.
Due to this volatility, psychological turmoil causes people to start trading based on the price, which increases their distrust in the investment market and eventually leads them to leave the investment market.
-
When looking at the movement of the 1D chart, it can be seen that it is not possible to proceed with trading at the moment because it is already showing a stepwise upward trend.
However, since there is a SHORT position in futures trading, trading is possible at any time.
In any case, it is difficult to select a time to buy because the 1D chart shows a stepwise upward trend.
However, looking at the time frame chart below the 1D chart can help you select a time to buy.
The basic trading strategy is always the same.
Buy when it rises in the DOM(-60) ~ HA-Low section and sell when it falls in the HA-High ~ DOM(60) section.
Currently, since the 1D chart is continuing a stepwise upward trend, the main position is to eventually proceed with a long position.
Therefore, if possible, you should focus on finding the right time to buy.
However, if it falls below the HA-High indicator of the 1D chart, the possibility of a downtrend increases, so at that time, you should focus on finding the right time to sell.
In other words, since the HA-High indicator of the current 1D chart is generated at the 115845.8 point, you should think of different response methods depending on whether the price is above or below the 115845.8 point.
Therefore, when trading futures, increase the investment ratio when trading with the main position (a position that matches the trend of the 1D chart), and decrease the investment ratio when trading with the secondary position (a position that is different from the trend of the 1D chart) and respond quickly and quickly.
When trading in the spot market, you have no choice but to trade in the direction of the 1D chart trend, so you should buy and then sell in installments whenever it shows signs of turning downward to secure profits.
In other words, buy near the HA-Low indicator on the 30m chart, and if the price rises and the HA-High indicator is created, sell in installments near that area.
-
You should determine your trading strategy, trading method, and profit realization method by considering these interrelationships, and then trade mechanically accordingly.
If you trade only with fragmentary movements, you will likely end up suffering losses.
This is because you do not cut your losses.
-
Thank you for reading to the end.
I hope you have a successful trade.
--------------------------------------------------
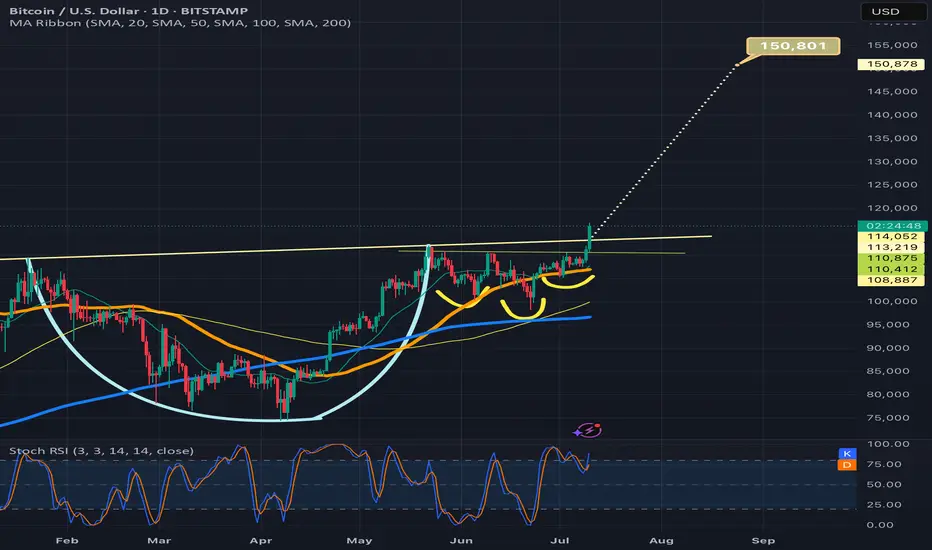
Btcusd breaking above cup and handle necklineIf it confirms the bullish breakout the target is 150k. Also by breaking above 116k and solidifying that level as strong support, we will trigger an even bigger inverse head and shoulders pattern (not shown here) with a breakout target around 208k! I will provide a link below to the chart I posted of that pattern. Thanks for reading, liking, and following. *not financial advice*
BRIEFING Week #29-30 : BTC stalling, ETH & then Alts ?Here's your weekly update ! Brought to you each weekend with years of track-record history..
Don't forget to hit the like/follow button if you feel like this post deserves it ;)
That's the best way to support me and help pushing this content to other users.
Kindly,
Phil

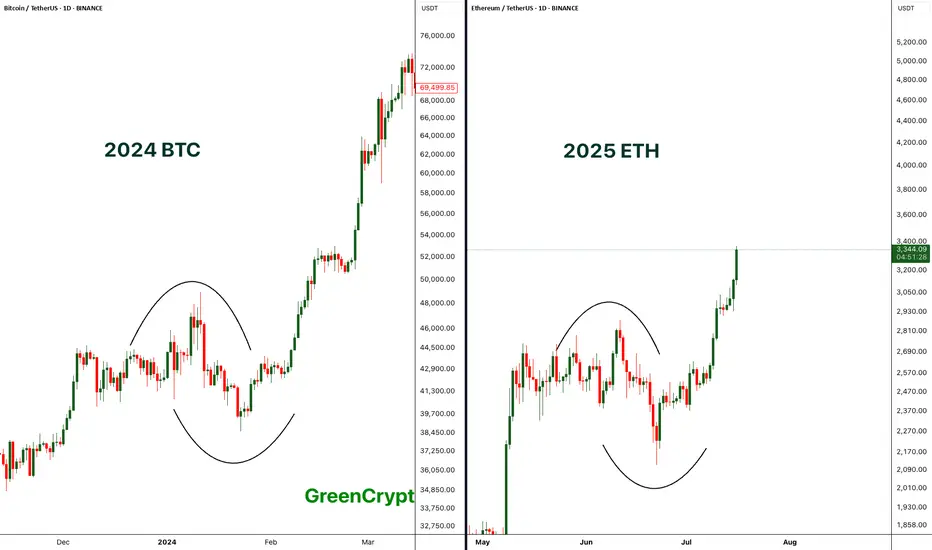
Comparing BTC 2024 with ETH 2025 - Perfect Match- If compare the chart pattern of BTC from 2024 with the current 2025 ETH pattern, wee see exactly similar chart patterns being formed here.
- Price started consolidating then it had fake breakout towards both the sides and finally the real breakout.
- BTC breakout push the price towards the new all time high above 69K, if we ETH follows similar trend then we can expect new all time high on ETH.
Let's see how it plays out.
Stay tuned for more updates.
Cheers
GreenCrypto
Bitcoin positive diversion to $131,000Using fibonacci retracements for price targets based off of positive divergences on the 15 min time frame and hourly time frame. I am utilizing 2 ioscilating indicators: RSI length is 36 with smma at 50 and the Chande momentum oscillator with a length of 24. My conservative estimate is $131,000 for a safe trade close. $132,400 exact area for pullback to $128,500?

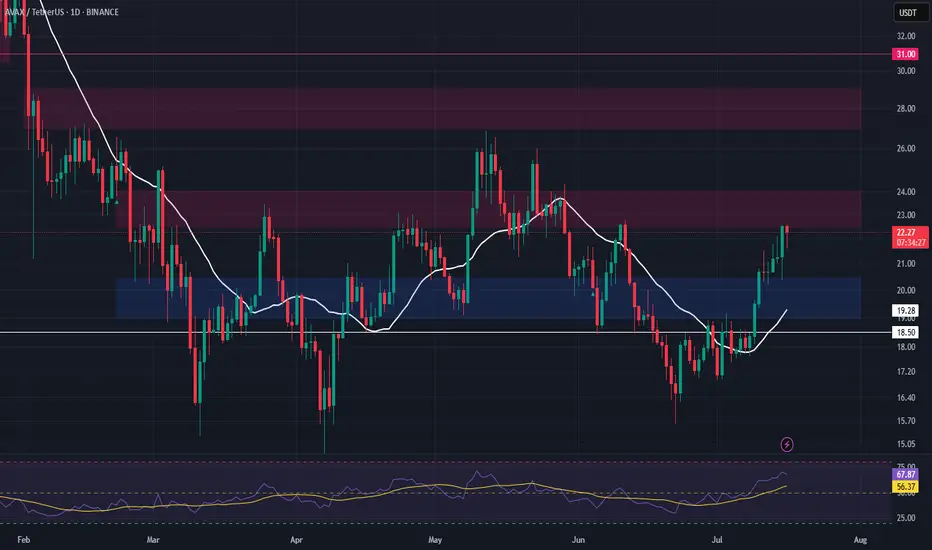
AVAX – Watching for Support Retest After Resistance TestAVAX is currently testing a major resistance level, and we’re anticipating a potential retrace into support. The $19.00–$20.45 zone offers a strong area to enter a long swing position on confirmation of the retest.
📌 Trade Setup:
• Entry Zone: $19.00 – $20.45
• Take Profit Targets:
o 🥇 $22.50 – $24.00
o 🥈 $27.00 – $30.00
• Stop Loss: Daily close below $18.50
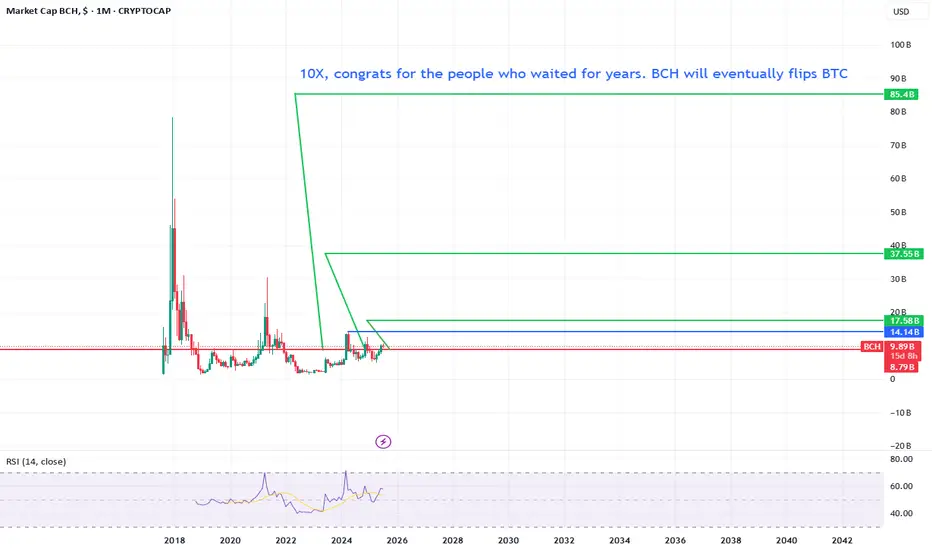
Bitcoin Cash will do a solid 10X For years bitcoin cash is been selling off.
But let me tell you this, we are just getting started.
If we pass the blue line we are officially triggered for a 85 billion marketcap.
Can still take some time but eventually it will happen. Make sure to fomo in when the party is starting!
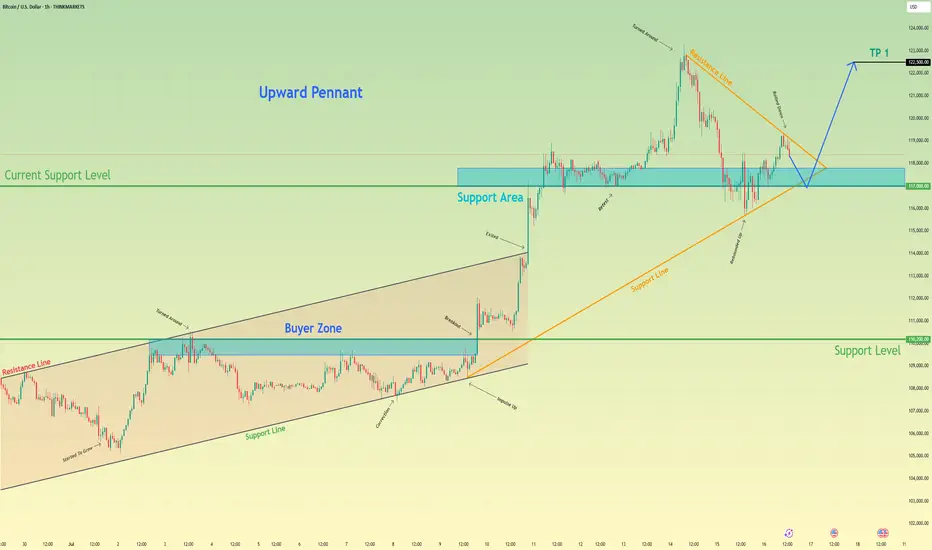
Bitcoin may exit of pennant and then rebound up of support areaHello traders, I want share with you my opinion about Bitcoin. Earlier, the price was moving inside an upward channel, respecting both the resistance and support boundaries. After reaching the buyer zone (110200–109500 points), BTC made a strong impulse up, breaking out of the channel and entering a new phase of growth. This breakout led to the formation of a bullish pennant, which often signals a continuation of the uptrend. Right now, the price is testing the support area between 117000 and 117800, which previously acted as a breakout zone and now serves as a current support level (117000). The structure shows that this level has already worked as a rebound zone multiple times. In my opinion, BTC may continue the correction toward this support area, potentially exiting the pennant to the downside for a short-term pull-back. After that, I expect a new upward movement, targeting the next local high. That’s why I set my TP at 122500 points, which is just below the recent ATH. Given the impulse move, strong support zone, breakout from the channel, and the bullish pennant pattern, I remain bullish and expect BTC to resume its upward trend soon. Please share this idea with your friends and click Boost 🚀
Disclaimer: As part of ThinkMarkets’ Influencer Program, I am sponsored to share and publish their charts in my analysis.
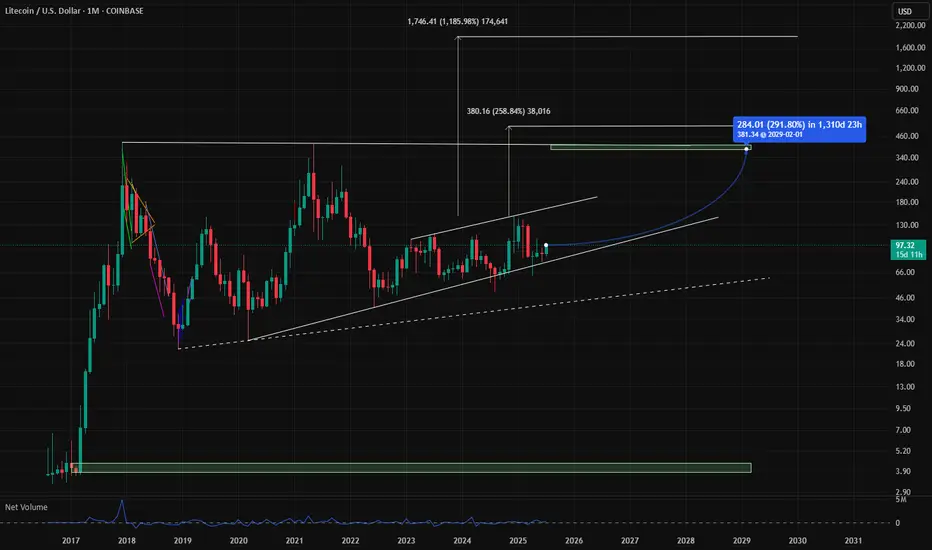
LTC Targets 400$ + 1900$ Litcoin LTC Targets for the next run are atm +290% is a realistic szenario. The addvanced targets at 1900$ are very impressiv but remember there are only 21 Mio. Coins too, like BTC because it is the fork and think about an alternative payment methode like btc, would be a reason for 1900$ pro LTC. So in Crypto is nothing unreal if you could imagine, but first of all approx. 400$ are a good direction. GM
Bitcoin: New All-Time High — What’s Next?Bitcoin had an incredible run, breaking the old all-time high ($111,980) with strong bullish momentum and setting a fresh ATH at $123,218 (Binance). We just witnessed the first major corrective move of ~6% and a decent bounce so far — but the big question is:
What’s next? Will Bitcoin break higher over the summer or form a trading range here?
Let’s dive into the technicals.
🧩 Higher Timeframe Structure
May–June Range:
BTC was stuck between $110K–$100K, forming an ABC corrective pattern. Using trend-based Fib extension (TBFE) from A–B–C:
✅ C wave completed at $98,922 (1.0 TBFE)
✅ Upside target hit at $122,137 (-1 TBFE)
Full Bull Market TBFE:
➡️ 1.0 → $107,301 → previously rejected
➡️ 1.272 → $123,158 → recent rejection zone
Pitchfork (log scale):
➡️ Tapped the upper resistance edge before rejecting.
Previous Bear Market Fib Extension:
➡️ 2.0 extension at $122,524 hit.
2018–2022 Cycle TBFE:
➡️ 1.618 at $122,011 tapped.
Macro Fibonacci Channel:
➡️ Connecting 2018 low ($3,782), 2021 ATH ($69K), 2022 low ($15,476) →
1.618–1.666 resistance band: $121K–$123.5K.
✅ Conclusion: Multiple fib confluences mark the $122K–$123K zone as critical resistance.
Daily Timeframe
➡️ FVG / Imbalance:
Big daily Fair Value Gap between the prior ATH and $115,222 swing low.
BTC broke the prior ATH (pATH) without retest → a pullback to this zone is likely.
Lower Timeframe / Short-Term Outlook
We likely saw a completed 5-wave impulse up → now correcting.
The -6% move was probably wave A, current bounce = wave B, next leg = wave C.
➡ Wave B short zone: $120K–$121K
➡ Wave C target (1.0 TBFE projection): ~$113,326
➡ Confluence at mid-FVG + nPOC
Trade Setups
🔴 Short Setup:
Entry: $120,300–$121,000
Stop: Above current ATH (~$123,300)
Target: $113,500
R:R ≈ 1:2.3
🟢 Long Setup:
Entry: Between Prior ATH and $113,000
Stop: Below anchored VWAP (~$110,500)
Target: Higher, depending on bounce confirmation.
🧠 Educational Insight: Why Fibs Matter at Market Extremes
When markets push into new all-time highs, most classic support/resistance levels disappear — there’s simply no historical price action to lean on. That’s where Fibonacci extensions, channels, and projections become powerful tools.
Here’s why:
➡ Fibonacci extensions (like the 1.272, 1.618, 2.0) help estimate where trend exhaustion or profit-taking zones may appear. They are based on the psychology of crowd behavior, as traders anchor expectations to proportional moves from previous swings.
➡ Trend-Based Fib Extensions (TBFE) project potential reversal or continuation zones using not just price levels, but also the symmetry of prior wave moves.
➡ Fibonacci channels align trend angles across multiple market cycles, giving macro context — like how the 2018 low, 2021 ATH, and 2022 low project the current 1.618–1.666 resistance zone.
In short:
When you don’t have left-hand price history, you lean on right-hand geometry.
That’s why the $122K–123K zone wasn’t just random — it’s a convergence of multiple fib levels, cycle projections, and technical structures across timeframes.
⚡ Final Thoughts
Bitcoin faces major resistance around $122K–$123K backed by multiple fib and structural levels. A retest of the prior ATH zone (~$112K–$113K) looks probable before the next big directional move. Watch lower timeframe structure for signs of completion in this corrective phase.
_________________________________
💬 If you found this helpful, drop a like and comment!
Want breakdowns of other charts? Leave your requests below.
