BITCOIN → Consolidating before an important eventBINANCE:BTCUSD is consolidating between 99.5K and 91.8K as traders await action from politicians and Trump's inauguration as the main driver behind the rally.
Fundamentally, things are still good. Trump promised a lot of positive actions towards bitcoin and the cryptocurrency market in general, but at the moment the main issue is the inclusion of bitcoin on the balance of the federal reserve. But everything depends more on the realization of the promises, if the community does not get what they were promised, a correction may be triggered.
Technically bitcoin looks very strong. After a strong rally, there is no hint of a possible fall or deep correction, which means that someone is keeping the price in the specified range. Until important events, the price can still stand still, in the range between 100K and 90K.
As for altcoins, they are getting a chance as bitcoin dominance continues to decline after the trendline break. A capital move could spark a rally in strong altcoins in the near term.
Resistance levels: 99.5K, 102.5K, 103.5K
Support levels: 95K, 91.7K
Since the price is in neutral and trading between strong levels, I prioritize a false breakdown of resistance and correction inside the channel. Then further reaction may give hints. If there will be no fall and the price starts to consolidate in the resistance area, then we will have a chance to rise to 102-103K
Regards R. Linda!
Btc-e

Would you sell against BTC?After BTCUSD reached its All Time High (ATH) of 108,451 on Dec 17th, it dropped strongly to the support area of 91,600.
In the first week of the year, BTCUSD has bounced off the support to trade up to the 101,900 area again. Which coincides with the 61.8% Fibonacci retracement level.
At this point, the TSRI MACD is indicating the potential for a crossover to the downside.
However, if the price stays above the 38.2% Fibonacci retracement level AND the bullish trendline, further upside is likely!
Would be looking to buy at value rather than trying to short it down.

MAGIC/USDT NEW INCREASEMAGIC/USDT known with name : Treasure
NEW INCREASE
Showing new volume upcoming which can get confirmed for new uptrend

Battle of Emerging ChainsMain chains gaining activity this cycle are
#1 SOL
#2 base
#3 SUI
#4 HYPE
these chains and applications on them should get a massive boost if/when OTHERS breaks out TRX style

$BTC - Short Trade IdeaBitcoin has broken past the psychological barrier at $100k, absorbing the internal liquidity.
There's a chance it will shoot up to between $103.7k and $104k as the daily closes.
We've marked out our 4-hour range; the price is now trading above the midpoint. If we manage to hold this level, we could potentially retest the range high around $106k.
If we get a strong rejection at that point, we might consider scaling into short positions.

Short-term uptrend if maintained above 97461.86
Hello, traders.
If you "Follow", you can always get new information quickly.
Please click "Boost" as well.
Have a nice day today.
-------------------------------------
(BTCUSDT chart)
There are three major rising channels.
Among them, two rising channels are expected to play an important role in determining the trend.
-------------------------------------
(BTCUSDT 1D chart)
BTC is currently moving sideways after the price increase.
However, as the MS-Signal (M-Signal on the 1D chart) indicator rises above the level, the possibility of a short-term uptrend increases.
As a result, the support around 97461.86-98892.0 is the key.
-
The important support and resistance range is 93576.0-94742.35.
The high point boundary range is 101947.24-106.133.74.
Therefore, the 101947.24-106.133.74 range is likely to act as resistance.
If the high point boundary range is broken upward, a new wave is expected to be created.
Then, the current movement can be interpreted as creating a pull back pattern and rising.
Therefore, when creating a pull back pattern, it is likely to appear depending on whether there is support near the M-Signal indicator on the 1M, 1W, and 1D charts.
Therefore, it is necessary to closely watch the movement near the M-Signal indicator.
-
The next volatility period is around January 10 (January 9-11).
Therefore, the point of interest is where it is located after January 10.
------------------
The BW indicator has touched the 0 point, and the DOM indicator has risen above 0.
Accordingly, it is important to see whether it can maintain the price by rising above 98892.0.
Since the StochRSI indicator shows a change in slope in the overbought zone, it shows that it is under pressure to decline, so it is important to see whether it can maintain the price by rising above 98892.0.
-
Thank you for reading to the end. I hope you have a successful transaction.
--------------------------------------------------
- Big picture
I used TradingView's INDEX chart to check the entire range of BTC.
(BTCUSD 12M chart)
Looking at the big picture, it seems to have been in an upward trend since 2015.
In other words, it is a pattern that maintains a 3-year upward trend and faces a 1-year downward trend.
Accordingly, the upward trend is expected to continue until 2025.
-
(LOG chart)
Looking at the LOG chart, you can see that the upward trend is decreasing.
Accordingly, the 46K-48K range is expected to be a very important support and resistance range from a long-term perspective.
Therefore, I expect that we will not see prices below 44K-48K in the future.
-
The Fibonacci ratio on the left is the Fibonacci ratio of the uptrend that started in 2015.
That is, the Fibonacci ratio of the first wave of the uptrend.
The Fibonacci ratio on the right is the Fibonacci ratio of the uptrend that started in 2019.
Therefore, this Fibonacci ratio is expected to be used until 2026.
-
No matter what anyone says, the chart has already been created and is already moving.
It is up to you how to view and respond to it.
Since there is no support or resistance point when the ATH is updated, the Fibonacci ratio can be appropriately utilized.
However, although the Fibonacci ratio is useful for chart analysis, it is ambiguous to use it as a support and resistance role.
The reason is that the user must directly select the important selection points required to create the Fibonacci.
Therefore, it can be useful for chart analysis because it is expressed differently depending on how the user specifies the selection point, but it can be seen as ambiguous for use in trading strategies.
1st: 44234.54
2nd: 61383.23
3rd: 89126.41
101875.70-106275.10 (when overshooting)
4th: 134018.28
151166.97-157451.83 (when overshooting)
5th: 178910.15
-----------------

LOE Something's cooking here...Alright guys, after I gave you VEXT the last time and a 12x within a blink of an eye, this time here another gem which is worth to be observed more. But this one is kinda tricky...
We can find a hint where this coin could go in the future or probably very fast in this bullrun:
On March 29th-30th 2024 the currency of the Play-And-Earn fantasy game "Legends of Elysium" (LOE) made an All-time high of $9.15 after the first private sale round to VCs and early investors before the token launched on various central exchanges (CEX) and decentral exchange (DEX) swaps. The data before April just popped up recently on Coinmarketcap, although it could've been just a candle wick for a brief moment of time. It wasn't visible before November / December 2024 when I checked. In Coingecko and in charts here on TradingView like e.g. of Gate.io, MEXC or Bitget it's also not visible.
So it's probably nothing... Or is it? Well, the marketcap right now sits at around $220k and the FDV is $3.2M which is kinda promising. Reaching a $1 B marketcap could be in the cards (pun intended). The developer team is constantly updating the game and announces always news like the new Battlefield Mode which was implemented recently.
Chartwise the RSI is making constant higher lows since almost a year which could indicate a massive bullish divergence on the daily and weekly. Furthermore LOE is forming a double bottom since October which also could be an indicator for incoming of new buyers and the stability of the coin.
So who wants to bet this thing will pop off?

The Trump DumpCaution to the sensitive bulls, you're not going to like this one...
I know we all like hopium and up-only charts, but this isn't it. Those only exist in fairytales. This is trading and we have to stay grounded if you plan to actually profit outside of the HODL philosophy.
The truth is that elections don't matter, new events doesn't matter. At least not how the majority thinks they do. These events merely mark points in time, they can be catalysts or pivots. But those time points don't care about your philosophy on the actual event.
Let the emotion and philosophy in and you'll lose, guaranteed. Close those out and look only at the charts, using those events to understand important time points to pay attention to and you might see that this one is going to be critical.
On a macro picture, this market structure has been clear, simply a series of expansions and ranges (I know, obvious, this is how all price moves). But recently we had a strong expansion beyond the all-time high, which might seem bullish at first glance but is going to be a liquidity trap in hindsight.
On a more local view, we have our range forming after this larger expansion and that range has already generated a fakeout higher and come back into the range, with the next breakout of the range to be to the downside. I do not trade blind FVGs or other ICT stuff, but there will be a lot of hindsight analysis from people claiming that this daily FVG was obvious.
Combine this with the important time events that has everyone so bullish, like elections or whatever, and you have the perfect recipe to wreck almost everyone.
From here, I am looking for AT LEAST a 30% drop . Targets may get lower as data comes in, but keeping it conservative until more high timeframe candles come in.
You may disagree with the post, but at least it has a clear bias.

Is CTT dead?BYBIT:CTTUSDT
Im just curious on where CTT is at because i have seen a little speculation online about how 'CTT is dead' or 'The scam has played out..'
To me? If this bottoms here there is an exponential amount of gains to be made here.. to the point were if your putting 1k down at this bottom now and say it goes back up to a resistance of 0.0040.. thats a 6.5k profit of such little movements.
Trade safe, RPM

$BTC parabolic waves are inevitable!#Bitcoin don't worry about the corrective waves occurring in the early stages of the bull run, focus on the big picture and enjoy the ride!

Trading Psychology: How Does Your Mind Matter In Making Money?Trading Psychology: Mastering Your Emotions for Success
The renowned book on trading psychology, Tradingpsychologie, aptly states: “The greatest enemy of the trader is fear. He who is afraid loses.” This succinctly encapsulates the importance of managing emotions in trading.
As a trader, you’ve likely experienced emotions such as fear, greed, regret, hope, overconfidence, doubt, and nervousness. While every trader faces these emotional challenges, successful traders understand that letting emotions dictate their decisions is a recipe for failure.
The essence of trading psychology lies in controlling your emotions to make sound investment decisions. In this article, we’ll delve into the concept of trading psychology and provide practical tips to help you trade with confidence.
What is Trading Psychology?
Trading psychology refers to a trader’s emotional and mental state, which influences their trading actions. Emotions like hope and confidence can be beneficial, but those like fear and greed must be managed. A common emotional challenge in financial markets is the fear of missing out, or FOMO.
To become a successful trader, it’s crucial to cultivate a sharp mindset, coupled with knowledge and experience. Let’s explore the key psychological factors that impact a trader’s mindset and pro-tips to manage them effectively.
Key Psychological Factors in Trading
1. Fear
Fear arises when something valuable is at risk. In trading, risks may include:
Negative news about a stock or the market
A trade going in the wrong direction
The potential loss of capital
Fear often leads traders to overreact and prematurely liquidate their holdings. A strong trading psychology means not letting fear dictate your buy/sell strategy.
What should you do?
Identify the root cause of your fear and address it in advance. Reflect on these issues so that when fear arises, you can address it logically. Focus on not letting the fear of loss hinder potential profits.
2. Greed
Greed emerges when you seek excessive profits. Remember, Rome wasn’t built in a day, and neither will your trading fortune. A winning streak can quickly turn into a disaster if greed takes over.
What should you do?
Combat greed by setting predefined profit-taking levels. Before entering a trade, establish your stop-loss and profit-booking levels to avoid impulsive decisions. A sound trading psychology involves being satisfied with reasonable profits and avoiding the pursuit of irrational gains.
3. Regret
Regret manifests in two ways:
Regretting a trade that didn’t succeed
Regretting not taking a trade that could have succeeded
Trading based on regret can lead to poor decision-making.
What should you do?
Accept that you can’t capture every market opportunity. The trading equation is simple: you win some, you lose some. Embracing this mindset will help you develop a healthier trading psychology.
4. Hope
Many traders equate trading with gambling, hoping to win all the time. When they don’t, they feel dejected.
What should you do?
To succeed, cultivate a trading psychology that doesn’t rely on hope. Don’t let hope keep you invested in a losing trade. Be practical and book losses at the right time to protect your capital.
How to Improve Your Trading Psychology
1. Get Yourself in the Right Mindset
Before starting your trading day, remind yourself that markets are inherently volatile. Good days and bad days are inevitable, but the bad days will pass. Take time to build a robust trading strategy unaffected by market sentiment.
2. Build a Solid Knowledge Base
Improving your trading psychology begins with increasing your market knowledge. A strong knowledge base empowers you to overcome negative emotions and make informed decisions. Remember, knowledge is power.
3. Recognize the Reality of Real Money
It’s easy to forget that the numbers on your screen represent real money. While it’s natural to take risks in hopes of generating returns, always approach trading with caution and make well-thought-out decisions.
4. Learn from Successful Traders
The stock market treats every trader differently. Observe the habits of successful traders not to replicate them, but to glean insights. Incorporating some of their strategies into your trading approach can significantly enhance your performance.
5. Practice, Practice, Practice
The most reliable way to strengthen your trading psychology is through practice. Consistent practice helps you build effective strategies and prepares you for market ups and downs.
Final Thoughts
Developing a robust trading psychology takes time and consistent effort. Continuously refine your approach to manage your emotions and improve your decision-making.
To summarize, remember these three golden principles of trading psychology:
Be disciplined.
Be flexible.
Never stop learning.
I’d love to hear your thoughts and see your charts in the comments section. Let’s grow together as traders!
Thank you for reading!

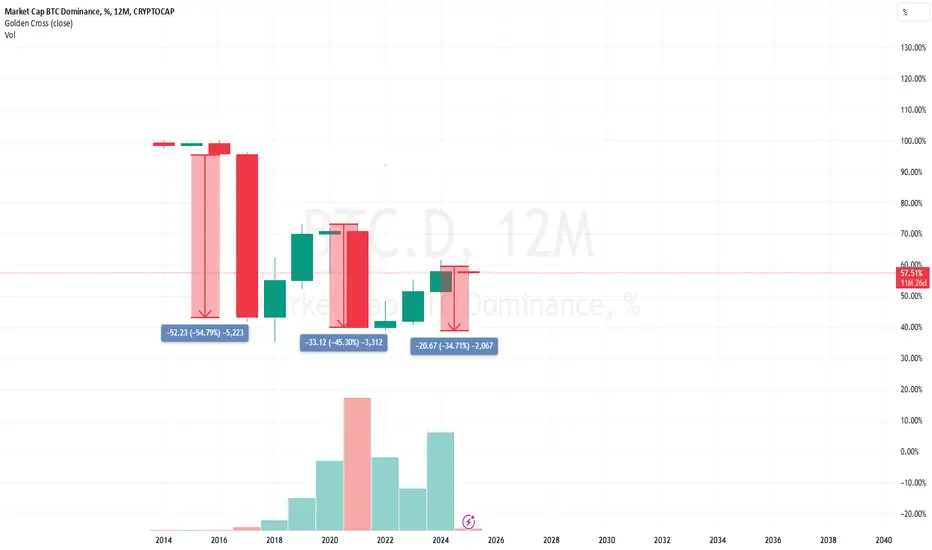
Next Alt sessionBTC.D tends to drop right after its halving cycle; this may be the last altcoin season.
Scalp in H1The price is fluctuating within the range of $91,000 to $108,000. A breakout above the $98,000 resistance could signal a buying opportunity. 📈
📈 Signal:
Entry: $100,516
Target: $108,130
Stop Loss: $98,526
Control Risk management⚠️

BITCOIN UPDATE 2025 | ALTSEASON | BTC.DWe'll kick of the first analysis of the new year by taking a look at BTC, and whether or not the conditions are met to say the ATH is in.
Furthermore, let's loo at altseason by comparing the TOTAL3 chart and the Bitcoin Dominance chart. Many secrets lie in these charts if you overlap them, and look for patterns.
Soon, I will be making an update on the top Altcoins to watch in 2025 so be sure to follow so you don't miss it!
__________________

BTC - SHORT - Tempting but dangerous tradeBTC is facing a major resistance at 100k. I expect a drop at least in 4 hours timeframe. This is a very risky trade because shorting BTC and in a bull market is not at all advisable. Personally I think it will most likely go close to the POC (97500~) and then go up. Likewise, if the 91k is broken strongly, we will go to very low areas and it is very tempting to let it go. The weekly is still a latent possibility to go to low levels. But nothing is certain and we can easily go in any direction. I would not short BTC for a long time or with a high margin. So this trade must be constantly protected. Be careful.
TP 1: 96500 ~ 97500 (protect trade - POC)
TP 2: 93100 (support)
TP 3: 91600 (daily support)

KAVA ANALYSIS🚀#KAVA Analysis :
🔮As we can see in the chart of #KAVA that there is a formation of "Falling Wedge Pattern". In a 3d timeframe #KAVA broke out the pattern and perfectly retest the levels. Expecting a bullish move in few days
⚡️What to do ?
👀Keep an eye on #KAVA price action. We can trade according to the chart and make some profits⚡️⚡️
#KAVA #Cryptocurrency #TechnicalAnalysis #DYOR

Bitcoin's Ultimate Pump: The Trap Before the CrashBitcoin continues its “hype” and is close to forming the next spurt. Globally, the picture looks like close to the distribution zone. We are approaching the biggest “cheat” in history. I expect a final spurt into the zone around 120k, from here a long trade will start where altcoins will shoot up and show incredible gains. The crowd will be experiencing FOMO, heads of state and big companies will start making noise that this is just a pro-trade level for Bitcoin before the next spurt. Only the majority will fall back into the trap and end up in a bear market with huge losses. The market is set up so that only 10% will make money and the other 90% will be cheated. After the distribution is completed, I expect the bitcoin price to fall below the 0.5 Fibonacci level. The RSI value will drop below 30 units on such a drop and we will enter a global fear phase. I would attribute the next bull market to the rise of the DeSci and AI sectors. My research on the cryptocurrency market sectors shows that large funds and corporations are starting to invest in projects in these areas.
Horban Brothers.

Bitcoin in lower timeframes (4H)Bitcoin appears to be within a "Trading Range" on lower timeframes.
Within this range, a bearish "QM" (Quasimodo) pattern seems to have formed. To complete the right shoulder of this QM, the price may need to rise to higher levels (red box).
It could move from the green box up to the red box.
Generally, during the year-end holiday period, many large and small traders need cash and sell part of their assets, causing a mid-level correction in the market. During these days, the market seeks liquidity hunts and fluctuations within a specific range. At this stage, it's advisable to reduce the number of your trades and avoid futures trading to some extent.
For risk management, please don't forget stop loss and capital management
Comment if you have any questions
Thank You

Bitcoin's Bullish Breakout: Key Targets at $100,887 and $103khello guys!
Hunt Zones:
Two liquidity "hunt" zones are marked:
Hunt 1: A resistance level where sellers initially dominated.
Hunt 2: A support area where buyers stepped in to push the price higher.
Bullish Structure:
The price has created a higher low and is showing signs of bullish momentum.
The engulfing pattern indicates a strong buyer presence.
Key Levels:
$100,887: First significant resistance level, which could act as a decision point.
$103,010: Final target zone for the current bullish trend.
Expected Movement:
A breakout above the $100,887 resistance may lead to further upside toward $103,010.
Consolidation or pullback may occur at intermediate levels before continuing higher.
----------------------------------
Summary:
The outlook is bullish as long as the price remains above support levels near $97,000. Watch for price action around $100,887 for confirmation of further upward momentum.

BTC On Its Way To New ATH?!Nice recovery for Bitcoin!
It looks really good for an attempt to break the ATH I must say..
This is the 3D Chart.
We crossed back above and are bouncing off the light blue preliminary fib line on the DFR , this could be a leg up towards $120,000 but lets stay conservative and say $104,000 is our first target if we manage to break through $101,500.
The level to hold for bulls is $96,300. Everything in between is irrelevant and would suggest BTC going higher.
What are your thoughts? Is a new ATH near for Bitcoin?

#WhatsTheTicker Your Asset, Our Expertise: Technical/Fundamental
Bring the Energy! 🚀
✨ We invest hours uncovering potential opportunities and crafting insightful ideas just for you. Your support fuels our passion for creating value for the Trading/Investing community!
✅ Like ❤️ and Follow 🌟 for more actionable insights and expert analysis.
⚠️ Stay Agile: Markets shift quickly, and even the best signals can face strong, fast-changing trends.
Best regards, DCAChampion

MARA’s BTC Strategy and Bitcoin’s Path ForwardBitcoin miner MARA Holdings has made headlines with its innovative approach to leveraging its BTC reserves and exceeding its hash rate target. The company's December 2024 production update highlights strategic moves and technical achievements, providing a strong foundation for bullish sentiment on Bitcoin.
MARA’s BTC Lending Program: Fundamentals at Play
MARA revealed that 16.4% of its Bitcoin reserves, equivalent to 7,377 BTC worth approximately $730 million, has been deployed in short-term third-party loans to generate modest single-digit yields. This strategy underscores MARA’s dual approach of mining and buying Bitcoin to optimize its holdings. The company’s total reserves now stand at an impressive 44,893 BTC, valued at over $4.4 billion at current prices.
According to Robert Samuels, MARA’s vice president of investor relations, the lending program focuses on secure, short-term arrangements with well-established third parties. This initiative reflects a prudent approach to maximizing shareholder value while maintaining liquidity.
MARA’s production update also highlighted a milestone achievement: surpassing its energized hash rate target of 50 EH/s, reaching a peak of 53.2 EH/s. Despite a 2% decrease in BTC production due to a slight dip in mining “luck,” MARA’s overall strategy remains robust. CEO Fred Thiel emphasized the benefits of the company’s hybrid model, which combines mining and purchasing Bitcoin to enhance flexibility and long-term value.
Technical Analysis
As of writing, Bitcoin’s price has shown remarkable resilience, briefly reclaiming the $99,000 level before a slight retracement to $98,745. The technical indicators suggest a strong bullish trend:
1. RSI Strength: With the Relative Strength Index (RSI) at 62, Bitcoin exhibits momentum that could propel it to break key resistance levels.
2. Fibonacci Retracement: In the event of selling pressure or a correction, the $94,000 level—the 78.6% Fibonacci retracement—is poised to serve as a critical support zone.
3. Open Interest Surge: Open interest in Bitcoin futures has surged, driven by renewed institutional interest, particularly after Donald Trump’s presidential election victory. Firms like MicroStrategy (MSTR) are increasingly viewing Bitcoin as a hedge against inflation.
A Bullish Case
Bitcoin’s fundamentals are bolstered by several macroeconomic and geopolitical factors:
1. Institutional Adoption: Companies like MARA and MicroStrategy are doubling down on Bitcoin, reflecting growing confidence in its role as “digital gold.”
2. Hash Rate Milestones: Bitcoin’s monthly hash rate reached an all-time high in December, showcasing the network’s increasing security and resilience.
3. Political Developments: The anticipation of Donald Trump’s inauguration in January 2025 has spurred optimism in financial markets, with Bitcoin positioned as a safe haven against inflationary pressures.
Conclusion
With institutional adoption accelerating and macroeconomic conditions favoring digital assets, Bitcoin appears poised for a breakout. As MARA and other players continue to innovate, the cryptocurrency’s role as a cornerstone of the global financial system becomes increasingly evident. Investors and analysts should keep a close eye on the inauguration of Donald Trump and its potential market implications, as Bitcoin stands ready to capitalize on the evolving landscape.

