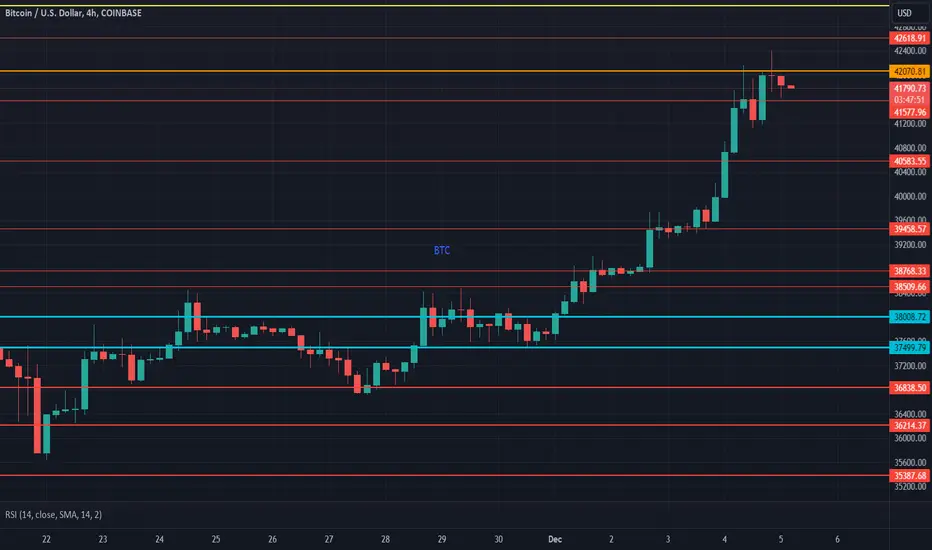
Btctrading
Daily technical Analysis on Bitcoin The bear has taken control of the market after Btc/usdt just broke out of the uptrend channel on the daily time frame. We'll be keeping an eye on price movement in the 25000 to 23600 zone for potential bullish momentum building up. If that doesn't work, we'll wait for the discount zone at 22000-18000 zone for potential buys. BINANCE:BTCUSDT
BTC Price Continues to Lag Hourly Below SMA 50, 100, and 200 Despite recent fluctuations, the BTC price still struggles to break above the Simple Moving Averages (SMA) of 50, 100, and 200 hourly. This persistent struggle raises concerns about the current market conditions and prompts us to consider a cautious approach in the future.
The Significance of Simple Moving Averages:
Before we delve further, let's briefly discuss the significance of the Simple Moving Averages. These technical indicators help us identify trends and potential support or resistance levels in the market. The SMA 50, 100, and 200 are considered crucial indicators, often relied upon by traders to gauge the overall health of an asset's price action.
The Concerning Trend:
As we closely monitor the BTC price movement, it becomes evident that the cryptocurrency is struggling to gain momentum above the SMA 50, 100, and 200 hourly. This indicates a lack of bullish strength and raises concerns about the potential for a sustained upward trend in the short term.
The Importance of Caution:
Given the current market conditions, traders must exercise caution and consider pausing their BTC trading activities until the price demonstrates more favorable conditions. Although the cryptocurrency market is known for its volatility, it is equally important to recognize when the odds may not be in our favor.
Call-to-Action: Pause Any BTC Until Conditions Improve:
Considering the persistent struggle of BTC to break above the SMA 50, 100, and 200 hourly, it is advisable to pause any BTC trading activities until we witness a more favorable market scenario. We can mitigate potential risks by exercising patience, waiting for improved conditions, and making more informed trading decisions.
Conclusion:
As traders, we are responsible for closely analyzing market trends and adapting our strategies accordingly. The current situation, with BTC prices still below the crucial SMA 50, 100, and 200 hourly, raises concerns about the short-term outlook. We can safeguard our investments by pausing any BTC trading activities until conditions improve and potentially take advantage of more favorable market conditions.
Remember, being cautious and patient is better than rushing into uncertain market situations. Let's stay informed and make calculated decisions to ensure the long-term success of our trading endeavors.
Should We Ignore BTC's Recent Price Despite Current Negative MVRIntroduction:
Bitcoin (BTC) has established itself as a key player in the volatile cryptocurrency trading world. However, recent fluctuations in its price have left traders questioning whether they should pay attention to the negative Market-Value-to-Realized-Value (MVRV) ratio. This article explores the significance of BTC's recent price movements and cautions traders against falling into potential bear traps.
Understanding the Negative MVRV Ratio:
The MVRV ratio is a widely used metric in the cryptocurrency market that compares the market value of an asset to its realized value. When the MVRV ratio is negative, it suggests that most BTC holders are currently at a loss. This situation can often lead to panic selling and a downward price spiral.
Analyzing the Current Market Situation:
While the negative MVRV ratio may sound alarming, it is crucial to approach this situation cautiously. Remembering that cryptocurrency markets are highly speculative and subject to various external factors is essential. Focusing solely on the negative MVRV ratio may lead to overlooking other crucial indicators that can provide a more comprehensive understanding of the market sentiment.
The Bear Trap Phenomenon:
Bear traps are deceptive market situations where a temporary price recovery occurs within a declining trend. Traders who fail to recognize these traps may be lured into buying at higher prices, only to experience further losses when the trend continues downward. Therefore, awareness of the potential bear trap associated with BTC's recent price movements is vital.
Call-to-Action: Be Aware and Cautious!
As a trader, it is essential to approach the current market situation with a sense of awareness and caution. Here are a few key points to consider:
1. Diversify Your Portfolio: Avoid putting all your eggs in one basket. Diversifying your investments across multiple cryptocurrencies can help mitigate risk and provide a more balanced approach.
2. Conduct Thorough Research: Stay informed about the latest news, market trends, and expert opinions. This will enable you to make more informed decisions rather than relying solely on one indicator.
3. Set Realistic Expectations: Understand that cryptocurrency markets are highly volatile, and short-term price fluctuations are common. Avoid making impulsive decisions based solely on negative MVRV ratios or temporary price movements.
Conclusion:
While the negative MVRV ratio may raise concerns, it is essential to cautiously approach BTC's recent price movements. Falling into bear traps can lead to significant losses. By diversifying your portfolio, conducting thorough research, and setting realistic expectations, you can confidently navigate the market. Stay vigilant and make informed decisions to safeguard your investments.
Remember, in cryptocurrency trading, knowledge and awareness can be your most valuable assets.
Bitcoin's Continued Fall Below SMA 200Introduction:
In recent days, Bitcoin has experienced a significant decline, with its current value dipping below the Simple Moving Average (SMA) 200. This alarming trend has raised concerns among traders and investors alike. As a cautious trader, it is crucial to objectively analyze the situation and consider the potential risks before making investment decisions. This article aims to shed light on the current state of Bitcoin and provide a call to action urging individuals to exercise restraint when considering investing in this volatile cryptocurrency.
Understanding Bitcoin's Decline:
Bitcoin's fall below the SMA 200 signifies a bearish sentiment in the market. The SMA 200, a widely recognized technical indicator, represents the average price of Bitcoin over the past 200 days. When the price falls below this moving average, it suggests a potential shift in the overall market sentiment toward a downward trend. This development should not be taken lightly, as it may indicate further price depreciation in the coming weeks or months.
The Volatility of Bitcoin:
Bitcoin has always been known for its extreme volatility, with frequent sharp price fluctuations. While this volatility can present lucrative opportunities for some traders, it carries significant risks. The current decline below SMA 200 highlights the need for caution, as it suggests a potential trend reversal that could lead to further losses. Traders must weigh the potential rewards against the inherent risks before making investment decisions.
Call-to-Action: Hold Off on Investing in Bitcoin:
Given the current state of Bitcoin and its fall below the SMA 200, it is prudent for traders to exercise caution and hold off on investing in this cryptocurrency. Here are a few reasons why:
1. Market Uncertainty: The recent decline below SMA 200 indicates a shift in market sentiment, making it challenging to predict Bitcoin's future performance. Waiting for more stable market conditions before considering any investment is essential.
2. Risk Management: Bitcoin's volatility demands a proactive risk management approach. Holding off on investing allows you to assess the market's response to this decline, identify potential support levels, and determine a suitable entry point with reduced risk.
3. Diversification: Instead of solely focusing on Bitcoin, consider diversifying your investment portfolio across various asset classes. This strategy can help mitigate risks associated with any single investment, including cryptocurrencies.
Conclusion:
As a cautious trader, evaluating the risks and rewards associated with Bitcoin's current decline below SMA 200 is crucial. The volatility and uncertainty surrounding this cryptocurrency make it prudent to hold off on investing until the market stabilizes. By exercising restraint and considering alternative investment options, you can better protect your capital and make informed decisions in the ever-evolving world of cryptocurrency.
Remember, patience and careful analysis are essential when navigating the complex and unpredictable nature of Bitcoin and other cryptocurrencies.
Concerned? BTC Support Levels at WMA 200 and Basic DMA 200BTC Support Levels at WMA 200 and Basic DMA 200: A Concerned Trader's Perspective
Introduction:
As the cryptocurrency market continues to captivate investors worldwide, staying informed about the latest developments and trends is crucial. This article will explore Bitcoin's support levels at the Weighted Moving Average (WMA) 200 and the primary Daily Moving Average (DMA) 200. It is essential to approach this analysis cautiously and be aware of potential short-term price drops. As a concerned trader, I urge you to consider the implications of these support levels and take appropriate action to safeguard your investments.
Understanding BTC Support Levels:
Support levels play a vital role in technical analysis, as they indicate a price level where buying pressure is expected to outweigh selling pressure, potentially leading to a price rebound. The WMA 200, currently at $28,424, and the basic DMA 200, at $27,282, are two critical support levels for Bitcoin.
The WMA 200 is a weighted average emphasizing recent price data, providing a more accurate representation of the current market sentiment. On the other hand, the basic DMA 200 considers an equal weightage of price data over the past 200 trading days, offering a broader perspective.
Concerns Regarding Short-Term Price Drops:
While Bitcoin has demonstrated impressive growth over the years, it is crucial to acknowledge the inherent volatility of the cryptocurrency market. Recent price drops have raised concerns among traders, emphasizing the need for caution—the support levels at WMA 200 and basic DMA 200 serve as potential indicators of short-term price drops.
Call-to-Action: Shorting BTC for Short-Term Price Drops
Given the current market conditions and the support levels at WMA 200 and basic DMA 200, it is prudent to consider shorting Bitcoin during short-term price drops. Shorting involves selling borrowed assets to repurchase them at a lower price, profiting from the price decline.
However, it is essential to approach shorting with a comprehensive understanding of the risks involved. The cryptocurrency market is highly volatile, and sudden price movements can occur, resulting in potential losses. Therefore, it is crucial to exercise caution and seek advice from experienced traders or financial advisors before shortening BTC.
Conclusion:
As a concerned trader, I feel compelled to highlight the significance of BTC support levels at WMA 200 and basic DMA 200. These levels can provide valuable insights into potential short-term price drops. However, it is essential to remember that the cryptocurrency market is inherently unpredictable, and risks are involved in any trading strategy.
If you decide to short BTC during short-term price drops, ensure you clearly understand the risks involved and seek professional advice. Stay informed, stay cautious, and make well-informed decisions to safeguard your investments in this dynamic and ever-evolving market.
Bitcoin (BTC) formed bullish Gartley for another price reversalHi dear friends, hope you are well and welcome to the new trade setup of Bitcoin (BTC)
Recently we caught a nice trade of BTC as below:
Now on a 2-hr time frame, BTC has formed a bullish Gartley for the next bullish reversal.
Note: Above idea is for educational purpose only. It is advised to diversify and strictly follow the stop loss, and don't get stuck with trade.
Wyckoff Reaccumulation BTCScenario of Events for Wyckoff Reaccumulation for BTC
In the analysis of cryptocurrency price movements, particularly for Bitcoin (BTC), a well-known methodological approach called Wyckoff Reaccumulation is utilized. This approach is based on the work of Richard Wyckoff, who extensively studied market patterns and price changes in stock markets.
Phases of Wyckoff Reaccumulation:
Accumulation: In this initial phase, the market demonstrates reduced trading activity, sometimes accompanied by price declines. This may indicate a lack of interest from the majority of investors. However, significant players such as institutional investors may actively accumulate assets during this period.
Stabilization (Markup): At this stage, the beginning of price growth and increased trading activity is observed. This may indicate a shift in market participant sentiments. The growth occurs gradually, and this is a period when the market starts showing signs of a positive trend revival.
Reaccumulation: During this phase, a decrease in volatility is observed, and prices move within a certain range. This could indicate the accumulation of assets by larger players, similar to the first phase but at higher price levels. This period can last for a while, preparing the ground for further upward movement.
Strengthening the Trend (Mark-up): In this phase, the market is characterized by price increases and heightened trading activity. This could signal a resurgence of the positive trend and the development of new higher price levels.
Conclusion:
The scenario of events for Wyckoff Reaccumulation for BTC may involve certain phases observed in the market. It is based on the idea that the market goes through cyclic phases of asset accumulation and distribution. It's important to understand that this is purely an analytical approach and does not guarantee future price movements. Trading on cryptocurrency markets is always associated with risks, so conducting your own research and consulting with experts before making decisions is essential.
BTC MACRO UPDATEBTC has recorded a bullish breakout from the Falling Wedge pattern. As a result, we temporarily moved above the psychological key level of $30,000 USD and even achieved a higher high for the first time in this correction phase with the daily close.
Today at 4:00 AM, we observed a bounce at the planned support level. Currently, we are in the process of forming a higher low, which could indicate a potential bullish trend reversal.
Since I was not in the trade at 4:00 AM, I intend to now capitalize on the retracement to enter at a higher low.
On a macro level, it's becoming interesting.
When we look at the Super Macro Range of the last bull run, we are currently at the value area low (VAL) of this significant range. Should BTC continue to hold this position, I see substantial potential for further bullish movement. 📈
If we manage to break out bullishly from the Rising Wedge, I can envision the following movement:
It remains exciting to see how things will develop!
Buy Bitcoin when RSI>50 and Ascending Triangles Form!
I wanted to reach out today with an exciting opportunity to gain traction in the market. It's time to consider longing for Bitcoin when the Relative Strength Index (RSI) surpasses 50, and ascending triangles start forming.
Why is this important, you may ask? Well, let me break it down for you in simple terms. When the RSI crosses the 50 thresholds, it indicates that Bitcoin's price is gaining momentum and entering a bullish phase. This can be an excellent entry point for traders looking to take advantage of potential price increases.
But that's not all! When ascending triangles begin to form, it suggests a period of consolidation before a potential breakout to the upside. This pattern often signals a bullish continuation, making it an ideal time to consider going long on Bitcoin.
I know what you're thinking: "How can I take advantage of this opportunity?" Well, fear not, my fellow trader! Here's a simple call to action for you:
1. Conduct thorough technical analysis: Pay close attention to Bitcoin's price movements, RSI, and the formation of ascending triangles. This will help you identify the optimal entry point for your long position.
2. Set your buy order: Once you've determined the right moment, set your buy order at a suitable level. Remember to consider your risk tolerance and set appropriate stop-loss and take-profit levels.
3. Monitor the market: Closely on Bitcoin's price action and any significant developments. This will allow you to make informed decisions and adjust your strategy accordingly.
4. Stay updated: Continuously educate yourself about the latest trends and indicators in the cryptocurrency market. This will help you refine your trading skills and stay ahead of the curve.
Remember, trading can be exciting and rewarding, especially when you seize opportunities like these. So, why not consider longing Bitcoin when the RSI exceeds 50 and ascending triangles start forming?
I hope this information is valuable and contributes to your trading success. If you have any questions or need further assistance, please comment below. Let's make the most of this exciting opportunity together!
BTC - 🌤️ Trading Conditions; Slightly Bullish Day Ahead? Bitcoin is facing sun in the next 24 hours, signaling a slightly bullish market with upside potential , according to ATTMO, an AI-powered and weather-inspired tool.
In the coming week, Bitcoin can expect a mix of sunny and cloudy conditions, possibly hinting at a slightly bearish market trend and potential downtrend.
Follow us for more crypto weather reports!
Bitcoin Trading Alert - BTC below MA 50 and RSI at 50As an avid participant in the cryptocurrency market, I wanted to bring your attention to a recent development in the Bitcoin (BTC) market that requires caution and careful consideration. This idea aims to inform you about the current state of BTC, which has fallen below its 50-day Moving Average (MA) and is accompanied by a Relative Strength Index (RSI) of 50.
In recent trading sessions, Bitcoin has experienced a decline that has pushed its price below the crucial MA 50 level. The MA 50 is widely regarded as a significant indicator of market sentiment and trend direction, as it reflects the average price of an asset over the past 50 days. This breach below the MA 50 suggests a potential shift in the market sentiment towards a bearish outlook.
Furthermore, the RSI, a technical indicator used to measure the strength and speed of price movements, is currently hovering at the 50 level. An RSI of 50 indicates a neutral position where the buying and selling pressures are relatively balanced. However, when combined with BTC's status below the MA 50, it reinforces the need for caution and careful evaluation of market conditions.
Given these circumstances, I encourage you to exercise prudence and hold off on any Bitcoin market orders until further clarity emerges. It is crucial to thoroughly analyze the market dynamics, consider additional indicators, and monitor the price action before making any trading decisions. Remember, patience and a well-informed approach are essential to successful trading.
As the cryptocurrency market is known for its volatility and unpredictability, it is essential to remain vigilant and adapt to changing market conditions. We can mitigate potential risks and make more informed trading decisions by staying informed and exercising caution.
This is a cautious advisory and does not constitute financial advice. It is always recommended to consult with a qualified financial advisor or conduct thorough research before making investment decisions.
Exciting Development in BTCUSDT! 🚀Breaking free from a falling wedge pattern, BTCUSDT is showing strong potential. Despite moderate volume, the recent close above the falling wedge is a promising sign. Keep a close watch as this breakout could mark the start of a bullish trend. Stay informed and trade wisely! 📈💹
Breaking News: BTC Less Volatile Than S&P 500 and GoldBrace yourselves, my friends, because Bitcoin (BTC) has done the unthinkable – it's now less volatile than the mighty S&P 500 and the shiny gold!
Yes, you read that right. The once-infamous wild child of the financial world has tamed its rebellious nature and emerged as a stable force to be reckoned with. It's time to challenge your preconceived notions about BTC and consider it a viable asset for those who value stability.
You might be wondering, "How on earth did this happen?" Well, let me enlighten you. Recent market data has revealed that BTC's volatility has dropped significantly, outshining the traditional stalwarts like the S&P 500 and gold. It's like witnessing a cosmic shift in the trading universe!
I know what you're thinking: "Why should I care about this? How does it affect me?" Well, my dear traders, this revelation opens up a new world of possibilities for your investment strategies. If volatility is a concern that keeps you up at night, BTC has just become your knight in shining armor.
So, here's my call to action for you: Take a moment to reconsider your portfolio and give BTC a well-deserved spot. By diversifying with Bitcoin, you not only embrace the future of finance but also gain exposure to an asset that has proven its resilience and maturity.
Think about it. In a world where the markets can be as unpredictable as a rollercoaster ride, having an asset shed its notorious volatility is like discovering a hidden oasis in the desert. It's a chance to navigate the tumultuous waves of the financial world with newfound confidence.
Don't let your fear of volatility hold you back from exploring the potential of BTC. Embrace the unexpected, challenge the status quo, and join the ranks of visionary traders setting sail toward a more stable and prosperous future.
Remember, the winds of change are blowing, and BTC is leading the charge. Seize the opportunity, my friends, and let Bitcoin be your guiding star in this ever-evolving trading universe.
BTC Update ✔Hello dear Traders. Hope you are having a great weekend. This is my thoughts on how BTC is
going to move. I think market makers are going to hit the stops of people who have longed in this range ( around 29K ) and then recovering fast into the range and going to break the range to
the upside.
What are your thoughts?
Comment down below. ❤
Bitcoin's Remarkably Tight Range Bound Since July 24
As a trader, you are likely aware that Bitcoin's price fluctuations have historically been a source of great excitement and profit potential. However, the current market conditions have led to a lack of significant movement, which may leave some traders uncertain or even frustrated. While it is essential to acknowledge and adapt to the prevailing market dynamics, exploring potential future scenarios and their implications for your trading strategies is equally important.
Considering the tight range bound, it would be interesting to hear your perspective on Bitcoin's future trajectory. Do you believe this stagnant phase will persist, or are you anticipating a breakout shortly? Sharing your insights and discussing with fellow traders can provide valuable perspectives and help navigate the market more effectively.
I encourage you to take a moment to reflect on your trading approach during this period of limited volatility. Are there alternative investment opportunities you are exploring or strategies you are considering to adapt to the current market conditions? Sharing your thoughts and experiences can contribute to a more comprehensive understanding of the situation and potentially uncover new possibilities.
Feel free to respond to comments and contact fellow community traders to exchange ideas and opinions. Together, we can navigate the market's twists and turns while adapting our strategies to optimize our trading outcomes.
BTC UPDATE IN THREE-HOURS TIMEFRAME.BTC has recently achieved a significant breakout above the falling wedge pattern in the three-hour timeframe, raising questions about potential bullish momentum in the market. However, despite this development, caution is warranted in confirming a bullish trend. Notably, BTC has been consolidating within a narrow range between FWB:29K to $29.7k for the past six days, without a major price movement.
In addition to the falling wedge pattern, a symmetrical pattern has also emerged, adding complexity to the current scenario. Despite the breakout in the falling wedge, it is crucial to acknowledge that BTC is now at the resistance zone of the symmetrical triangle.
While positive movements may be on the horizon, it is imperative for BTC to maintain its position and avoid breaking below the FWB:29K support level.
Monitoring BTC's price action closely is advised, as this will provide valuable insights into the market's direction and potential further developments.
Wishing you informed decision-making and successful trading.
Best regards,
Team Dexter
bitcoin long setuphello Traders, here is the full analysis for this pair, let me know in the comment section below if you have any questions, the entry will be taken only if all rules of the strategies will be satisfied. I suggest you keep this pair on your watchlist and see if the rules of your strategy are satisfied. Please also refer to the Important Risk Notice linked below.
The price of Bitcoin is currently forming a bullish falling wedge pattern, and we are very close to a breakout! Trade it properly.
We can see that the price broke out of the strong horizontal line (at 29500), but the bears are weak and they are not able to continue in the downtrend. What is now likely is that the bulls are going to push the price back above the line and pump bitcoin to 32K
Cautious Approach to Bitcoin Trading Amidst Bearish SignalsBitcoin's price remains bearish, lingering below the MA 50 and MA 200 indicators, indicating a continued downward trend. This suggests that the market sentiment is currently tilted towards selling pressure rather than buying opportunities.
Furthermore, the Slow K indicator is falling, signaling a potential weakening of bullish momentum. It is essential to be mindful of this decline, as it may indicate a lack of substantial buying support in the market.
In addition, the MACD (Moving Average Convergence Divergence) indicator appears to be barely profitable, reflecting a marginal difference between the short-term and long-term moving averages. This further emphasizes the need for caution, implying that the market lacks bullish solid conviction.
Considering these factors, it is prudent for traders to pause and reassess their buying strategies regarding Bitcoin. While the cryptocurrency market is known for its volatility and unpredictable nature, it is essential to prioritize risk management and avoid impulsive decisions during times of uncertainty.
As traders, we must remember that patience and a well-informed approach are essential to long-term success. It is crucial to thoroughly analyze market trends, monitor indicators, and seek insights from trusted sources before making investment decisions.
In conclusion, I encourage you to exercise caution and step back from buying Bitcoin until we witness more favorable market conditions. By adopting a prudent approach, we can better protect our capital and position ourselves for potential opportunities that may arise in the future.
BTC Price Indicators Signal a Bearish OutlookAs we analyze the technical indicators, it becomes evident that the current sentiment remains bearish, urging us to exercise patience and wait for more favorable conditions.
Firstly, it is worth noting that the Slow D indicator has recently turned negative. This indicator, known for its ability to identify trend reversals, suggests that the prevailing downtrend in BTC may persist for some time. When combined with other hands, remaining vigilant and avoiding hasty decisions becomes even more crucial.
Additionally, while still bearish, the Moving Average Convergence Divergence (MACD) indicator adds to the concerns surrounding BTC's price performance. This indicator, often used to identify potential buying or selling opportunities, suggests continuing the downward trend. It is essential to consider this bearish signal and proceed with caution.
Furthermore, the BTC price is below the Simple Moving Average (SMA) of 200. This long-term moving average is widely regarded as a significant level of support or resistance. The fact that BTC is trading below this level further emphasizes the bearish pressure in the market.
Given these indicators and the overall market sentiment, I strongly encourage you to exercise patience and wait for more positive signals before making significant trading decisions. While the crypto market is known for its volatility, it is crucial to prioritize risk management and avoid impulsive actions during uncertain times.
In conclusion, the BTC price indicators, including the negative Slow D, bearish MACD, and BTC below SMA 200, collectively suggest a cautious approach. It is prudent to wait for more favorable conditions before initiating substantial trades. Remember, successful trading requires seizing opportunities and avoiding unnecessary risks.
Let's wait for BTC indicators to turn positive before making significant trading decisions. Exercise caution and prioritize risk management. Our team supports you and provides guidance during these uncertain times. Stay tuned for further updates.