BTC TP#3 Unknown Turning point 3 maybe consolidated before a breakout.
Due to key support around 3.7k most probably price would bounce up if reached.
Three channels of upward support line mentioned on chart. Dotted lines (upward Trend) are major support.
All info is simple and mentioned on chart. Hope you easily get it/
Remember panic is dangerous and being greedy is worst.
Happy Trading :)
Good Luck.
Btctrend

BTC Trend Update 10/04BTC halted its steady uptrend and decreased by 6% in 4 hours, however it has not yet passed the value of 6800$ which was a resistance until April 6th, when BTC broke it.
It will probably be tested as a support over the following hours.
By looking at both RSI and MACD, it seems like both graphs are preparing for a bearish trend.
This decrease could be similar to the one observed between March 27th and March 30th, which led to a decrease around 15% over a time period of just four days.
Even if that'd be the case, I think BTC will get back to its uptrend pretty soon, considering the sentiment around the market and the predictions about what's going to happen getting closer to the halving. What's your opinion?

BTC Trend Update 06/04The trend is upward and BTC has managed to break the previous resistance around $7000.
Even if its value would decrease again over the next few days, there seems to be a robust support around $6800, as BTC's value has been slightly fluctuacting around it since the beginning of the month.
Taking a look to MACD index, its pattern is showing a similar behaviour with the one pre-COVID rush out of markets.

BTC - Short Term ViewGreetings!
I couldn't find a better moment for a short description of my market view than this one, when the market is flat, if you want to see the whole picture take a look at my previous ideas.
Things are simpler than we think, there is a cryptocurrency market in a digital world and we see that the whole world is shaking before something we call a crisis.
Once the the Fiat Currency System will start shaking too, lots of investors will take a seat at the cryptocurrency table.
Notice That: Everything happens with a reason, mine is to be right in the decesions that I make.
This is not a trading advice!!
Take Care,
St.Gex

BTC Trend AnalysisI identified a pattern repetition between the current situation and the market behaviour from February 18th to February 27th.
The market showed a downtrend in the mentioned period, divided in the following steps:
1) it started with a steep decrease in value of approximately 10% , bringing BTC value from 10300 USD to 9400 USD in one day;
2) then the value rose back to 10000 USD, meaning a 7% growth , in 4 days;
3) in the last stage there was a fall back, with BTC value dropping to 8600 USD in 3 days, a 14% decrease .
In the current scenario, we saw a drop in the value from 8200 USD on March 10th to 4800 USD on March 13th ( ~ 50% decrease ), followed by a recover to 6500 USD by March 21st ( ~ 40% increase ). The development appears to be more extended over time, since the duration of each stage is being approximately doubled.
If the trend would be consistent with the previous one and the percentages would be proportionate, this last increase could be followed by a decrease of approximately 70% in BTC value, leading to a drop close to 3000 USD in the next weeks.
What do you think?


Soon to be the highlight of the BTC ?How about you? Are you long or short? Which side are we gonna break on with the halving that's coming up next?

BTC > LONG & Short termHello there, as you can see the chart above, the Btc's move seems to be pretty obvious, follow the line.
This is not a trading advice!
St.Gex

BTC- Short timeframeThis is a continuation of my first ever post minutes ago.. this are my targets.. my resistances at red and the bullish support at black where i will be rethinking on my bearish sentiment if that line doesnt get break down in the short-mid term.. in the end im thinking simple as i always try to do so in trading ... if my short time frame resistances dont break in short term like the 8.9k and 9ishk i belive we will get pushed down to that channel of 7.8k - 8.7k again and confirming my theory that the bearish market is still a few months away of ending .. Simple strategy 8.9k - 9k resistance if btc cant pass from this shortly we mostly will se a down movement to 8.4k or 8.5k and after that 8.7k becomes resistance and the stair pattern like this to the previous low of 7.4k where i think we will break down with capitulation fase of bear market to 5k-4.5k and start the new steady and rising bull market .. Please comment your opinions good or bad about this .. it can be TA opinions or fundamental oppositve or in favour i just want to discuss this view with others.

BTC must stay above 200 Daily SMA to hold rally.BTC has finally broken our downtrend channel resistance. Could be a mix of a short squeeze and also Bullish news from China that has caused this rally. Will that be enough to make a reversal from our downtrend channel?
As of right now BTC is holding above 200 Daily SMA(red) which is a good sign but we can't seem to breach our 100 SMA(orange). Even if we break our 100 SMA to the upside, we still face resistance from 10.5k to 9.6k (red rectangle area).
We need 200 SMA to be support and not resistance for this rally to continue.
1 Monthly Chart
If we take a look at our Monthly, it doesn't quite show a downtrend but rather a triangle. We held above our 50 SMA(green) and that's where we made our bottom and prices are holding above our EMA's(yellow/purple). We shall see what next month's candle brings us to have a better idea of where we're going. If we make a bounce here we could go as far as 11-12k to test our pink dotted trendline resistance. But there's a good possibility that if we go for a downtrend that we can revisit the bottom of our pink dotted support line sitting anywhere from 4-5k. But where we go from our current prices, I do not know. Just have to wait for next month's candle

Bitcoin is the most Fascinating phenomena Today’s rise is really remarkable 35% in one day. WOW
BTC still the best performing asset in the history of human kind.
We have been consolidating for 31 days without any clear direction, what happened next was a retest of bear power who tried to bring the price down and failed.
Remember, trading is a constant war between the two sides (bears and bulls) and the chart is a record of their battles. This is how I look at the chart and it helps me a LOT! Always think about what the enemy is doing, what move would make sense, which side is showing weakness. This will improve your trading.
Bulls are showing power now, I am going with a trend. Don’t have a specific target, but I am longing this one.

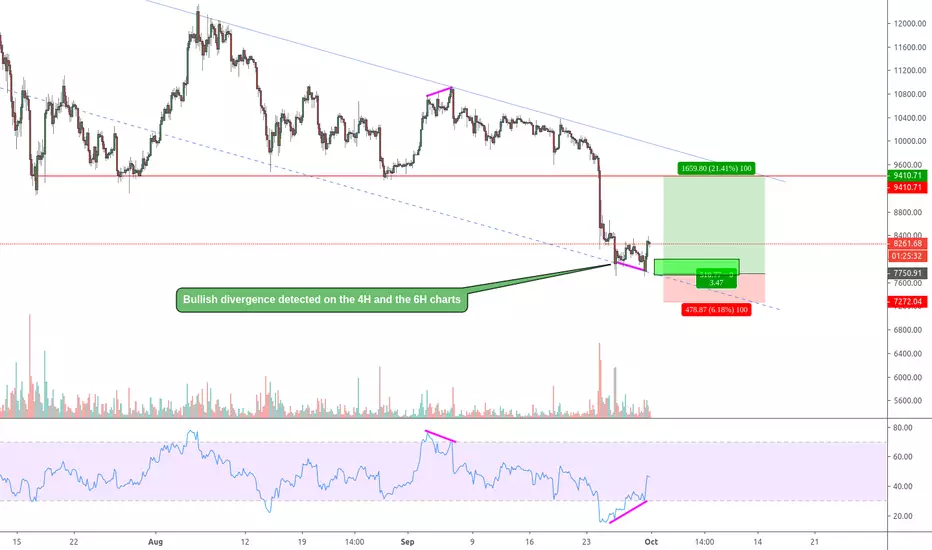
BITCOIN : BREAKING - Bulldivergence detected on 4H and 6H chartsIf you didn't read my educational content, you can do it here first: How to making LOT of MONEY - Hunting Divergence
So again: bullish divergence formed in the last 6-7 days.
4 hour chart divergence here:
6 hour chart divergence here:
6 hour chart divergence is a very rare and strong indication of short term trend reversal!
This 4H RSI(20) could be a potential already happened breakout and after this a little pullback enought for me to opening a short term higher margin LONG position:
CONCLUSION
Before entering a trade:
CRITERIA 2/1) : I want to see a higher low after a little pullback or triple bottoming the dotted line.
CRITERIAL 2/2 : This pink line on RSI(20) must to stay valid.
If you liked this article:
* FOLLOW ME ON TWITTER
* FOLLOW ME ON TRADINGVIEW
* SUBSCRIBE TO MY FREE NEWSLETTER
And you can support me via this signup link if you are looking for the better bitmex: Bybit registration as better BITMEX .
6000 still healthy + bull trend maintained?what you guys think ABC correction inbound or we still looking bullish?

BTC LAST try to LONG inside the triangle?Opened a long at 10.040$
Stop in the red area.
Divergences inside the 1H channel, RSI breakout.
MFI oversold, divergence on every oscillator.
Falling wedge is bullish pattern!
And finnaly potential bullflag forming on minute chart.

BTC, Short from 9.5Eur to 9.1Eur, 2 daysexit at 9.5 and buy at 9.1-9.2. Possible short position on the way.
#surfthetrend #trendsurfer

BTCEUR, Line Break View, Thinking TimeIt is Possible an inversions del trend? I will want but I don't think that is possible now. What do you think about it?
