BTC/USDT 1H: Bullish Breakout Retest – Targeting $89K?BTC/USDT 1H: Bullish Breakout Retest – Targeting GETTEX:89K ?
🚀 Follow me on TradingView if you respect our charts! 📈 Daily updates!
Current Market Structure (Confidence Level: 8/10):
Bullish trend confirmed after breaking the Fair Value Gap (FVG) at $83,200.
RSI shows strong momentum, with a bullish divergence from recent lows, supporting further upside.
Smart Money Analysis:
Accumulation phase evident between $77K - $78K, confirming institutional positioning.
Multiple bullish order blocks formed, reinforcing higher-low structure.
RSI confirms institutional buying pressure, with momentum favoring continuation.
Trade Setup:
Entry: $83,200 - $83,400 (current retest of breakout).
Targets:
T1: $86,400 (previous high).
T2: $89,000 (major resistance).
Stop Loss: $82,000 (below recent swing low).
Risk Score:
7/10 – Favorable risk-to-reward, but market volatility must be considered.
Key Levels:
Support: $82,000, $80,500.
Resistance: $86,400, $89,000.
Market Maker Activity:
Currently engineering a liquidity grab above $84K, likely before a continued move higher.
Volume profile supports bullish continuation, with Smart Money positioning for another leg up.
Recommendation:
Long positions remain favorable on the $83,200 - $83,400 retest.
Watch for price reaction at $84K, as liquidity may be grabbed before a strong move to targets.
🚀 Follow me on TradingView if you respect our charts! 📈 Daily updates!
Btcusdbuy

Cold thinking on Bitcoin's "pullback moment"This morning, Bitcoin prices fluctuated again, falling below the $77,000 mark and currently fluctuating around $80,000. The market seems to have entered the "pullback moment" again. Faced with price fluctuations, I believe many friends are thinking about the same question:
Is it "getting off the train to avoid risks" or "entering the market at a low point" now?
This question seems simple, but it is actually complicated. Especially in the cryptocurrency market, short-term fluctuations are drastic, and various information noises are intertwined, which can easily make people lose their way. When we are in the "pullback moment", we need a calm thinking, and we should take our eyes off the price fluctuations in front of us and put them into the larger "trend" and "cycle" framework to examine.
Let's take a closer look at what a trend is and what a cycle is.
1. What are trends and cycles?
To understand any market, we should first distinguish between the two key concepts of "trend" and "cycle", and the crypto market is no exception.
Trend: Trend is the long-term direction of the development of things and a grand and lasting force. It represents the most essential and core trend of things, just like a surging river, once formed, it is difficult to reverse.
Cycle: The cycle is the short-term fluctuation in the development of things, and it is the rhythmic change of swinging around the trend line.
Simply put, the cycle is in the trend. However, simple inclusion is not enough to express the complex relationship between them. If the "trend" is compared to the trunk of a tree, the "cycle" is like the rings on the trunk.
When 96% of the world's population does not yet hold Bitcoin, when sovereign funds begin to include crypto assets in their balance sheets, and when blockchain technology becomes a new battlefield for the game between major powers - this galloping "digital ark" has just sailed out of the dock where it was built. COINBASE:BTCUSD BITSTAMP:BTCUSD BYBIT:BTCUSDT.P PEPPERSTONE:XAUUSD BINANCE:BTCUSDT

BTC/USD (1D) Technical Analysis – March 10, 2025Today, the lowest bitcoin 79201, the highest 84088, the current sharp decline, short-term consideration to buy around 79000, to 81500 sold
BTCUSD Buy @79000-79500
tp: 81500-82000
Traders, if you liked this idea or if you have your own opinion about it, write in the comments. I will be glad
If you also aspire to achieve financial freedom,Follow the link below to get my daily strategy updates

BTCUSD short trading, expected profit 3000-5000BTCUSD is now planning to trade short, with big non-farm data and the Fed meeting, and expected profits of 3000-5000
Buy: 88800, 89300,90500
TP: 87800, 87300, 86200, 83800
SL: 89800
Trading is risky, control your position reasonably.
The market is changing rapidly, please leave me a message for accurate profit signals for buying and selling.
Recently, I have made an in-depth analysis of the BTCUSD and XAUUSD signal recommendations, which can be regarded as the key to making profits in this complex market. I don't know how many traders have achieved this goal. Although I can't make you all make profits like me, the only thing I can do is to give you a road to success. I can't force you to hold your hand, but I think those who can walk on my road must be much stronger than their own road without direction and full of bumps. The trading market is a battle of real money and silver. Everyone wants to win, but you have never considered whether your strength and experience team meets the conditions for victory. Follow me and witness the future together
BINANCE:BTCUSDT BINANCE:BTCUSDT

Tips to make a profit of 5000+ on BTCUSDShort-term accurate signal analysis shows support near 76300. The current price rebounded to a maximum of 82000, with a profit margin of 5000+. The current price has rebounded to a maximum of 82,000, and the profit margin has reached 5,000+. There is no chance or luck in the transaction, and only strength can lead to victory.
If you don’t know when to buy or sell, please pay close attention to the real-time signal release of the trading center or leave me a message, so that you can quickly realize the joy of profit. COINBASE:BTCUSD BITSTAMP:BTCUSD BYBIT:BTCUSDT.P BINANCE:BTCUSDT

BTCToday's strategyShort - term Trend
Recently, the price of Bitcoin has been fluctuating significantly. On March 11, it rebounded from the oversold area but struggled to rise when facing the resistance level. If the bulls can continue to exert force and break through the current resistance level of $80,375.59, it may further climb to $84,119.82. If it fails to break through, it may decline again and even fall below the key support level of $76,605.75.
Long - term Trend
From a long - term perspective, since its inception, Bitcoin has generally shown an upward - trending price, despite experiencing several significant pullbacks on the way. Some financial institutions and experts are also optimistic about the long - term value of Bitcoin. For example, Standard Chartered Bank predicts that Bitcoin could reach $500,000 by 2028.
Market Sentiment and Capital Flow Analysis
Market Sentiment
Investors' attitudes towards Bitcoin are divided. On one hand, companies like MicroStrategy continue to increase their Bitcoin purchases, demonstrating the firm confidence of some investors in its long - term value. On the other hand, the market's sharp fluctuations have also made some investors worried and cautious, remaining on the sidelines.
Yesterday, I bought near 79,000, and then the lowest fell near 76500, and then increased the position at 77000, and now sell at 81500, waiting for the next buy point
BTCUSD sell @81500-82000
tp: 78000-78500
BTCUSD Buy @77500-78000
tp: 81500-82000
Traders, if you liked this idea or if you have your own opinion about it, write in the comments. I will be glad
If you also aspire to achieve financial freedom,Follow the link below to get my daily strategy updates

Heikin Ashi Trade IdeaCOINBASE:BTCUSD
In this video, I’ll be sharing my analysis of BTCUSD, using my unique Heikin Ashi strategy. I’ll walk you through the reasoning behind my trade setup and highlight key areas where I’m anticipating potential opportunities.
I’m always happy to receive any feedback.
Like, share and comment! ❤️
Thank you for watching my videos! 🙏

Bitcoin BTC - Bottom Or The Bear Market? [READ CAREFULLY!]Hello, Skyrexians!
Let's update our BINANCE:BTCUSDT idea. Last time we told you that this is the bottom when price was at $80k previous time. Yesterday we posted a mind at $78k that "Don't panic, this is the bottom". Today we have the update on this crypto to give you the thoughts what can really happen next.
Let's take a look at the daily timeframe. We have shown you already the 5 Elliott wave cycle with two red dots on our Bullish/Bearish Reversal Bar Indicator . After that correction has been started. Now it looks like that price has finished the ABC zigzag and ready for the reversal. VERY IMPORTANT: price shall form the bullish bar and green dot on indicator on the daily close. We are still in danger, but if it will happen, it's going to be the strong long signal inside the Fibonacci 0.5-0.61 zone. After that the next impulse is going to happen.
P.S. On 4h and lower time frames picture is beautiful!
Best regards,
Skyrexio Team
___________________________________________________________
Please, boost this article and subscribe our page if you like analysis!

Btcusd bullish mode Bearish Disruption to This Bullish Outlook
1. Lower High & Breakdown Structure (Bearish Bias)
The chart shows a clear lower high formation, indicating the market is in a downtrend cycle.
Price has already broken previous support and is retesting lower levels, which may act as resistance now, making the bullish path less likely without significant momentum.
2. Weak Rejection from Demand Zone (Bearish Warning)
The first bounce from the demand zone (around $78,000) is weak and lacks follow-through buying pressure.
This could mean buyers are not committed, increasing risk of demand zone failure and further drop toward $74,000-$72,000 levels.
3. Volume Analysis (Lack of Buyers)
Notice how the volume on the latest bounce is weak, showing no significant accumulation. For a strong rally to $90k+, we'd expect climactic buying volume—which is absent here.
Weak volume near critical zones often precedes false breakouts or deeper dives.
4. Possible Bear Flag or Continuation Pattern
Current consolidation between $78k-$80k may form a bearish continuation pattern (bear flag).
A break below $78k could trigger a sell-off targeting $75,000-$72,000.
5. Macro-Level Resistance Above
Even if BTC pushes up temporarily to the first supply zone around $83,000, heavy resistance and profit-taking likely happen there.
Without macro bullish news, sustained push to $90k+ is questionable in this current technical context.
Alternative Bearish Scenario Path (Disruption Path):
Break below $78,000 confirms sellers in control.
Targets:
First Target: $75,000
Second Target: $72,000-$70,000 (psychological support & previous demand area

BTC New Low 68,000 $ BTC as per my view going till 68,000 $ then its going up side , on this chart i m goiving my thought , its take bit time .

BTCUSD latest important newsThe U.S. government recently announced that it will not sell nearly 200,000 Bitcoins obtained from the Silk Road case. Instead, these holdings will be included in the strategic reserve.
The decision eased concerns about a potential large-scale sell-off that could add further pressure to the market. Meanwhile, large investors, often referred to as “whales,” continue to accumulate Bitcoin despite the market’s continued volatility.
Some market observers believe this may be a sign of confidence in the asset’s long-term potential. However, the continued volatility shows that uncertainty remains a key factor in the current crypto landscape. COINBASE:BTCUSD COINBASE:BTCUSD BINANCE:BTCUSDT BYBIT:BTCUSDT.P

Crypto Markets See $3.8 Billion Outflow, What Does It Mean?Ethereum, Solana, and Toncoin were hit with multi-million outflows; but Bitcoin took the biggest hit with $2.59 billion in funding.
For the third week in a row, digital asset investment products have seen investors siphon off funds. This past week alone marked a historic $2.9 billion outflow, raising the cumulative figure to $3.8 billion in three weeks.
According to the latest edition of the Digital Asset Fund Flows Weekly Report, Bitcoin was hit the hardest by negative sentiment, suffering $2.59 billion in outflows last week, while short coin products attracted $2.3 million in inflows. Ethereum also faced heavy losses and received a record $300 million in outflows.
Toncoin was not immune, with investors siphoning off $22.6 million. Meanwhile, multi-asset products experienced $7.9 million in outflows, while Solana and Cardano saw outflows of $7.4 million and $1.2 million, respectively. Even blockchain stocks fell, losing $25.3 million.
Sui, on the other hand, saw inflows of $15.5 million, followed by XRP, which received $5 million, while Litecoin added $1 million in inflows.
Over the past week, outflows were broad, with the United States leading with $2.87 billion, followed by Switzerland with $73 million and Canada with $16.9 million. Sweden also recorded $14.5 million in outflows, while Brazil and Hong Kong saw $2.6 million and $2.5 million, respectively.
In contrast, Germany trended with $55.3 million in inflows as investors bought into the trend. Australia also recorded a modest inflow of $1 million. BITSTAMP:BTCUSD COINBASE:BTCUSD BYBIT:BTCUSDT.P BINANCE:BTCUSDT CRYPTO:ETHUSD

El Salvador Increases Bitcoin Reserves Despite IMF RestrictionsDespite IMF restrictions, El Salvador Bitcoin Investment continues to grow and expand, demonstrating President Nayib Bukele’s current strong commitment to cryptocurrency policy. At the time of writing, the Central American country has managed to increase its Bitcoin holdings to 6,111.18 BTC, worth approximately $504 million in current markets, while also engaging in complex relationships with various major international financial institutions.
El Salvador’s government has persisted and even accelerated its Bitcoin accumulation strategy despite an agreement with the International Monetary Fund, which has significantly restricted its cryptocurrency activities. The December 2022 deal, which was established after lengthy negotiations, involves a $1.4 billion loan as part of a broader financial package of more than $3.5 billion. ]
At the time of writing, El Salvador Bitcoin Investment has catalyzed and spearheaded an increase from 6,072 BTC in February to 6,111.18 BTC in March 2025. This strategic acquisition, such as it is, demonstrates the government’s unwavering resolve to maintain and optimize its cryptocurrency policy despite external pressure from various major financial institutions as well as a number of key regulators that have implemented several restrictions in the current market environment. BITSTAMP:BTCUSD COINBASE:BTCUSD BYBIT:BTCUSDT.P BINANCE:BTCUSDT

Bitcoin crash to $80K is normal, not the start of a major declinData confirms that the latest Bitcoin crash may be the result of a natural correction, rather than the start of a major downtrend.
Bitcoin has once again fallen below $80,000 for the second time this year, sparking investor panic. As fear spreads, many are questioning whether this drop marks the end of the Bitcoin bull run or if it is just a natural correction in the ongoing uptrend. The decline in peak losses shows Bitcoin in a natural correction; in recent analysis, even though Bitcoin has revisited the $80K range, the extent of realized losses is still significantly lower than previous corrections.
While CRYPTOCAP:BTC has revisited the $8.0K range, peak losses are still significantly lower than the late February to early March correction.
Total peak losses:
February 25: $933M
February 26: $897M
February 28: $933M
BITSTAMP:BTCUSD BINANCE:BTCUSDT COINBASE:BTCUSD BYBIT:BTCUSDT.P

Bitcoin (BTC/USDT) Analysis: Bullish Reversal from Key Support ZBitcoin (BTC/USDT) Price Analysis – 1H Chart
Key Observations:
Bullish Reversal Setup:
The price is currently in a key demand zone (red support area).
A potential double-bottom formation is forming, suggesting a possible bullish reversal.
Support & Resistance Zones:
Support: $80,680 - $82,500 (Marked in red)
Resistance: $90,000 - $92,000 (Marked in red)
Potential Move:
The chart suggests a buy setup, with a target towards $88,800+.
The expected move aligns with a retracement to the previous resistance zone.
Confirmation Needed:
A break above $84,000 could confirm the uptrend.
If BTC falls below $80,680, the bullish scenario is invalidated.
Conclusion:
Bias: Bullish reversal expected if support holds.
Entry Zone: $80,680 - $82,500
Target: $88,800 - $90,000
Invalidation: Below $80,680

btc long idea due to fvga strategic long position on Bitcoin (BTC) at $78,000, following a Fair Value Gap (FVG) that forms at $76,000. This gap suggests a potential price inefficiency, which you believe could trigger a bullish move in BTC’s price. The setup implies that the price will fill the gap and push higher. To manage risk, you’ve set a stop loss at $75,000, providing a clear level for potential exit in case the market moves against your position. Your target for this trade is $96,000, where you expect significant resistance or a strong price movement to materialize. Overall, the trade offers a solid risk-reward setup with the expectation of capturing gains as Bitcoin rallies from the FVG level.

This is the underlying trend ...
As you know, the market has a law of its own: Buy Low (when others are fearful), Sell High (when others are greedy)
Technical Section:
The calm before the storm ($82500)
* Medium Term:
BTC is completing the first wave of the fifth wave of a five-wave rally (5).
*Long Term:
BTC is completing the fifth wave of the third wave of a five-wave rally 5.
We will see.

BTCUSD MORE BUY BREAKING NEWS BTC ALL TIME HIGH 100K SOON1. Overly Aggressive Upside Projection
The projection to 97,450 implies a nearly 19% move up from the current level (81,693) without clear intermediate confirmations. This may overlook key lower resistance areas (such as the previous support at ~86,000–88,000) that could act as barriers before a move to 97,000. A step-by-step approach would be more reasonable.
2. Neglecting Bearish Continuation Risk
The analysis focuses heavily on bullish recovery and seems to ignore the ongoing bearish trend in the last several days. If BTC fails to hold the 80,133 "bullish support area", there could be continuation to the downside toward 78,000 or even 75,000 based on prior breakdown levels. No contingency is shown in case the support fails.
3. Volume Mismatch
Notice the recent volume spikes are seen on down candles, suggesting strong selling interest. There's no confirmation of buying volume accumulation to support such an aggressive reversal. Ignoring this discrepancy can lead to a false sense of bullish momentum.
4. Broad Market Context Missing
The chart does not seem to factor in broader macroeconomic or crypto-specific news. Given the U.S. economy's impact (as suggested by the USD sign and U.S. flag symbols), interest rate decisions, CPI data, or regulatory news can disrupt any bullish narrative.
5. Overconfidence in Single Zone
The "Support bullish area 80.133" is treated as a final reversal point. In reality, markets often fake out below such key zones before reversing (a "stop hunt"). A more realistic analysis would outline alternative supports below 80k and conservative resistance targets.
Alternative Bearish Scenario (Counter Analysis)
1. Break below 80,133 triggers continuation toward 78,000 and 75,000.
2. Any bounce toward 84,000 or 86,000 could be rejected if volume does not support it.
3. Resistance between 86,000 and 88,000 should be observed for weakness if reached.
4. Lower highs and lower lows forming suggest continuation down unless broken

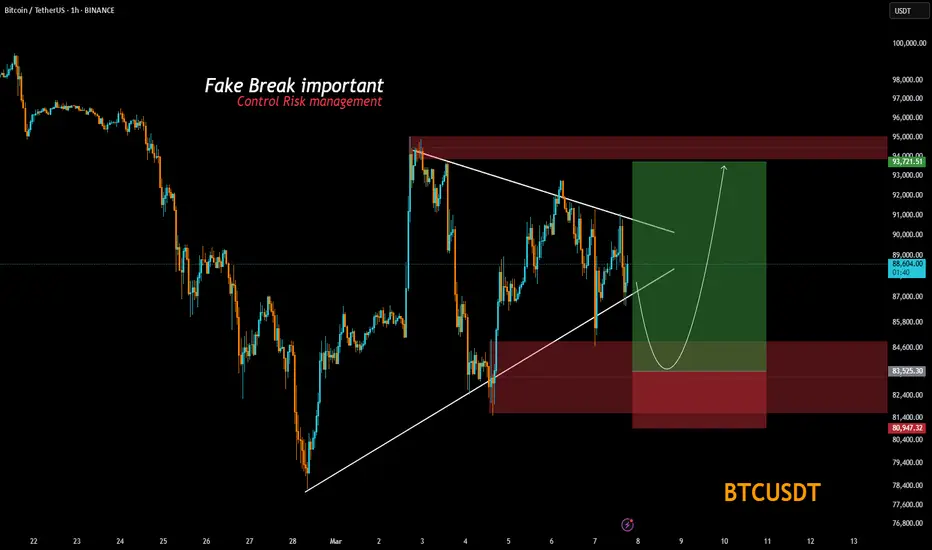
BTCThe price hit the previous high before falling, in my opinion this blue trend break is fake and the price will hit a new high after small corrections.

Will BTC reach 80,000 or 90,000? 10,000-point trading signalBTCUSD analysis and observation, 88600, 89800, 90500 are short-term resistance, and 86500, 86000, 84200 below are support. If this structure is broken, the market will enter the next stage.
BTCUSD 91000 trading opportunity has been opened, and tonight will usher in a 5000-10000 point fluctuation range
Trading is risky, positions should be reasonably controlled, when the opportunity comes, if you don’t know when to enter the market, want to get accurate transactions and huge profits in advance, please leave me a message, I will make you feel t COINBASE:BTCUSD INDEX:BTCUSD BITSTAMP:BTCUSD BINANCE:BTCUSDT hat this is true.

Trading opportunities tonight have started at 91000Despite recent market concerns, whales continue to withdraw BTC from exchanges.
Volatility in crypto markets continued as the broader market saw 24-hour liquidations of over $500 million, with long liquidations accounting for $400 million.
The source of the US strategic reserve is the confiscated Bitcoin. The market has been prepared for this and it is not lower than expected. In the long run, it will have a great impact. BINANCE:BTCUSDT INDEX:BTCUSD BITSTAMP:BTCUSD COINBASE:BTCUSD

The market's big swing trading signal has appeared! ! ! ! !Recently, the XAUUSD and BTCUSD trading signals shared have been profitable and profitable, which is obvious to all. Especially in BTC trading, the expected fluctuations are thousands of points. Of course, this has been confirmed by the market for several times.
Today, everyone should be prepared in advance. Trading opportunities with fluctuations of thousands of points may reappear. Because the most watched non-agricultural data is released once a month, plus the cryptocurrency summit, the currency reserve bill and the Federal Reserve meeting. These major events will cause drastic fluctuations in the currency market. Of course, this time will be an opportunity for ordinary traders to turn over. When the opportunity comes, if you don’t know when to enter the market and want to get this accurate transaction in advance and make huge profits, please leave me a message. I will show you that this is true. BINANCE:BTCUSDT COINBASE:BTCUSD BITSTAMP:BTCUSD INDEX:BTCUSD OANDA:XAUUSD TVC:GOLD

Trump established a Bitcoin reserve, but why did Bitcoin plummetOn March 7, Bitcoin plunged in the short term, falling below $85,000 during the session. Then it quickly rose again. More than 150,000 people were liquidated in the past 12 hours, with a liquidation amount of $540 million.
On the news, the White House cryptocurrency director said that US President Trump has signed an executive order to establish a strategic Bitcoin reserve. The strategic reserve will be capitalized by about 200,000 bitcoins owned by the federal government, and the government will not purchase additional assets for the reserve except for assets acquired through asset confiscation procedures. This is different from what the currency circle expected. Previously, the market expected the Trump administration to buy cryptocurrencies, but now it seems to be just "storage", which disappoints people.
The market is waiting for the upcoming White House cryptocurrency summit, during which Trump is expected to announce more details of the crypto reserve. On Thursday local time, US President Trump signed an executive order to establish a strategic Bitcoin reserve, the day before he met with cryptocurrency industry executives at the White House.
Sachs wrote that the order authorizes the Treasury and Commerce secretaries to develop "budget-neutral strategies" to acquire more Bitcoin, provided that it does not increase costs to American taxpayers. Sachs said that no taxpayer money would be spent to buy cryptocurrencies, so the price of Bitcoin and other tokens fell.
People at the White House cryptocurrency summit on Friday expected the event to be the stage for Trump to formally announce plans to establish a strategic reserve containing Bitcoin and four other cryptocurrencies. BINANCE:BTCUSDT COINBASE:BTCUSD BITSTAMP:BTCUSD ICMARKETS:XAUUSD
