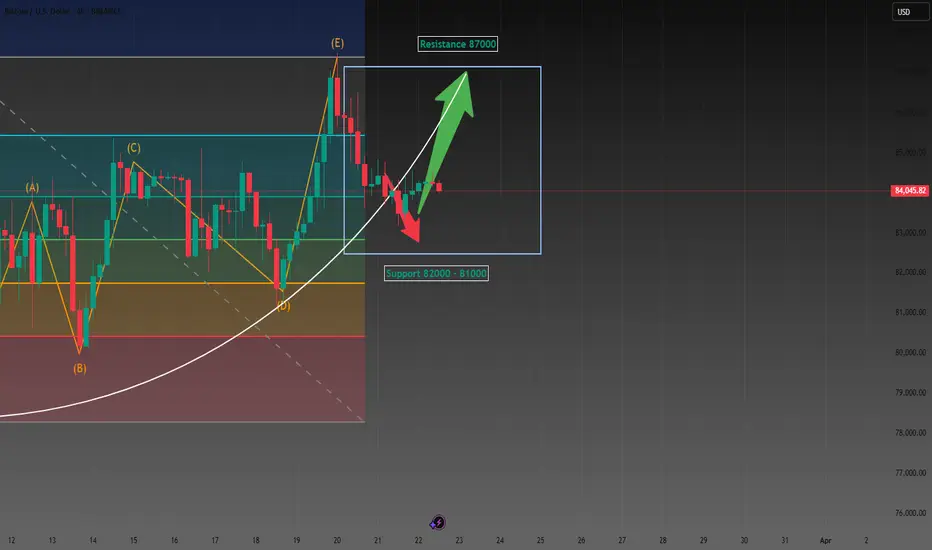
Continue to wait for BTC to break through 89,000Currently, Bitcoin is in a strong upward trend. It has soared directly from a sideways movement at 84,000 to the resistance zone near 89,000.
If BTC maintains a stable sideways movement between 87,000 and 88,000, the bulls can gradually accumulate upward momentum. Once ready, BTC will undoubtedly break through 89,000.
💎💎💎 BTCUSD 💎💎💎
🎁 Buy@85500 - 86000
🎁 TP 87000 88000 89000
The market has been extremely volatile lately. If you can't figure out the market's direction, you'll only be a cash dispenser for others. If you also want to succeed,Follow the link below to get my daily strategy updates
Btcusdbuy

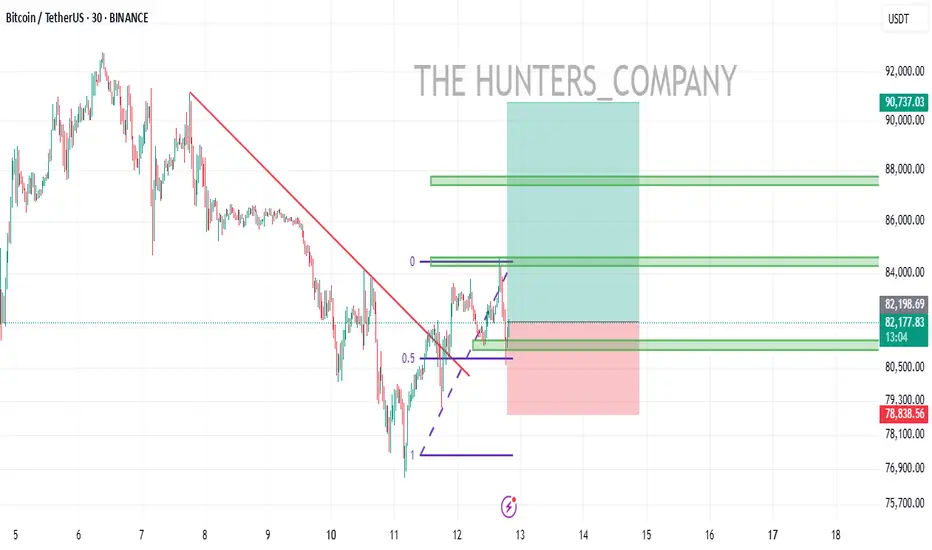
BTCUSD:Wait for a rebound before going shortThe fluctuations are not big now, judging from the structure of the 30M icon. The probability of rebounding and then falling later is relatively high. My trading idea is to wait for the rebound to go short. The short orders entered near 88K yesterday are now generally profitable. They can be closed first and then entered after the rebound to prevent the price from rising directly.
Losing profits is a trivial matter, but turning from profit to loss would be very uneconomical.

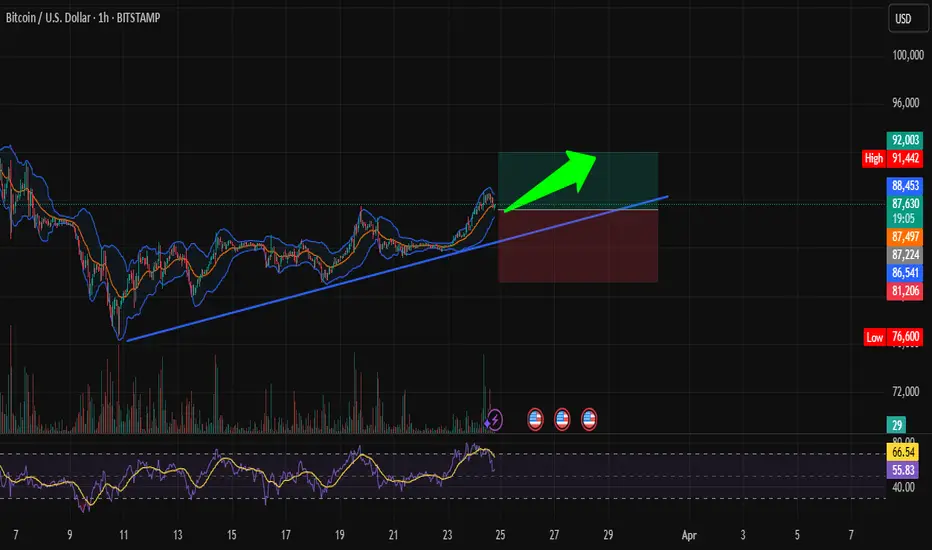
BTC READY TO EXPLODE? POTENTIAL 1H ENTRY!Hi traders! , Analyzing Bitcoin on the 1H timeframe, spotting a potential entry :
🔹 Entry: 87,509 USD
🔹 TP: 92,003 USD
🔹 SL: 81,206 USD
BTC is respecting the trendline and maintaining its bullish momentum. If this support holds, we could see a continuation toward 92K. RSI is overbought, but price action remains strong.
⚠️DISCLAIMER: This is not financial advice. Trade responsibly.
Position Open in BTC! Ready for TakeoffHi Traders ! Bitcoin has reached a key support zone, where it has historically shown bullish reactions. Additionally, the RSI at oversold levels (21.66) reinforces the possibility of an imminent rebound.
🔥 I have already entered long, expecting a bullish move toward the $85,500 - $86,000 zone, with a possible extension to $89,000 - $90,000 if it breaks the descending resistance.
📈 Key Factors to Watch:
✅ Confirmation of the bounce at support.
✅ Increase in buying volume.
✅ Break above the 20-period EMA.
Let’s see how this plays out! What are your thoughts? 🔥
⚠️ Disclaimer: This is not financial advice. I am simply sharing my analysis and personal trade. Always do your own research before trading!

Explanation Why Bitcoin BTC Bull Run Is not Over YetHello, Skyrexians!
Time to update BINANCE:BTCUSDT huge analysis. Market became bigger and it needs more rime to form bull and bear stages. Now everyone is waiting for the bear market because it was every time, but this time it will be tricky for retailers.
Let's take a look at the 2 week time frame. If we apply our Fractal Trend Detector to this chart we can see that Bitcoin is still in the green zone and now is inside the huge support area. If it will be held we will see the following Elliott waves scenario where wave 3 will reach at least $144k. Awesome Oscillator also gives us a hint that it's still not over. The entire bull market will be finished only in the middle of 2026.
Best regards,
Skyrexio Team
___________________________________________________________
Please, boost this article and subscribe our page if you like analysis!

BTC/USDTHello friends
After a heavy fall, now with the trend line broken and the ceiling and floor higher after creating a pullback, you can enter the capital with capital management.
*Trade safely with us*
BTCHello friends
You can see that after the price fell in the specified support area, the price was supported by buyers and caused the resistance to break, and now, when the price returns to the specified ranges, you can buy in steps and move with it to the specified targets, of course, with capital and risk management...
*Trade safely with us*

JUST IN: Bitcoin Reclaims $88K, Eyes $100K Breakout!The Price of Bitcoin shocked sceptics surging nearly 4% today, reclaiming the FWB:88K pivot- now setting its coast for $100k breakout amidst a bullish symmetrical triangle Pattern.
On the daily time frame, CRYPTOCAP:BTC has formed 2 bullish candlesticks, should a third identical candlestick evolve, it will lead to a breakout of the ceiling of the symmetrical triangle formed- placing CRYPTOCAP:BTC in the $90,000 - $96,000 range. A break above this pivots would cement the the move to $100k and beyond.
Similarly, should the asset faced selling pressure into making it dip below the $81k range, a selling spree could emerged.
Bitcoin Price Live Data
The live Bitcoin price today is $88,452.78 USD with a 24-hour trading volume of $29,835,452,540 USD. Bitcoin is up 3.95% in the last 24 hours, with a live market cap of $1,755,025,651,822 USD. It has a circulating supply of 19,841,384 BTC coins and a max. supply of 21,000,000 BTC coins.

the price of BTC has gone upIn the recent analysis of the cryptocurrency market, I have continuously been optimistic about the price trend of BTC. Since the last analysis, the price of BTC has steadily climbed from around 84,000 to the current 85000, further verifying the previous upward expectations.
🎁 Buy@83500 - 84000
🎁 TP 86000 - 87000
The market has been extremely volatile lately. If you can't figure out the market's direction, you'll only be a cash dispenser for others. If you also want to succeed,Follow the link below to get my daily strategy updates

BTC encountered strong resistance 89000I made an analysis this morning. I said that if the price of Bitcoin breaks through the resistance level of 87,000, it's very likely to rise all the way to 88,000 in one go, and then it will encounter the resistance level at 89,000. Look, my analysis has been verified now. It has been proven that the resistance level at 89,000 is indeed effective.
At present, it's not advisable to engage in short - selling. Instead, one can consider taking long positions again at the support level.
💎💎💎 BTC 💎💎💎
🎁 Buy@85000 - 86000
🎁 TP 88000 - 89000
The market has been extremely volatile lately. If you can't figure out the market's direction, you'll only be a cash dispenser for others. If you also want to succeed,Follow the link below to get my daily strategy updates

BTC Today's analysisLast week, BTC was in a sideways oscillation around $84,000. The competition between bulls and bears was intense, and the market was filled with strong wait - and - see sentiment, constantly waiting for a clear direction. Yesterday, the price rose to $85,000, and today it reached the $87,000 resistance point analyzed previously.
Currently, the resistance at $87,000 is significant. A large number of sell orders have gathered, putting great pressure on the price and causing frequent fluctuations. There are two reasons for this resistance. First, investors who bought at high levels earlier are selling here to stop losses or lock in profits, increasing the selling pressure. Second, investors generally expect strong resistance at this price level, so they either sell or wait and see, exacerbating the resistance.
If BTC breaks through the $87,000 mark, there is a high chance of a new upward trend in the short term. Technically, the breakthrough will attract trend - followers to enter the market and push up the price. In terms of market sentiment, it can boost confidence and trigger chasing buying. Based on the current momentum and historical experience, the price may quickly rise to the range of $88,000 - $89,000. If it fails to break through, the price may retrace to the range of $85,000 - $86,000 to seek support and start a new consolidation to accumulate upward momentum. Therefore, it is crucial to closely monitor the breakthrough of the $87,000 resistance point in the following days, as it is of great significance for investment decisions.
💎💎💎 BTC 💎💎💎
🎁 Buy@85000 - 86000
🎁 TP 88000 - 89000
The market has been extremely volatile lately. If you can't figure out the market's direction, you'll only be a cash dispenser for others. If you also want to succeed,Follow the link below to get my daily strategy updates

BTC/USDTas shared earlier,the market remains bullish as long as it holds above the 50 EMA and weekly Trendline.

BTC Bull time a little correction to $86.5k or a bit lower is possible
and my prediction is BTC will rise afterwards
maybe to $88.9k
BINANCE:BTCUSDT
COINBASE:BTCUSD
𓄀𝓈𝓉𝒶𝓎 𝓉𝓊𝓃ℯ𝒹 𓃓

BTC 1HIt seems the dark days is going to take a break as moon is getting full and volume shows big cash got in !
predicted price has been shown !
BYBIT:BTCUSDT
THE MOON LOVES YOU !

Bitcoin (BTCUSD) Falling Wedge Breakout – Bullish Setup! 📌 Overview of the Chart Setup
This daily Bitcoin (BTC/USD) chart presents a technical breakout from a falling wedge pattern, a well-known bullish reversal signal. The price has been forming lower highs and lower lows over the past months, consolidating within a tightening structure. However, the current price action suggests an early breakout attempt, which could lead to significant upside movement in the coming weeks.
Let’s break down the key levels, technical insights, and trading opportunities visible in this chart.
📉 Chart Pattern: Falling Wedge (Bullish Reversal)
🔹 What is a Falling Wedge?
A falling wedge is a bullish continuation or reversal pattern characterized by converging downward-sloping trendlines. It typically signals a loss of bearish momentum, leading to a breakout to the upside.
🔹 Key Observations in the Chart
The price has been moving inside the falling wedge structure, with clear lower highs and lower lows.
The support level around $75,000-$80,000 has been repeatedly tested, forming a strong demand zone.
A trendline breakout has occurred, suggesting that bulls are regaining control over the price action.
Volume is expected to increase upon a confirmed breakout, reinforcing the bullish momentum.
📊 Important Technical Levels
1️⃣ Support & Resistance Zones
📌 Support Level: The $75,000-$80,000 zone has acted as a strong base, preventing further downside. Buyers have stepped in multiple times here.
📌 Resistance Level: The $95,000-$100,000 range represents a historical resistance where price has struggled to break through.
2️⃣ Trendline Breakout
The chart clearly shows a breakout above the falling wedge’s upper boundary, indicating a potential trend reversal from bearish to bullish.
If this breakout holds, Bitcoin could see strong buying pressure pushing it toward its next major resistance level.
📈 Trading Strategy & Setup
🔹 Entry Confirmation
To enter a long position, traders should wait for:
✅ A daily close above the wedge resistance (confirmed breakout).
✅ A successful retest of the breakout zone, which strengthens the bullish case.
A breakout retest is ideal because it provides a lower-risk entry point, ensuring the breakout is legitimate rather than a false move.
🔹 Target Price Projection
Using the height of the falling wedge as a projection, the potential price target is set at $118,000.
This level aligns with a 35%+ upside from the breakout zone.
Bitcoin must clear the $95,000-$100,000 resistance before reaching the final target.
🔹 Stop Loss Placement
A stop loss is positioned at $59,896, slightly below the previous major support zone.
This ensures that if the breakout fails, losses are minimized while still allowing price fluctuations within expected volatility.
🔹 Risk-to-Reward Ratio
Entry around breakout level (~$87,000)
Target: $118,000 (35% upside)
Stop Loss: $59,896 (~30% downside)
Risk-to-reward ratio: ~1:3, making this an attractive trade setup.
📢 Market Psychology & Sentiment
Why This Pattern Matters?
A falling wedge represents seller exhaustion. Over time, the bearish pressure weakens, leading to a bullish breakout.
If Bitcoin can maintain this breakout, momentum traders and institutional investors may step in, accelerating the rally.
Breaking above the resistance at $95K-$100K would confirm bullish dominance, potentially leading to new all-time highs.
Potential Risks
❌ Fake Breakout: If Bitcoin fails to hold above the wedge resistance, we may see a pullback to support before another breakout attempt.
❌ Macro Factors: External factors like regulatory news, interest rate decisions, and market-wide sentiment could impact price action.
❌ Bitcoin Dominance: If altcoins start rallying, some capital may rotate out of Bitcoin, slowing the upside move.
🚀 Final Thoughts: A High-Probability Bullish Setup
✅ The falling wedge breakout suggests a strong bullish shift, with a 35%+ potential upside.
✅ A confirmed breakout above $95K-$100K will act as a final confirmation before the next leg up.
✅ Risk is managed with a stop loss at $59,896, ensuring downside protection.
🔹 Best trading approach? Wait for confirmation, manage risk, and let the trend develop.
Would you like additional insights on entry techniques, volume confirmation, or potential invalidation points? 😊

BTC Today's analysisDuring the recent continuous and close tracking of the cryptocurrency market dynamics, I have always maintained an optimistic view on the price trend of BTC.
As it turns out, this prediction has been strongly validated by the market. Since the last market analysis, the price of BTC has shown a strong upward momentum, steadily climbing from an initial price of around 84,000 to the current remarkable 85,200.
💎💎💎 BTC 💎💎💎
🎁 Buy@83500 - 84000
🎁 TP 86000 - 87000
The market has been extremely volatile lately. If you can't figure out the market's direction, you'll only be a cash dispenser for others. If you also want to succeed,Follow the link below to get my daily strategy updates

BTCUSD BUY NEXT MOVE 1. Bearish Reversal Scenario:
Alternative Outlook: Instead of continuing upward to the next target, Bitcoin may fail to breach the resistance and reverse downward due to a potential "bull trap."
Trigger: A rejection at or near the double-top resistance around $88,000 could initiate a sell-off toward the trendline support near $85,000 or lower.
Bearish Volume Confirmation: If there is a significant bearish divergence on indicators like RSI or MACD, it could confirm the weakening bullish momentum.
2. Range-Bound Consolidation:
Alternative Setup: BTC might get stuck in a sideways consolidation range between $85,000 (support) and $88,000 (resistance), reflecting indecision in the market.
Trigger: This could be driven by mixed macro signals (like interest rate policies, crypto market sentiment) and lack of volume to push the price strongly in either direction.
3. False Breakout (Bull Trap):
Alternative Bearish Scenario: If BTC spikes slightly above the double-top resistance (around $88,000) but fails to hold the breakout level, it could trap late buyers and drop quickly.
Trigger: A false breakout pattern often occurs with low volume on the breakout attempt followed by a sharp reversal.
Potential Drop Target: BTC may then fall toward $83,000 or even retest $82,000 as deeper support

$BTC to the MoonFor BTC, we are still sticking to our "to the moon" analysis 🚀 hehehe. We remain in a trade with the following parameters:
Entry: 81,758
Stop Loss: 79,901
Target: 109,390
This is our trade operation, but we have also increased our hold position at this entry point, aiming for the very long term. Currently, our average price is 42,350.
What reinforces our analysis?
By analyzing the daily and H4 time frames, we can observe:
✅ Bullish continuation purges
✅ SMT (Smart Money Theory) confirming the movement
✅ A shift in the state of price delivery
With that in mind, I remain bullish, and may the moon be just the first target! Let's go, BTC! 🚀

BTC You'll regret it if you don'tBTC has been floating at 84000 today, yesterday it touched resistance at 87000, today's resistance is still valid, with the Fed's information, gold's rally has been full down, and more people will pay attention to BTC next
💎💎💎 BTC 💎💎💎
🎁 Buy@83500 - 84000
🎁 TP 86000 - 87000
The market has been extremely volatile lately. If you can't figure out the market's direction, you'll only be a cash dispenser for others. If you also want to succeed,Follow the link below to get my daily strategy updates

Bitcoin Market Analysis: Bullish OutlookCurrently, BTC price hovers around 84,000, showing a clear consolidation. In recent trading, bulls and bears are in a tight tussle at this price range.
Support Level Analysis
I peg the support at 81,000 - 82,000. Technically, this range is significant. Historical data indicates that as the price approaches this area, strong buying momentum emerges. During previous market corrections, this price band effectively halted sharp downward trends. Moreover, the concentrated distribution of holdings within this range implies that numerous investors have cost - bases here. Their unwillingness to see the price drop below their investment costs acts as a buffer, propping up the support.
Resistance Level Analysis
The resistance stays at 87,000. K - line trends reveal intense selling pressure when price approaches this mark. Multiple prior break - through attempts failed, with price retreating each time. This implies a large number of trapped or profit - taking positions at 87,000. As price nears, investors rush to sell, creating a strong resistance that curbs upward movement.
Bullish Reasons
Despite the current consolidation, I'm bullish. Economically, the global recovery boosts investors' risk appetite, drawing more to BTC as an innovative asset. Growing institutional interest, with BTC being added to portfolios, provides a solid price - rising base. Market sentiment is positive on Bitcoin's long - term prospects, buoyed by blockchain tech growth and wider applications. Technically, long - term indicators like the upward - diverging moving average show the long - term uptrend intact. Even with reduced trading volume during consolidation, market activity remains. New positive factors could easily break the current range and push price towards the resistance.
💎💎💎 BTC 💎💎💎
🎁 Buy@83500 - 84000
🎁 TP 86000 - 87000
The market has been extremely volatile lately. If you can't figure out the market's direction, you'll only be a cash dispenser for others. If you also want to succeed,Follow the link below to get my daily strategy updates

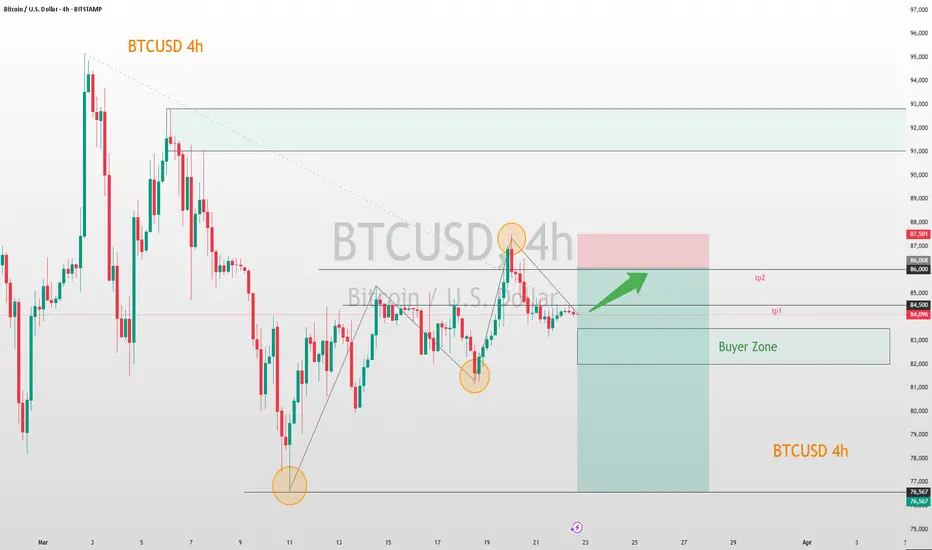
The momentum of BTC indicates its short-term potentialThe BTC/USD price is currently in a consolidation phase within a specific range.
Pay close attention to the 82,000 - 83,000 zone. Should the price retrace to this area and demonstrate signs of support, it could be a viable opportunity to initiate a small long position.
Set the target take - profit levels between 84,500 and 86,000. When the price reaches 84,500, it is advisable to consider partially closing the position to secure some profits. If it manages to break through this level, the subsequent target will be 86,000.
Considering the extreme volatility characteristic of the crypto market, prudent management of position size is of utmost importance. It's essential to refrain from overtrading to safeguard your investment capital.
BTCUSD
buy@82000-83500
tp:84500-86000
I will share trading signals every day. All the signals have been accurate for a whole month in a row. If you also need them, please click on the link below the article to obtain them.
BTC Buy SETUP for todayThis is a BTCUSD buy setup with ENTRY< STOP LOSS TAKE PROFITS LEVES for today 23 of March 2025

Let's always put our trust in BTC, mate.Bitcoin Market Analysis
BTC price hovers around 84,000 in consolidation. Bulls and bears battle at this price.
Support Level
Support is in 81,000 - 82,000. Strong buying emerges there. It stopped drops in past corrections. Dense holdings mean many cost - bases are in this range, propping up support.
Resistance Level
Resistance at 87,000. K - lines show heavy selling near it. Past break - throughs failed. Trapped or profit - taking positions sell as price nears, creating resistance.
Bullish Outlook
I'm bullish. Global recovery raises risk appetite for BTC. More institutions hold BTC, boosting price. Positive sentiment on long - term prospects, due to blockchain growth, helps. Upward - diverging moving averages show uptrend. Lower volume in consolidation, but activity stays. New positives may push price to resistance.
💎💎💎 BTC 💎💎💎
🎁 Buy@83500 - 84000
🎁 TP 86000 - 87000
The market has been extremely volatile lately. If you can't figure out the market's direction, you'll only be a cash dispenser for others. If you also want to succeed,Follow the link below to get my daily strategy updates
Why did BTC experience such minimal movement todayBTC has been floating at 84000 today, yesterday it touched resistance at 87000, today's resistance is still valid, with the Fed's information, gold's rally has been full down, and more people will pay attention to BTC next
💎💎💎 BTC 💎💎💎
🎁 Buy@83500 - 84000
🎁 TP 86000 - 87000
The market has been extremely volatile lately. If you can't figure out the market's direction, you'll only be a cash dispenser for others. If you also want to succeed,Follow the link below to get my daily strategy updates
