Tue 18th Mar 2025 BTC/USD Daily Forex Chart Buy SetupGood morning fellow traders. On my Daily Forex charts using the High Probability & Divergence trading methods from my books, I have identified a new trade setup this morning. As usual, you can read my notes on the chart for my thoughts on this setup. The trade being a BTC/USD Buy. Enjoy the day all. Cheers. Jim
Btcusdlong

BTC confirms correction increase at Daily!BTC confirms correction increase.
Watch for short-term buying to 94000 area
Absolute Stoploss point at 76400

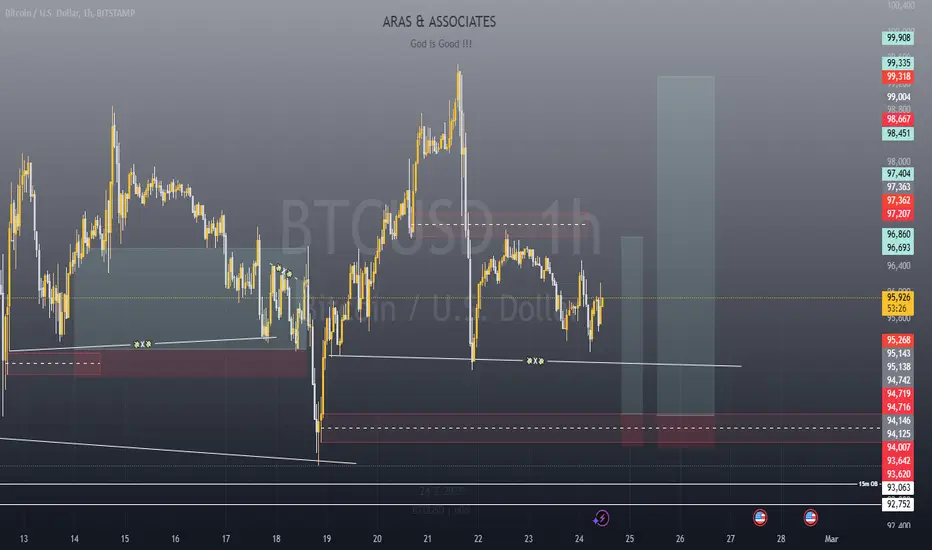
BITCOIN at Key Support – Ready to Bounce to $94,000?COINBASE:BTCUSD is trading at a key demand zone, which has previously acted as strong support within the ascending channel. The recent retracement has brought the price back into this area, increasing the probability of a bullish reaction. The confluence of the support zone and the ascending trendline suggests that buyers may step in to regain control.
If price confirms support within this zone, we could see a bullish continuation toward the $94,000 level, aligning with the channel’s midline and the next major resistance. However, a failure to hold this level could invalidate the bullish bias and signal a potential shift in momentum.
Traders should monitor for bullish confirmation signals, such as rejection wicks, bullish engulfing patterns, or increasing buying volume, before considering long positions. A breakout above minor resistance levels along the way could further strengthen the bullish outlook.
If you agree with this analysis or have additional insights, feel free to share your thoughts! 🚀

BTC: Pennant Pattern$BTC Bears have been in Complete Control & Regain the 18k Crucial Support..
According to pennant pattern , Bitcoin Might going to 11-12k Before break out.

BTCUSD MORE BUY BREAKING NEWS BTC ALL TIME HIGH 100K SOON1. Overly Aggressive Upside Projection
The projection to 97,450 implies a nearly 19% move up from the current level (81,693) without clear intermediate confirmations. This may overlook key lower resistance areas (such as the previous support at ~86,000–88,000) that could act as barriers before a move to 97,000. A step-by-step approach would be more reasonable.
2. Neglecting Bearish Continuation Risk
The analysis focuses heavily on bullish recovery and seems to ignore the ongoing bearish trend in the last several days. If BTC fails to hold the 80,133 "bullish support area", there could be continuation to the downside toward 78,000 or even 75,000 based on prior breakdown levels. No contingency is shown in case the support fails.
3. Volume Mismatch
Notice the recent volume spikes are seen on down candles, suggesting strong selling interest. There's no confirmation of buying volume accumulation to support such an aggressive reversal. Ignoring this discrepancy can lead to a false sense of bullish momentum.
4. Broad Market Context Missing
The chart does not seem to factor in broader macroeconomic or crypto-specific news. Given the U.S. economy's impact (as suggested by the USD sign and U.S. flag symbols), interest rate decisions, CPI data, or regulatory news can disrupt any bullish narrative.
5. Overconfidence in Single Zone
The "Support bullish area 80.133" is treated as a final reversal point. In reality, markets often fake out below such key zones before reversing (a "stop hunt"). A more realistic analysis would outline alternative supports below 80k and conservative resistance targets.
Alternative Bearish Scenario (Counter Analysis)
1. Break below 80,133 triggers continuation toward 78,000 and 75,000.
2. Any bounce toward 84,000 or 86,000 could be rejected if volume does not support it.
3. Resistance between 86,000 and 88,000 should be observed for weakness if reached.
4. Lower highs and lower lows forming suggest continuation down unless broken

BTC1! short idea with open gap fill and catching a quick longAs you might know, open gaps have a fill-rate of 90-95%. Additionally the open CME-gap (1W-basis) has much confluence with important technical levels for support and it lies in the middle of two zones where enormous amounts of USDT-inflows came into the market.
1. the 2024-range (Q1 - Q3)
2. the 2025-range (Q1 at least)
Where the new neckline also is, the new support that became resistance appeared. It might also be a good strike for smart money to know that above the biggest orderblock of 2024 support has developed more strength and consequence. So why you don't give it a try to retest it?
Here a maximum of buying pressure should lead to a strong bounce of BTCUSD towards a new alltime-high, if and as long as global liquidity rises again. But if not, at least inflation should do half of the bullish job for BTCUSD and a "sideways up" would be my - historically BIASed - expectation.
It begins with a shorter short. In the end it might be a very, very quick longer long because of my expectation of rising buying pressure with huge volume delta for the bulls below 78k.

BtcUsd is going to 120k/130k!What I see!
Looking for impulse up.
BtcUsd is going to 120k/130k after a bit more retracement. It might retrace to maximum 90k to 80k. It's important to have your own rules on RR and adhere to them. This trading idea is intended to assist you and enhance your knowledge. If you have any questions, please ask me in the comments.
Learn & Earn!
Wave Trader Pro

Mon 3rd Mar 2025 BTC/USD Daily Forex Chart Buy SetupGood morning fellow traders. On my Daily Forex charts using the High Probability & Divergence trading methods from my books, I have identified a new trade setup this morning. As usual, you can read my notes on the chart for my thoughts on this setup. The trade being a BTC/USD Buy. Enjoy the day all. Cheers. Jim

BTCUSD Bullish Breakout: Targeting 88,000 and BeyondBTCUSD Bullish Target Analysis
BTCUSD has successfully broken out of the **descending channel**, indicating a potential trend reversal to the upside. The price is currently retesting the 85,272 support zone, which aligns with a rounding bottom pattern—typically a bullish continuation signal.
If this support holds and buyers step in, BTCUSD could see upward momentum toward its next key resistance level. The first bullish target is 88,000, which aligns with the previous price structure. A strong breakout above 88,000 could push BTCUSD toward 89,500–90,000, where sellers may re-enter the market.
To confirm further bullish momentum, BTCUSD needs to maintain support above 85,000 and show increasing volume on the breakout. If it fails to hold this level, a potential retest of lower zones may occur before another push higher.
TARGETS 88,000 - 89,500 - 90,000
STOP LOSS 83,000

Bitcoin Dropped Below $80k: Will This Nightmare Will Be Stopped?Hello, Skyrexians!
Despite the extreme fear tonight BITSTAMP:BTCUSD continues going down and finally broke $80k. Investors are panic selling right now and don't know what to do. But we pointed out earlier that the most impulsive part of bull run ahead and current dump is just the correction.
Let's take a look at the weekly time frame. Here we can see that the potentially strongest reversal signal has been broken. We are talking about divergence with AO. That is the reason why we marked that waves 1 and 2 like you see on the chart. According to this counting we can see that wave's 3 targets are at the $140k and $190k. At the same time we wanna tell you that the strong resistance is located at 1 Fibonacci level at $110k and we have seen it already.
Current dump is wave 2 inside wave 3. It has the target between 0.5 and 0.61. The first one has been already reached. We expect reversal from here. Moreover Fractal Trend Detector is showing us bull run support with the green zone and now we see its retest.
Best regards,
Skyrexio Team
___________________________________________________________
Please, boost this article and subscribe our page if you like analysis!

BTC USDT Buy ZoneAs discussed earlier safe zone for BTC USDT LONG/BUY .
Handel with care maximum possiblility of testing 89000 area place order accordingly.
Happy Trading ..

BITCOIN at Major Support - Will Buyers Push Toward 98,250?COINBASE:BTCUSD has reached a significant support zone, highlighted by previous price reactions and strong buying interest. This area has historically acted as a key demand zone, increasing the likelihood of a bounce if buyers step in.
The current market structure suggests that if the price confirms support within this zone, we could see a bullish reversal. A successful rebound could push the pair toward the 98,250 level, a logical target based on past price behavior and structural confluence.
Just my take on support and resistance zones—not financial advice. Always confirm your setups and trade with solid risk management.
Best of luck!

Rinse & Repeat !!!Hello everyone, a happy new trading week to you all !.
This setup is particularly a short-term buy for those looking to take advantage of BTC's range that has been refusing to take a side.
A good RRR trade that's sure to make you a bit of money. Use proper risk and money management (risk what you're willing to not get bothered by) and most especially, do your own analysis for extra confluence !.
Fri 21st Feb 2025 BTC/USD Daily Forex Chart Buy SetupGood morning fellow traders. On my Daily Forex charts using the High Probability & Divergence trading methods from my books, I have identified a new trade setup this morning. As usual, you can read my notes on the chart for my thoughts on this setup. The trade being a BTC/USD Buy. Enjoy the day all. Cheers. Jim

BTCUSD - Centerline Profit-Target in reachIt's not that far anymore.
Price is trickling down it's path.
I could imagine that near the confluence point, where the 1/4 line and the red Centerline meet, the PTG could be fulfilled.
However, a crack of the red U-MLH would generate a signal for a pullback up to the white Centerline.

$BTC.D and $DXY are in diametrically opposite directionsIn this blog space we have been discussing Bitcoin Dominance ( CRYPTOCAP:BTC.D ) since Dec 2024. On 9th Feb 2025 I posted a blog where we discussed the Fib Retracement levels in CRYPTOCAP:BTC.D chart and we said that we can expect more upside and has broken past 0.618. I said it is possible that the dominance can reach the 0.786 Fib level at 66.12%.
I tried to plot the Dollar index TVC:DXY in the same weekly chart as CRYPTOCAP:BTC.D and it was quite surprising that the FIB retracement levels in CRYPTOCAP:BTC.D are the same as the top to the bottom levels in the TVC:DXY chart. We are looking at the last 5 years for our analysis.
When CRYPTOCAP:BTC.D has broken past 0.618 Fib level and trying to reach 0.786 @66.12%. But the TVC:DXY has broken below 0.786 and in the near term the TVC:DXY level can end up at 0.618 Fib levels which can take TVC:DXY to 104.
So, in the near to medium term is CRYPTOCAP:BTC.D @ 66.12% and TVC:DXY @ 104.

BTCUSDBTC/USD is showing a potential buy opportunity following a breakout of the downward trend on the 30-minute timeframe. This breakout signals a possible shift in momentum toward the upside.
Trade Setup:
🟢 Buy Entry: 96,000
🔴 Stop Loss: 94,900 (Below key support to manage risk)
Target Levels:
✅ Target 1: 97,100
✅ Target 2: 97,800
✅ Target 3: 98,500
Risk Management:
⚠️ Always use a stop loss to protect capital in case of unexpected reversals.
📊 Risk-to-reward should be at least 1:2 or 1:3 for optimal trade setups.
💰 Avoid overleveraging—proper position sizing ensures account sustainability.
👀 Monitor price action closely, and adjust stop-loss levels as the trade moves in profit.
If BTC/USD holds above 96,000, bullish momentum could drive prices toward the targets. However, patience and confirmation from price action are key before entering the trade.

BTC's next market trendHello traders
The price is consolidating between 100096 and 96700, indicating a potential upward move toward 100096. If the price breaks above this level with strong momentum and volume, it is likely to continue rising toward 102360, where it may enter the bullish zone. Further bullish movement could push the price toward 106961, where it might face stronger resistance. The ascending trendline and recent bullish attempts suggest that buyers are trying to gain control, supporting the bullish outlook.
If the price fails to break 100096 and reverses, it may retest the lower support at 96700. A confirmed bearish trend will start if the price drops below 96700 and exits the ascending channel, leading to further downside movement. In that case, possible support levels to watch are 93723 and 91579, where buyers might attempt to regain control.
Traders, if you find this analysis helpful or have your own insights, drop a comment below! I’d love to hear your thoughts.

BTC is setting up nicely for the weakend Btc is forming a descending triangle that i think will bounce here... but for how long... i see upside potential to just before 100k i think bears will front run 100k and 99,8xx is about the highest we see before we get a flush this weekend... i really believe we see 89k in the not too distant future.. but as i always say... you can only chart until the next move so i will wait for the rejection at 100k and reasses my thought and trade plan...
Always stick to your trade plan and follow best trading practices(why did you get into this trade, is your idea still valid, where are you cutting losses, where are you taking profits) all of these factors should be know at least to you before you enter the trade.
Capital preservation is always the #1 key to making money.... Stay Green

#btc #btcusd #elliottwave long buy setup wave 5of3 120k incomingThis count is based on my assumptions so anything can happen not a trading or financial advice just for educational purposes only kindly do your own ta thanks trade with care good luck.

#btc #btcusd #elliottwave long buy setup wave 5of5of3 1Feb25 TOPThis count is based on my assumptions so anything can happen not a trading or financial advice just for educational purposes only kindly do your own ta thanks trade with care good luck.


#btc #btcusd #elliottwave long buy setup wave 5 22Jan25This count is based on my assumptions so anything can happen not a trading or financial advice just for educational purposes only kindly do your own ta thanks trade with care good luck.

Bitcoin is breaking outlets upgrade what we were expecting about #Bitcoin , now after the fall to 89k as we expected its now breaking the resistance of the falling channel , and in my opinion we might see122k in near future
