BTCUSD Analysis is Ready BTC/USD 30-min chart shows a potential bounce from the support zone around 116,187.5, aiming for a bullish move toward the target at 121,640.6. Price may retrace before pushing upward.
Btcusdshort


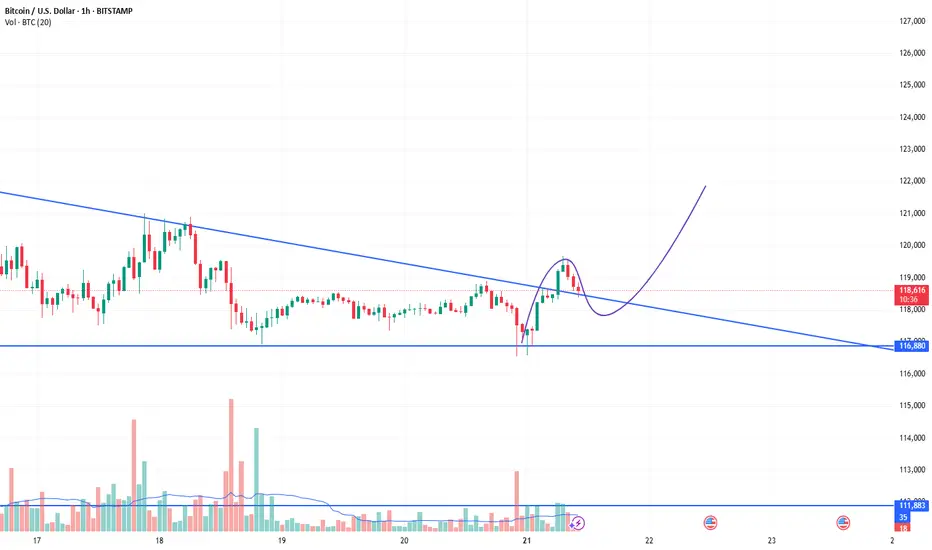
Btcusd:Huge trading opportunities and ideasBTCUSD's rebound after touching the position near 116180 this time is fast. From the trend observation. BTCUSD is still in a high consolidation stage. It has not broken the oscillation range for the time being. It can maintain selling near 120k. Buying near 11600 for range trading. It is expected that there will not be many trading opportunities in the London market. It will take until the New York market opens to see better trading opportunities.


BTCUSDBTCUSD also fell from a high level, reaching a high of around 119700, only 300 points away from the target of 120k. The price after the decline is now around 118600. Buying at a low level is the main focus. The reference buying point is 118500-118000. The target is above 120k. Stop loss 117300
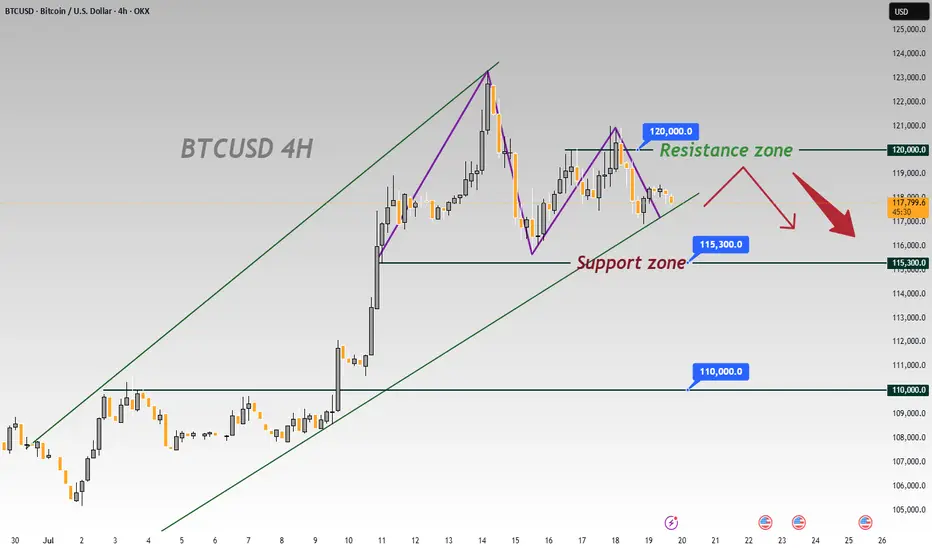
BTCUSD 4-Hour Chart Analysis: Range-Bound Trends & Key LevelsFrom the 4-hour chart of BTCUSD, the recent price movement shows obvious range-bound characteristics 📊. The upper zone around 120000 forms a key resistance level 🛑, where the bullish momentum has waned after encountering resistance 💨.
The lower level of 115300 is a significant support zone 🛡️. Previously, there was some buying support when the price retraced to this zone 👀. However, as the current price is pulling back from the resistance zone ↘️, if the bearish force takes the lead subsequently 🐻, the possibility of breaking below the 115300 support will increase ⬆️. Once it breaks below effectively 💥, the next key support level of 110000 will most likely become the target for the price to decline towards 🎯.
In terms of the short-term trend 📈, due to the obvious suppression from the resistance zone 🚧, the price will most likely continue the rhythm of testing the support downwards 🔽. In operation, one can pay attention to the breakdown situation of the support zone and layout trades accordingly 📝. Meanwhile, be alert to the possibility of a rebound after the price finds support in the support zone 🚀, and further confirmation of the direction needs to be combined with real-time K-line patterns 📊, trading volume 📈
🚀 Sell @119500 - 118500
🚀 TP 116500 - 115500
Accurate signals are updated every day 📈 If you encounter any problems during trading, these signals can serve as your reliable guide 🧭 Feel free to refer to them! I sincerely hope they'll be of great help to you 🌟 👇
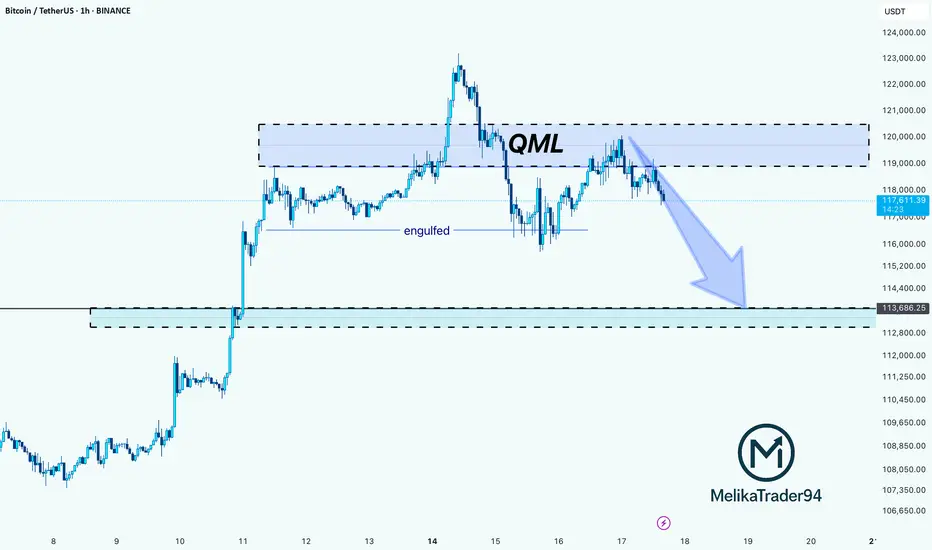
BTC Rejection from QML Zone: Towards on 113,600 SupportHello guys!
This chart shows a QML (Quasimodo Level) setup in play on Bitcoin. After price created a new high and engulfed the previous structure, it returned to the QML zone (around $119K–$121K) and reacted exactly as expected: strong rejection.
The sharp selloff from the QML area confirms a bearish shift in structure, and now the momentum is tilted to the downside.
The next key level to watch is the 113,600 demand zone, where the price may either bounce or consolidate.
As long as the price stays below the QML zone, bears have control.
You should consider that the main trend is bullish, and the stop loss may be hit, so please manage your risk!
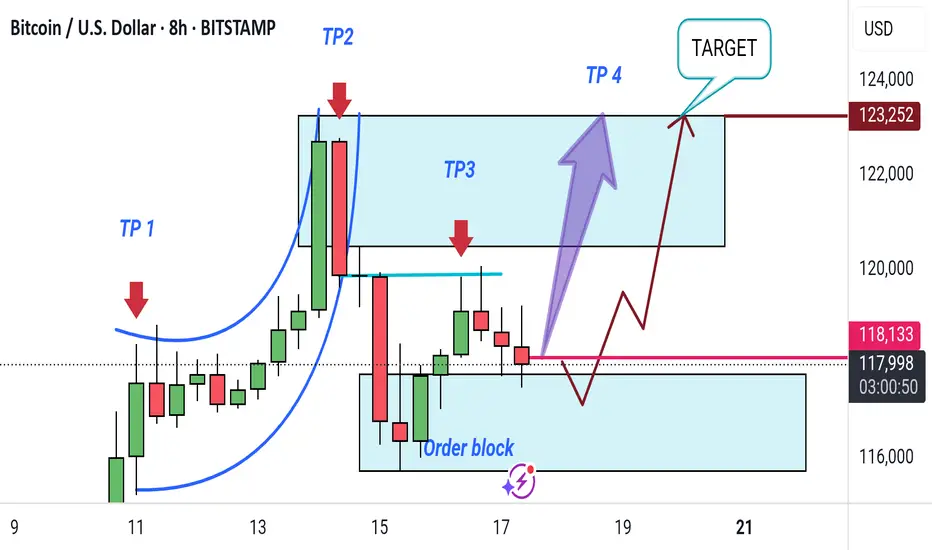
"Bitcoin Bullish Reversal Setup with Target Zones (8H Chart)"This 8-hour Bitcoin/USD chart shows a potential bullish setup. Key takeaways include:
Order Block: Identified support zone for possible reversal.
TP1 to TP4: Target points for profit-taking as price moves upward.
Target Zone: Final target area near $123,252.
Expected move: A short-term dip into the order block, followed by a rally toward the target zone.
BTCUSD - Exhausted? Second time rejected, now down.BTCUSD got rejected at the Centerline the second time. This is super bearish. If it's closing below yesterdays low, that's a clear short signal to me.
Taking 50% gains off the table is never bad. Because then you still have 50% if it's going up further. Otherwise, you got 50% booked.
Don't let gree eat your brain §8-)

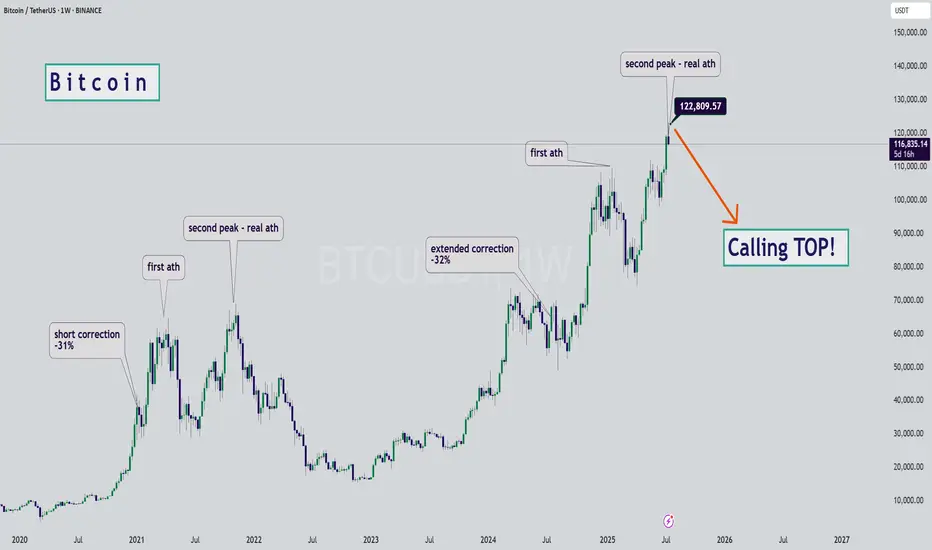
BTC - Calling the Start of the Bearish SeasonHello Watchers ☕
This was my previous Bitcoin update where I had a target of $116K, and also then closed all open positions at $122K:
I'm calling the top here mainly because of the way the chart looks, it really is classic Wyckoff if you look at the duration of the current bullish cycle, which has lasted a whole 973 Days with a 564% increase. What goes up, must come down!
Just for interest sake, the previous bullish cycle ran for 600 days with a 700% increase.


Bitcoin Prediction that will blow your mind (warning for bulls) I am showing you that BTC made new ATH only in the USD pair and not in other pairs like EUR, and why, and what you can anticipate and what to watch out for from #Bitcoin next.

(BTC/USDT) appears to be around $120,000.(BTC/USDT) appears to be around $120,000.
Here's a quick analysis of what the chart suggests:
Timeframe: 1D (Daily)
Current price: ~$111,150
Technical Indicators:
Ascending triangle breakout is indicated.
Ichimoku Cloud shows bullish momentum (price above the cloud).
The breakout is targeting a horizontal resistance zone around $120,000.
✅ Target Zone:
Target Point (based on breakout projection): $120,000 – $124,000
This target aligns with previous resistance levels and technical breakout patterns.
Let me know if you want a more detailed technical breakdown (e.g., support/resistance zones, volume analysis, RSI, etc.).

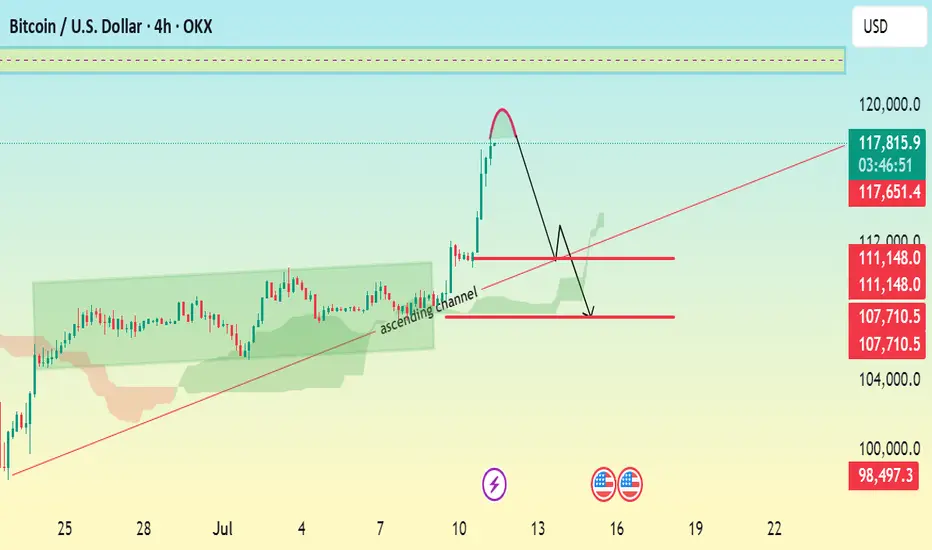
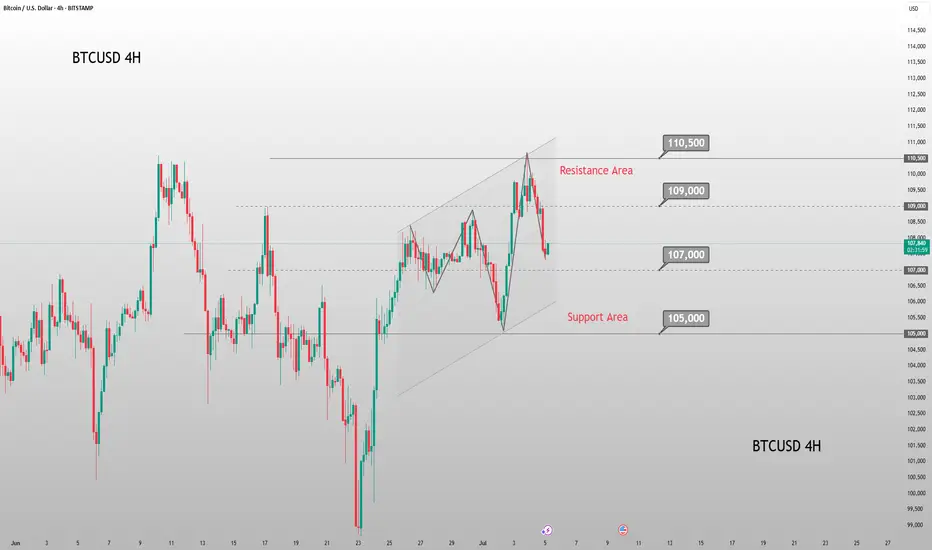
BTC/USD 4H CHART ANALYSIS \ BEARISH CORRECTION EXPECTED.Current Price: $117,755
Trend: Recently bullish, now facing a potential correction
Chart Pattern: Breakout above ascending channel, followed by a sharp projected correction.
🔍 Technical Breakdown:
> Ascending Channel:
Price was respecting an ascending channel (highlighted in green).
A bullish breakout occurred with strong momentum.
> Sharp Rejection & Correction Setup:
After the breakout, a steep rally seems to have peaked.
The red curved arrow suggests a completed bullish impulse, now setting up for a bearish correction.
> Key Levels:
Resistance Zone: $118,000 – $120,000
Immediate Support: $111,150
Next Major Support: $107,700
Bearish Target Support: $105,945
🎯 Trade Setup Suggestion:
Short Entry Zone: Around $111,150 if price gets rejected there.
Target: $105,945
Stop-Loss: Above $112,000 (tight risk control)
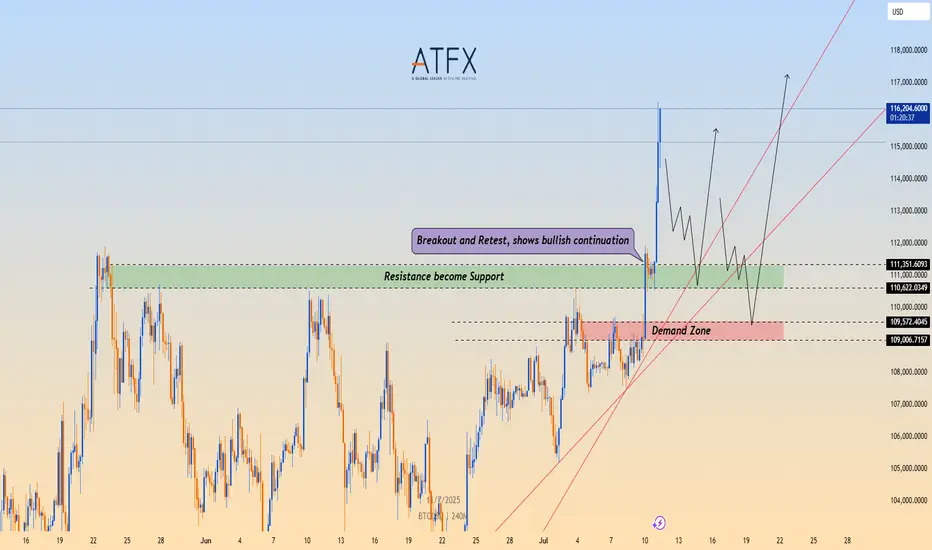
BTC/USD Breaks Out, Eyes Fresh Highs Above $116,000📉 Technical Structure
BITSTAMP:BTCUSD BTC/USD confirmed a bullish breakout above the $111,000–$111,350 resistance zone, which has now flipped into support. Price action shows a clean retest and bounce from this level, indicating a bullish continuation. Key support lies at the $110,600–$109,000 demand zone. If the price clears $116,800, bulls may target $118,000–$120,000 next.
📈 Long Trade Setup
Entry: $111,350
Stop Loss: $109,000
Take Profit 1: $116,800
Take Profit 2: $118,000
Invalidation: Break below $109,000 and trendline
🌐 Macro Background
BINANCE:BTCUSD Bitcoin rallied above $116,000 to a new all-time high after clearing the $111,000 resistance. The breakout was supported by strong momentum and optimism following a technical trendline breach. Despite some selling pressure and rising funding rates, the broader trend remains bullish. A sustained move above $116,800 could open the door toward $120,000.
📌 Key Technical Zones
Resistance: $116,800 / $118,000
Support: $110,622–$111,350, $109,006–$109,572
📘 Trade Summary
As long as BTC/USD remains above $111,350, the bullish structure is valid. Short-term pullbacks into the $109,006–$109,572 zone may offer buying opportunities.
⚠️ Disclaimer
This analysis is for informational purposes only and does not constitute investment advice.
BTC/USD 1H chart Pattern.BTC/USD 1H chart I shared, the chart shows a bullish breakout pattern forming (likely a symmetrical triangle breakout).
Target Points Identified:
1. First Target:
📍 109,750 USD
2. Second Target:
📍 110,750 USD
---
Key Notes:
Breakout above the descending trendline signals a bullish move.
Ichimoku cloud is thinning, suggesting possible momentum if price breaks upward.
Make sure to confirm the breakout with strong volume.
Let me know if you want stop-loss levels or a detailed trade setup.

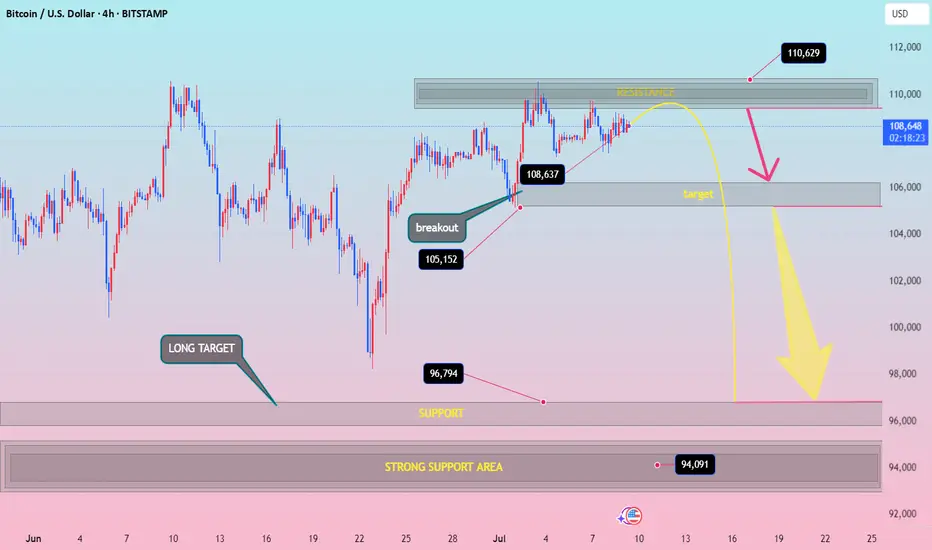
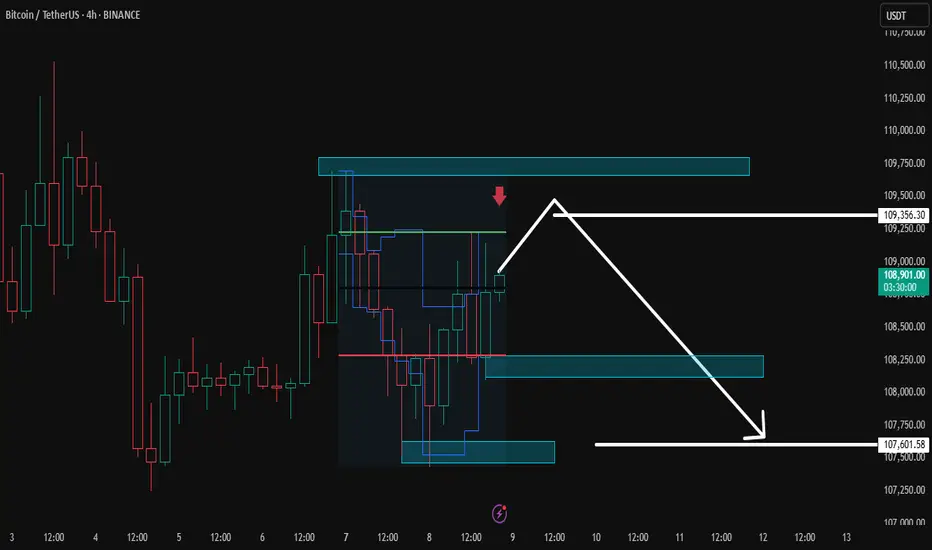
BTCUSD h4 down surelybtcusd down idia Resistance Zone: Around 110,000–111,000
Price Action Expectation:
→ Short-term push to 110,629
→ Then rejection toward 105,000, and potentially all the way down to 96,794 or even 94,091
Bearish bias after resistance is hit
⚡ Disruption Analysis (Contrarian View)
✅ 1. Resistance Flip Possibility
What if the 110,000 resistance breaks cleanly with strong volume?
Invalidates the bearish rejection arrow
Could trigger FOMO buying → Acceleration toward 112,500+
Bullish scenario: formation of a bull flag above resistance = continuation setup
✅ 2. Bear Trap Theory at 105,000 Zone
That “target” zone near 105k could be a fake breakdown zone
Market might dip there briefly, lure shorts, then reverse violently
This creates liquidity for a rapid long squeeze breakout
✅ 3. Market Structure Still Bullish on HTF
Higher lows from June 24 to July 6
Clean breakout at 105,152
Still respecting ascending structure — which is not bearish yet
🚨 Disruption Summary Chart Moves
🔼 Alternate Path 1 (Bullish Disruption):
Price consolidates under resistance → breaks above 110,629 → targets 112,500–115,000
🔄 Alternate Path 2 (Fake Breakdown Disruption):
Drops to 105,000, triggers sell-off → sharp reversal → back above 108,637
🔽 Original Path (Rejection-Based Bearish):
Still possible — but not the only high-probability path anymore
bitcoin targets...Based on the patterns and price movements in Bitcoin, I have identified possible targets in the image.
7.7 Analysis of the latest BTC trend and operation layout📊 Cautious wait-and-see strategy (Recommendation index ⭐️⭐️⭐️⭐️⭐️)
📰 News information:
1. Digital Market Asset Transparency Act
2. Anti-CBDC Regulation Act
3. US Stablecoin Innovation Act
📈 Technical Analysis:
At present, the price of BTC is around 109,000, and the overall narrow fluctuation pattern continues. The market as a whole lacks clear direction. However, it is worth noting that the trading volume has dropped to 30.1 billion US dollars, which has further shrunk compared with the previous day, reflecting a decline in market participation.
In my opinion, the driving factors of the market include the following:
1. The continued activity of ancient whales has attracted attention
2. The technical side shows that the momentum is weakening
3. Market sentiment has turned neutral
4. ETF fund inflows remain strong
5. The "Crypto Week" policy catalyst is coming
Currently, BTC continues to consolidate within the upward trend line, but the momentum indicator shows fatigue, the 4H Bollinger Bands shrink, and the price is running near the middle track of 108,400. Enter the market cautiously during the day and pay attention to the support of 107,000
🎯 Trading Points:
SELL 109,000-110,000
TP 107,500-107,000
In addition to investment, life also includes poetry, distant places, and Allen. Facing the market is actually facing yourself, correcting your shortcomings, facing your mistakes, and being strict with yourself. I share free trading strategies and analysis ideas every day for reference by bros. I hope my analysis can help you.
BITSTAMP:BTCUSD


Weekend BTC Trend Analysis and Trading SuggestionsLet's review this afternoon's market performance. The BTC price, as we anticipated, rebounded to around 109,000 in the afternoon before plummeting sharply. Living up to "Black Friday", this violent drop was well within our expectations. In the afternoon's live trading, we also reminded everyone that as long as there was a rebound to the upper zone, it was a good opportunity to go short. This drop has created a space of nearly 1,500 points. Currently, the BTC price has pulled back to around 107,800.
From the current 4-hour K-line chart, after a strong upward surge, the market encountered significant resistance near the upper track of the Bollinger Bands. As bullish momentum gradually faded, the price started to come under pressure and decline, suggesting that the short-term upward trend may come to a temporary halt. At present, the market has recorded multiple consecutive candlesticks with large bearish bodies. The price has not only effectively broken below the key support level of the Bollinger Bands' middle track but also caused the Bollinger Bands channel to switch from expanding to narrowing, indicating that market volatility is decreasing. In terms of trading volume, it showed a moderate increase during the price pullback, which further confirms the authenticity of the bearish selling pressure.
BTCUSD
sell@108000-1085000
tp:107000-106000
Investment itself is not the source of risk; it is only when investment behavior escapes rational control that risks lie in wait. In the trading process, always bear in mind that restraining impulsiveness is the primary criterion for success. I share trading signals daily, and all signals have been accurate without error for a full month. Regardless of your past profits or losses, with my assistance, you have the hope to achieve a breakthrough in your investment.
BTC short setup As previous weekly went good on BTC, a nice bounce from the area on swing setup. Now wait for the liquidity grab from 107.8k then take short, that whiteline is important to break and sustain for btc to continue it's Bullish trend. Longer sl is just to avoid wick damage closing matter here. Good luck, book at least 50% on 105.2k rest hold the position, and take long from mentioned zone.

BTC/USDT 4H – High-Probability Decision Point Ahead Bitcoin is currently retesting a confluence-rich zone — a textbook decision area where structure meets sentiment.
🔻 What’s in play?
🟥 Demand Zone / Bullish Order Block / Breaker Block (visible on 1H)
📈 Third-touch test of the ascending trendline – statistically known to trigger strong moves
⚪ Price sitting just above the 200 EMA acting as dynamic support
🧱 Prior resistance flipped to support — now being validated again
Despite the correction, structure remains intact. This is a healthy retracement unless price starts closing below trendline + zone with volume.
🔀 Possible Outcomes:
Bounce: If buyers step in here, this could mark the next leg in the uptrend.
Breakdown: A strong close below the zone/trendline could shift structure and sentiment bearish.
⚠️ No trade bias here — let price show its hand.
💬 What’s your view — bounce or break? Comment below!
✍️ Chart marked with structure logic only — not financial advice.
