BTCUSDT 1W UpdateYes, history is likely to repeat itself, making it possible for Bitcoin to reach a new all-time high in the range of $130K to $150K this year.
Are you ready?
Btcusdtlong

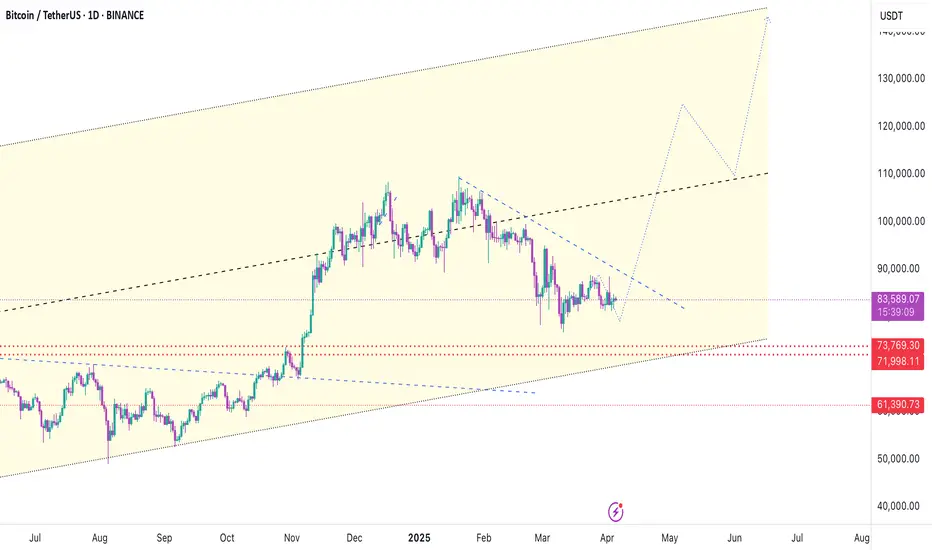
Bitcoin's 215-Day Pattern: Another Breakout Loading?The Bitcoin chart shows a repeating pattern of consolidation lasting 215 days before each major upward breakout. This cycle has occurred multiple times over the past two years, with each accumulation zone followed by a strong bullish rally.
Currently, Bitcoin is once again emerging from a similar 215-day consolidation phase, suggesting the potential for another significant move to the upside if the pattern holds. If history repeats, we could see a target around $150K.
BINANCE:BTCUSDT CRYPTOCAP:BTC

BTCUSDT:Test support, go long on pullbackBitcoin has also experienced a rapid decline due to the tariff remarks of the U.S. government. It is currently testing a key support level. If it continues to fall and breaks below 81,126, a bearish trend will be confirmed. If this support level is not breached, one can initiate long positions at the low level.
Trading Strategy:
buy@81500-82500
TP:83500-84500
Get daily trading signals that ensure continuous profits! With an astonishing 90% accuracy rate, I'm the record - holder of an 800% monthly return. Click the link below the article to obtain accurate signals now!

BTC - NEW ATH on the HorizonBitcoin has surprised us with a sudden turnaround over the past two weeks.
✅ Technical indicators are bullish
✅ Candle stick patterns are bullish
✅ Trendlines are bullish
I can't help but come to any other conclusion - BTC is now BULLISH, likely making it's way to a new ATH.
This will bring about my much anticipated ALTSEASON:
_________________
BINANCE:BTCUSDT

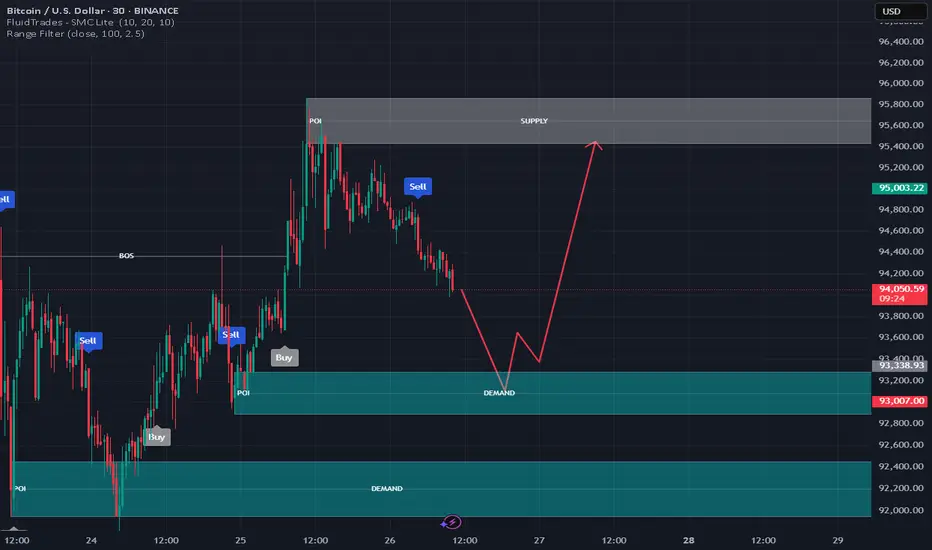
Trade Plan for BTC/USD (30-Minute Timeframe)Market Context:
Price is currently in a downtrend, heading toward a strong demand zone.
There is a major supply zone above where selling pressure previously pushed the price down.
Entry Plan:
🔵 Buy Entry:
Wait for price to tap into the Demand Zone (around 93,000–93,400 USD).
Look for bullish confirmation (e.g., bullish engulfing candle, strong rejection wick, or structure break on lower timeframes like 5-min).
Enter a buy trade once confirmation appears.
🔴 Sell Entry:
If price reaches the Supply Zone (around 95,400–95,800 USD), wait for bearish confirmation (e.g., bearish engulfing, rejection candles).
Consider selling if bearish signs are strong.
Stop Loss:
✅ For Buy Trade:
Below the Demand Zone (~92,800 USD), giving enough room for volatility.
✅ For Sell Trade:
Above the Supply Zone (~95,900 USD).
Take Profit Targets:
🎯 Buy Trade TP:
First Target: Previous minor resistance (~94,600 USD)
Final Target: Supply Zone (~95,400–95,800 USD)
🎯 Sell Trade TP:
First Target: Minor support (~94,600 USD)
Final Target: Back to Demand Zone (~93,400 USD)
Risk Management:
Risk only 1–2% of your trading account per trade.
Adjust position size according to stop loss distance.
Maintain Risk-Reward Ratio of at least 1:2 or better.
Important Reminder:
Always wait for clear confirmation signals before entering. Avoid forcing trades. Manage emotions and stick to your plan!
#BTCUSDT: From $74,000 to $88,000 Moving Well! More Growth CominIt’s been on a steady climb from $74,000 to $88,000. We’re expecting even more growth in the coming weeks. The price has finally broken free from its consolidation phase and is now on the rise. We think it’ll reach $94,000, then $100,000, and maybe even go up to $120,000 by the end of the year.
What do you think? Let me know in the comments below!
Thanks!
Team Setupsfx_

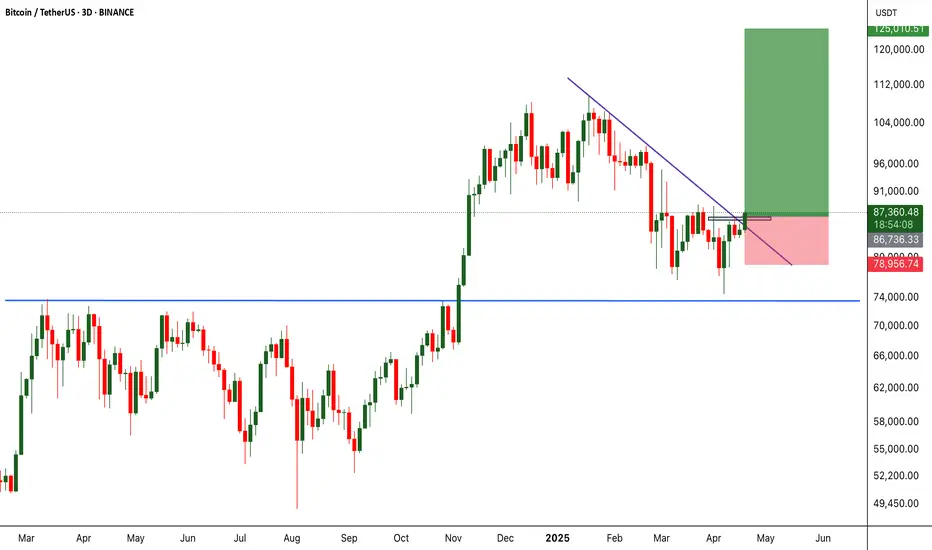
BTCUSDT 1W AnalysisBTC ~ 1W Analysis
#BTC It is necessary to wait until this pattern is successfully broken to confirm a sustained bullish trend.

BTC/USD) breakout up trand analysis Read The ChaptianMr SMC Trading point update
bullish analysis of Bitcoin (BTC/USD) on the 4-hour timeframe, showing a potential breakout and rally scenario. breakdown:
---
1. Market Structure:
Downtrend Channel: Price has been moving within a falling channel.
Double Bottom Pattern: Marked by two green arrows — a bullish reversal signal.
Breakout Attempt: Price is testing the upper trendline and 200 EMA (~$83,952), suggesting possible breakout.
---
2. Key Zones:
FVG (Fair Value Gap): Around $78,678 — a demand zone where price could retest before moving higher.
Breakout Confirmation Zone: ~$85,130 — breaking above this with volume signals strength.
Target Point: $95,206 — an upside target projecting ~31.77% gain from the breakout.
---
3. Indicators:
200 EMA: Currently acting as resistance. Break above it confirms bullish momentum.
RSI: Around 60 — pointing upward with bullish divergence from recent lows, showing increasing buying pressure.
---
4. Scenarios:
Scenario 1 (Bullish Continuation):
Breaks above trendline and 200 EMA.
Retest (optional) and then heads toward $95,206 target.
Scenario 2 (Retest First):
Price dips into the FVG/demand zone.
Finds support and launches upwards, confirming a strong base.
Mr SMC Trading point
---
Summary of the Idea:
This is a buy setup on breakout or on pullback:
Aggressive Entry: Break and close above $85,130.
Safe Entry: Pullback into $78,678 area (FVG).
Target: $95,206
Risk Zone: Below $78,000 (invalidates bullish structure).
Pales support boost 🚀 analysis follow)

Bitcoin Will Soon Follow GOLD!!!Bitcoin has just hit the $87,000 mark, breaking out of a classical bullish continuation pattern. This breakout is significant and indicates strong bullish momentum that could lead to further upside. If this momentum continues, Bitcoin has the potential to not only reclaim its previous all-time high but also push beyond into price discovery mode.
Interestingly, this move comes right after Gold printed a new all-time high. Historically, Gold has often led major macro cycles, with Bitcoin following closely behind. This pattern seems to be playing out once again. As investors rotate capital and seek safe havens or inflation hedges, Bitcoin stands to benefit as the digital equivalent of Gold. If history repeats, Bitcoin could be on the verge of its next major rally.
From a technical standpoint, the breakout is supported by increasing volume and bullish momentum indicators such as RSI and MACD. The key support now lies around the $85K– GETTEX:87K zone, which previously acted as resistance. If price holds above this level, the next targets to watch are $90K and the psychological $100K mark.
That said, proper risk management is crucial. The market is moving fast, and while the setup is bullish, it’s important to have a well-defined stop-loss strategy in place. Avoid chasing price—wait for clean retests or consolidations if you missed the initial breakout. Momentum may be in the bulls’ favor, but discipline keeps you in the game.
Bitcoin has made its move. Gold has shown the way. If the historical correlation holds true, Bitcoin may be just getting started. Stay focused and manage your risk wisely.
Bitcoin 15-Minute Chart – Projected Target PriceCurrently, the trend appears to be upward.
If the bullish trend continues, the price is expected to rise toward approximately 90,452.
On the other hand, if it declines, a drop toward around 83,808 is expected.
However, considering the current time of day, the market seems to be losing some momentum, so it's more reasonable to expect a short-term uptrend or sideways movement for now.

BTCUSDT 1D Analysis UpdateBTC ~ 1D Analysis Update
#BTC Alright let's continue this bullish, a minimum of $ 130,000 - $ 150,000 in 2025.

BTC & ETH Weekly Forecast – Will Week 16 Bring a Breakout?🔍 Weekly Outlook – Week 16, 2025
• BTC remains below the daily Ichimoku Cloud.
• Volatility (BBWP) is at historical lows — potential breakout setup.
• ETH hovering above key EVWMA zones
• If BTC enters the cloud, 92K becomes a valid short-term target.
• ETH needs to reclaim 1600+ to sustain bullish momentum.
📌 This is a quick overview of my weekly analysis.
I explore the full setup across 1D, 4H, and 12H timeframes,
with Ichimoku, BBWP, and EVWMA discussed in detail elsewhere.

BTCUSDT hitting daily resistance but eying weekly resisatnce 98kBTCUSDT has bounced well from weekly support WS1 and currently heading towards daily resistance DR1 around 87k-88k zone. Once it breaks this, the next target would be weekly resistance WR1 which is the next resistance on its way. This resistance is sitting around 95k-98k zone. I think, the price is eying that zone and in coming days and week we will see the price trading there. However, this WR1 zone would definitely make the price push back on firts hit. But the price will definitely make another go there before either breaking of giving up for a while again. The resistance WR1 will be the only obstacle before the price can hit all time high and beyond again. Therefore, this weekly resistance will not give the way easy as this will be a strong supply zone. But I would not worry much once the price reaches there. This will evnetually signal that we are going beyond ATH and further higher. It would be just a bit of struggle there and some consolidation and some boring price action for a while, and then there will be clear sky.

BTCUSDT LongHello dear
btc is seeing to go up by febonaci and trade lines by the end of 2024 we will reach near 90k and by the end of 2025 it will reach 343k BINANCE:BTCUSDT

Bitcoin going back to 97k ? Follow up on my last idea.
Bitcoin will probably return to the 95/97 k
Stop loss: 69.5 K
Take profit: Around 95/96k

Based on the BTC/USDT 4-hour chart:Current Price Levels: Bitcoin is currently trading around 85,269.35 USDT.
Support and Resistance:
Support Zones: A crucial support zone marked in green suggests strong buying interest between 80,000 and 81,000 USDT.
Resistance: The upper trend line indicates resistance; if Bitcoin can break it, it could target levels close to 88,000 USDT.
Bullish Case: A breakout above the upper trend line could lead to an upward rally towards 88,000 USDT or above.
Bearish Case: If the price breaks below the support zone, a downward move toward 75,000 USDT can be expected.
Monitor the trade closely to see how it reacts around these crucial levels. Based on the price action, adjust your strategy accordingly. Feel free to ask if you have further questions or need analysis on specific indicators!
If you found this analysis helpful, hit the Like button and share your thoughts or questions in the comments below. Your feedback matters!
Thanks for your support!
DYOR. NFA

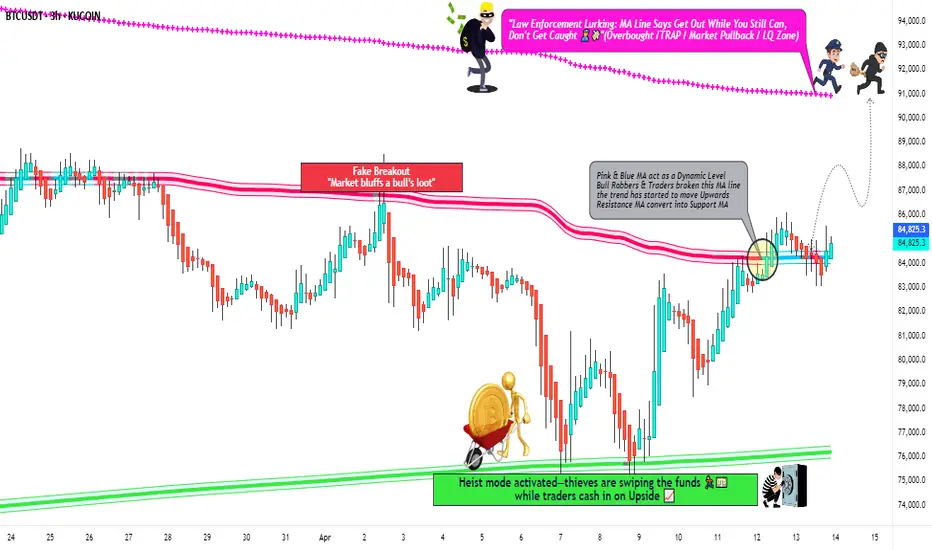
"Bitcoin vs Tether" Crypto Market Heist Plan (Swing/Day)🌟Hi! Hola! Ola! Bonjour! Hallo! Marhaba!🌟
Dear Money Makers & Robbers, 🤑 💰💸✈️
Based on 🔥Thief Trading style technical and fundamental analysis🔥, here is our master plan to heist the BTC/USDT "Bitcoin vs Tether" Crypto Market. Please adhere to the strategy I've outlined in the chart, which emphasizes long entry. Our aim is the high-risk MA Zone. Risky level, overbought market, consolidation, trend reversal, trap at the level where traders and bearish robbers are stronger. 🏆💸"Take profit and treat yourself, traders. You deserve it!💪🏆🎉
Entry 📈 : "The vault is wide open! Swipe the Bullish loot at any price - the heist is on!
however I advise to Place buy limit orders within a 15 or 30 minute timeframe nearest or swing low or high level for pullback entries.
Stop Loss 🛑:
Thief SL placed at the recent/swing low level Using the 30mins timeframe (81000) Day trade basis.
SL is based on your risk of the trade, lot size and how many multiple orders you have to take.
🏴☠️Target 🎯: 91000 (or) Escape Before the Target
🧲Scalpers, take note 👀 : only scalp on the Long side. If you have a lot of money, you can go straight away; if not, you can join swing traders and carry out the robbery plan. Use trailing SL to safeguard your money 💰.
BTC/USDT "Bitcoin vs Tether" Crypto Market Heist Plan (Swing/Day) is currently experiencing a bullishness,., driven by several key factors. 👇👇👇
📰🗞️Get & Read the Fundamental, Macro, COT Report, On Chain Analysis, Sentimental Outlook, Intermarket Analysis, Future trend targets... go ahead to check 👉👉👉🔗
⚠️Trading Alert : News Releases and Position Management 📰 🗞️ 🚫🚏
As a reminder, news releases can have a significant impact on market prices and volatility. To minimize potential losses and protect your running positions,
we recommend the following:
Avoid taking new trades during news releases
Use trailing stop-loss orders to protect your running positions and lock in profits
💖Supporting our robbery plan 💥Hit the Boost Button💥 will enable us to effortlessly make and steal money 💰💵. Boost the strength of our robbery team. Every day in this market make money with ease by using the Thief Trading Style.🏆💪🤝❤️🎉🚀
I'll see you soon with another heist plan, so stay tuned 🤑🐱👤🤗🤩
BTCUSDT 1DBTC ~ 1D Analysis
#BTC Let us now hope for a decisive breakout of the bullish pattern, signaling a potential end to this downtrend.

BTCUSDT long idea towards 82kThe price bounced from weekly support and now have retraced a bit. It is possible that it retraces a bit further before moving towards 82k. The move can continue beyond 82k. Therefore, lets take a long here targeting first 82k.

BTCUSDT 1DBTC ~ 1D Analysis
#BTC Let us now pray that the trade war will be completed so that this bullish pattern goes according to plan.

Bitcoin Holding Strong — Next Stop: $150K?BTCUSDT Technical analysis update
BTC price is currently retesting its major support zone, which was previously a strong resistance area, now acting as support at the $70K–$75K level. The price has just touched the $75K support zone, and we can expect a consolidation above the $70K level followed by a potential bounce back or a V-shaped recovery from the current level.if we see a strong bounce from the current support level, the next potential target could be around $150K

BTCUSDT, We were moved like ...Hello everyone
According to the chart that you can see the price movement was exactly moved to our route but at this time we expect because of the reason in world and US Reciprocal Tariffs at this time Gold movement is important after the Gold start the corretion wave the smart money comes to the cryptocurrency market and we expect the excitement movement.be patient until ...
Be Lucky
AA