BTCUSDT 1D Analysis UpdateBTC ~ 1D Analysis Update
#BTC Alright let's continue this bullish, a minimum of $ 130,000 - $ 150,000 in 2025.
BTCUSDTPERP

Consolidation Divergence - Range Trading StrategyLast week, BTC continued to oscillate in the 83K-86K range. Technically, the daily MACD showed increasing volume but a deviation from the price. At the same time, the Bollinger Bands narrowed sideways, and the market entered a typical "pre-breakout momentum" stage.
Before an effective breakthrough, you can rely on the range to sell high and buy low, strictly set stops, and pay close attention to changes in volume and energy and confirmation of the breakthrough direction.
BTCUSD
sell@86500-85500
tp:84500-83500
buy@83000-84000
tp:85000-86000
I hope this strategy will be helpful to you.
When you find yourself in a difficult situation and at a loss in trading, don't face it alone. Please get in touch with me. I'm always ready to fight side by side with you, avoid risks, and embark on a new journey towards stable profits.

BTC - Ready for a FLUSH?BTC has acquired liquidity both sides, lets see closing 88.9k on day can make way lots of things! Eventually 83.1k is my main targets!

BTC in Tight Range: Calm Before the Storm?$BTC/USDT is consolidating within a tight range (highlighted in the blue box) for the past 8 days. This looks like a strong accumulation phase, suggesting that the next breakout could be explosive.
Watch for a decisive move above the range for confirmation.
DYOR, NFA

Rising Wedge for #BTCUSDTWhat’s visible on the BYBIT:BTCUSDT.P chart:
📈 Rising Wedge:
➡️ This is a potentially bearish pattern for BYBIT:BTCUSDT.P , especially when it appears after a strong rally following a deep drop (which is exactly the case here).
➡️ The price has almost reached the upper boundary of the wedge and has already formed a second top (Top 2) — a signal of possible weakness.
🔵 Levels:
➡️ POC BYBIT:BTCUSDT.P — $82,490.8 has already been broken to the upside, indicating current market strength.
➡️ The price is approaching major resistance at $83,807.1 — momentum is already slowing down in this zone.
➡️ Support remains in the $80,449.7 – $78,412.7 area.
📊 Volume:
➡️ The rally was supported by high volume, but the most recent candles show declining volume as the price nears the top of the wedge.
➡️ This could indicate weakening buying pressure.
📉 Why it’s important to be cautious with long positions:
➡️ A rising wedge can act as a bull trap.
➡️ The price is near a critical resistance — even a small pullback could lead to a wedge breakdown.
➡️ After such a steep run (from 73K to almost 84K), the chance of profit-taking and a pullback is high.
➡️ Volume is declining — bullish momentum may be fading.
📢 Conclusion:
➡️ Opening a BYBIT:BTCUSDT.P long position right now is risky because:
- the wedge structure suggests a potential reversal to the downside;
- there’s no breakout above the previous high with confirmation;
- and volume does not support further upward movement.
❗️ It's better to watch how the price reacts to the wedge and BYBIT:BTCUSDT.P key levels — a long entry is only valid if the price breaks and holds above $83,800–84,000 with strong volume.
➡️ Until then, a neutral or cautiously bearish position is more appropriate.

BTCUSDT hitting daily resistance but eying weekly resisatnce 98kBTCUSDT has bounced well from weekly support WS1 and currently heading towards daily resistance DR1 around 87k-88k zone. Once it breaks this, the next target would be weekly resistance WR1 which is the next resistance on its way. This resistance is sitting around 95k-98k zone. I think, the price is eying that zone and in coming days and week we will see the price trading there. However, this WR1 zone would definitely make the price push back on firts hit. But the price will definitely make another go there before either breaking of giving up for a while again. The resistance WR1 will be the only obstacle before the price can hit all time high and beyond again. Therefore, this weekly resistance will not give the way easy as this will be a strong supply zone. But I would not worry much once the price reaches there. This will evnetually signal that we are going beyond ATH and further higher. It would be just a bit of struggle there and some consolidation and some boring price action for a while, and then there will be clear sky.

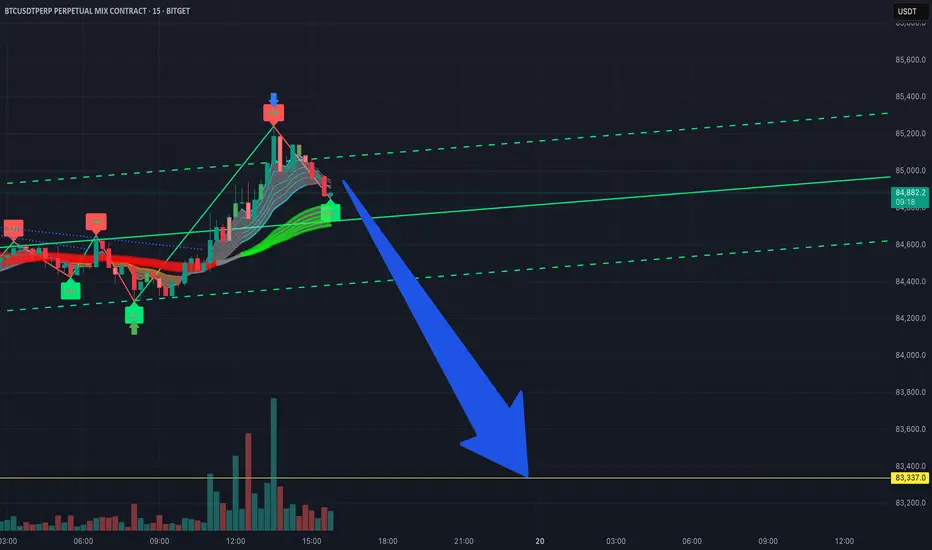
I’m estimating a short target for Bitcoin futures on the 15-minuLooking at the 15-minute chart on Bitget, I'm expecting a potential drop down to around 83,337. Just something to keep an eye on if you're in a short-term trade.
Bitcoin is currently trading around 85,269.35 USDT. Bitcoin is currently trading around 85,269.35 USDT.
Support Zone: A crucial support zone marked in green suggests strong buying interest between 80,000 and 81,000 USDT.
Resistance: The upper trend line indicates resistance; if Bitcoin can break it, it could target levels close to 88,000 USDT.
Bullish Case: A breakout above the upper trend line could lead to an upward rally towards 88,000 USDT or above.
Bearish Case: If the price breaks below the support zone, a downward move towards 75,000 USDT can be expected.
Monitor the trade closely to see how it reacts around these crucial levels. Adjust your strategy accordingly based on the price action. If you have further questions or need analysis on specific indicators, feel free to ask!
If you found this analysis helpful, hit the Like button and share your thoughts or questions in the comments below. Your feedback matters!
Thanks for your support!
DYOR. NFA

#BTC Ascending Triangle📊#BTC Ascending Triangle📈
🧠As time goes by, the price is gradually compressed and forms an ascending triangle. We need to observe the breakout opportunities on either side to decide what to do.
➡️The trading volume is relatively low over the weekend. In the absence of market volatility, we still wait and see, patiently waiting for the right opportunity to appear.
➡️I wanted to participate in some long trades today, but the price did not reach the overlapping support area quickly, and this support area is also time-limited. Once it exceeds the expected time range, the effectiveness of the support area will decrease, so I decided to cancel the long limit order.
⚠️Be patient!
🤜If you like my analysis, please like 💖 and share 💬
BITGET:BTCUSDT.P

#BTC reaches the support zone, beware of rebound📊#BTC reaches the support zone, beware of rebound📈
🧠From a structural perspective, we fell below the blue resistance zone and reached the stage support zone, so there is an expectation of rebound, but we fell below the inflection point of 83675, which means that the probability of our continuation of the bullish trend has decreased, and we are likely to fall below the inflection point of 82999. So what we need to focus on today is the shorting opportunity after the rebound reaches the overlapping resistance zone.
➡️New long opportunities need to pay attention to two supports around 81779 and 79689.
⚠️Note that we should not be too optimistic before we break through the blue resistance zone. I did not participate in the short trade of BTC because shorting ETH is more cost-effective, and it also quickly reached the target area today.
Let's take a look👀
🤜If you like my analysis, please like💖 and share💬
BITGET:BTCUSDT.P


#BTC Ascending Triangle📊#BTC Ascending Triangle📈
🧠From a structural point of view, we are currently in the resistance zone at the daily level, so it is reasonable that we have been consolidating here for a long time.
➡️From a graphical point of view, we have formed an ascending ascending triangle here. Generally, we continue to rise according to this model, and it is also regarded as a signal that the trend is about to end, so we can pay attention to the short-selling opportunities in the red target area above.
⚠️Note that if we fall below the turning point 83675 in advance, the expectation of continued rise will be invalid, and we can pay attention to the short-selling opportunities when we rebound to the blue resistance area again.
🤜If you like my analysis, please like💖 and share💬
BITGET:BTCUSDT.P

#BTC in the resistance zone, beware of pullbacks📊#BTC in the resistance zone, beware of pullbacks📉
🧠From a structural perspective, we are currently in the blue resistance zone at the daily level, so we need to pay attention to the risk of a pullback if we cannot break through this area.
➡️The upward trend support line was broken, so it turned into a resistance line. The price reacted well when it touched this resistance line, so we need to pay attention to the suppression of this resistance line.
➡️The downward trend line at the daily level was broken, which means that the adjustment at the daily level may be over, so if there is a good pullback, then we need to look for opportunities for long trades. The support area worth our attention is 80000-81188.
⚠️Note that if the closing price at the 4h level is below 80000, then the market may go bad and we may enter a deeper adjustment.
Let's see👀
🤜If you like my analysis, please like💖 and share💬
BITGET:BTCUSDT.P

Trump's Crypto Policies Drive Bitcoin Dominance to New HighsSince President Trump's inauguration, Bitcoin dominance (BTC.D) has steadily climbed from around 55% to over 63%, reflecting a significant shift in market dynamics. This rise is largely attributed to the U.S. government's strategic accumulation of Bitcoin, including the establishment of a Strategic Bitcoin Reserve funded by seized assets. Such initiatives have redirected capital from altcoins to Bitcoin, reinforcing its dominance in the cryptocurrency market.
BTC Dominance (BTC.D) is hovering at a critical resistance zone between 63% and 64%. A breakout above 65% could signal increased capital flow into Bitcoin, potentially pushing its price down to $75K or even $55K, while altcoins may underperform. Conversely, a rejection at this level might indicate the onset of an altcoin season. Currently, Bitcoin is trading around $85K, awaiting a catalyst to determine its next significant move.

BTCUSD Today's strategyYesterday, the price of Bitcoin increased, but the trading volume decreased, weakening the short-term upward momentum. However, in the long run, the market has sufficient liquidity. The active trading of a large number of investors supports price discovery, and it is likely to drive up the price when there are favorable factors.
It should be noted that the cryptocurrency market is highly volatile and uncertain. Although we are bullish on the price of Bitcoin today, unexpected factors may change its trend. When making investment decisions, investors should assess their risk tolerance and operate with caution.
BTCUSD
buy@83500-84500
tp:85500-86500
I hope this strategy will be helpful to you.
When you find yourself in a difficult situation and at a loss in trading, don't face it alone. Please get in touch with me. I'm always ready to fight side by side with you, avoid risks, and embark on a new journey towards stable profits.

Keep a close eye on the downward movement of BTC at all times.Today, BTC is in a sideways trend, with its price fluctuating in the range of 83,000 to 86,000. 📊
At present, there are no significant new developments in the area of tariffs. 👍
However, what we need to be vigilant about is that if the tariff situation deteriorates and triggers the market's safe - haven mechanism, a large amount of capital is highly likely to flow into the relatively stable gold and foreign exchange markets. 😟
This, in turn, could lead to a large - scale sell - off in the Bitcoin market. 💥
Therefore, it is recommended to consider short - selling at relatively high price points. 📉
The accuracy rate of our daily signals has remained above 98% throughout a month 📈! You are warmly welcome to follow us and join in on the success 🌟.
💰💰💰 BTCUSD 💰💰💰
🎯 Sell@84500 - 85500
🎯 TP 82500 - 81500
Traders, if you're fond of this perspective or have your own insights regarding it, feel free to share in the comments. I'm really looking forward to reading your thoughts! 🤗

#BTC #BTCUSD #BTCUSDT #BITCOIN #SHORT & #LONG #Setups #Eddy#BTC #BTCUSD #BTCUSDT #BITCOIN #SHORT & #LONG #Setups #Eddy
BTCUSDT.P Short & Long Setups with Entry Points.
This Setups is based on a combination of different styles, including the volume,ict & Price Action Classic.
Based on your strategy and style, get the necessary confirmations for this short & long setups to enter the trade.
Don't forget risk and capital management.
🔴 Short Entry : 86000 (( Already Activated ))
⚪️ SL : Available on chart
⚫️ TP1 : 75000
⚫️ TP2 : 70000
⚫️ TP3 : 62000
🟢 Long Entry : 61845.8
⚪️ SL : Available on chart
⚫️ TP1 : 250000
⚫️ TP2 : 500000
⚫️ TP3 : 999000
‼️ Futures Trading Suggested Leverages : 3-5-7
The World Let it be Remembered...
Dr. #Eddy Sunshine
4/13/2025
Be successful and profitable.
Please see my previous analysis on Bitcoin and proceed based on the second scenario.
My previous analysis on Bitcoin :
I also invite you to check my analysis on the Total 3 chart and proceed accordingly, and after it happens on the altcoins, enter swing long trades with the necessary confirmations.
My analysis of the Total 3 chart:
👆 Based on the analysis provided on the Total 3 chart, proceed and wait for another bearish lag for the Total 3 chart to reach the specified area. The divergence on the upper timeframe is most likely a market maker trap and the current bullish move is a fake. In my opinion, the main bullish move will begin after another 30-45% correction on altcoins and the Total 3 chart reaching the specified area and the orange POC line.

#BTC #BTCUSD #BTCUSDT #BITCOIN #LONG #SWING #Analysis #Eddy#BTC #BTCUSD #BTCUSDT #BITCOIN #LONG #SWING #Analysis #Eddy
BTCUSDT.P Swing Long Analysis With Entry Points.
This is my possible Scenarios 1&2 analysis of Bitcoin's future trend.
This Analysis is based on a combination of different styles, including the volume,ict & Price Action Classic.
Based on your strategy and style, get the necessary confirmations for this Swing long to enter the trade.
Don't forget risk and capital management.
First Entry point of Scenario 1 already touched.
The responsibility for the transaction is yours and I have no responsibility for not observing your risk and capital management.
🗒 Note: The price can go much higher than the first target, and there is a possibility of a 500% pump on this currency. By observing risk and capital management, obtaining the necessary approvals, and saving profits in the targets, you can keep it for the pump.
Spot Investing : ((long 'buy' position)) :
🟢 Entry 1 : 79285.50 (( Scenario 1 Entry point ))
🟢 Entry 2 : 61845.77 (( Scenario 2 Entry point ))
⚪️ SL : Behind the last shadow created.
⚫️ TP1 : 250000
⚫️ TP2 : 500000
⚫️ TP3 : 999000
‼️ Futures Trading Suggested Leverages : 3-5-7
The World Let it be Remembered...
Dr. #Eddy Sunshine
4/4/2025
Be successful and profitable.
My previous analysis of Bitcoin (a view of one of the reasons for my first scenario):
Do you remember my first Bitcoin swing long signal entry & targets?
My first swing long signal was provided on BTC, which was spot pumped by more than 150% and was profitable :

At present, a selling phenomenon has emergedAt present, a selling phenomenon has emerged😰, and a large number of traders are waiting for the market to open⏰.
When other markets open on Monday, the situation of a large amount of capital flowing out to other trading fields also deserves attention. 😟
Especially the flows to the XAU/USD and USOIL markets, or other foreign exchange markets. 💱 The movement of funds to these areas might be influenced by economic news, geopolitical events, or simply portfolio re - balancing by investors. 📰
💰💰💰 BTCUSD 💰💰💰
💰💰💰 BTCUSD 💰💰💰
🎯 Sell@84000 - 84500
🎯 TP 82500 - 81500
Recently, the market has been extremely volatile 😱, which has led to the clearing of many traders' accounts or significant losses 😫. You can follow my signals and gradually recover your losses and achieve profitability 🌟💪.
Traders, if you're fond of this perspective or have your own insights regarding it, feel free to share in the comments. I'm really looking forward to reading your thoughts! 🤗

BTC Today's strategyCurrently, BTC is fluctuating upwards within an ascending channel, which closely resembles its price movement that began on March 10th. This suggests that, barring significant changes in the market environment, BTC prices are likely to continue their upward trend and move towards higher price ranges in the near future.
Meanwhile, investors should closely monitor various risk factors that could impact the market, such as changes in regulatory policies and fluctuations in the macroeconomic landscape, and adjust their investment strategies accordingly.
Buy@ 83,500 - 84,500
tp: 86,000 - 87,000
Hope this trading strategy is helpful to you. If you have different opinions, your feedback is most welcome.

BITCOIN SENTIMENTPrice recently broke structure to the upside but is now showing signs of a pullback. I’m expecting a drop toward the support zone, which is highlighted with the white marker. This area aligns with a volume cluster and previous structure, making it a strong candidate for a bullish reaction.
Higher timeframe sentiment remains bullish, so I’ll be watching this level for a potential bounce and continuation to the upside. If this zone fails, deeper support levels come into play.

Bitcoin (BTC/USD) Long Trade Setup – Breakout Strategy with TargCurrent Price: $80,724.28
Entry Point: $80,671.23 (just above current price)
Stop Loss: $78,052.44
Target Point: $88,573.60
Resistance Point: $82,260.90
📈 Trend & Moving Averages
EMA 30 (red): $80,220.87 — Short-term trend.
EMA 200 (blue): $80,788.61 — Long-term trend.
The price is currently between the EMAs, indicating potential indecision or a shift in trend. A break above both EMAs with momentum would confirm bullish strength.
🔑 Trade Setup Summary
Element Level
Entry 80,671.23
Stop Loss 78,052.44
Target (TP) 88,573.60
Resistance 82,260.90
Risk-Reward ~1:2.7 (approx)
📊 Analysis & Expectations
Bullish Bias: The chart suggests a long trade with a breakout strategy.
Volume and momentum confirmation will be key above resistance.
Resistance at 82,260.90 may cause a brief pullback before continuation to the target.
The stop loss is well-placed below a support zone and the most recent swing low.
✅ What to Watch For
Break and close above EMA 200 and resistance at 82.2K.
Bullish volume increase on breakout.
Price action around the entry zone (wait for confirmation candle if unsure).

#BTC complex consolidation phase📊#BTC complex consolidation phase✔️
🧠From a structural perspective, we are still in a bearish structure and have not successfully broken through the downward trend line, so the risk of further downside is still not eliminated.
➡️Currently we are in a complex consolidation phase between the blue resistance zone and the green buy zone, so we should remain cautious in the face of ups and downs.
➡️Patience and wait for trading opportunities to appear after either side breaks through.
Let's see 👀
🤜If you like my analysis, please like 💖 and share 💬
BITGET:BTCUSDT.P

BTCUSDT 1DBTC ~ 1D Analysis
#BTC Let us now hope for a decisive breakout of the bullish pattern, signaling a potential end to this downtrend.
