BTCUSDT at daily resistance, likely to head to 84kThe price has hit the daily resistance as expected in the quoted post. I see a pullback here which is already started. A short trade setup is favorable gere, We take a short in this zone and target towards daily support DS1. The correction can go upto weekly suppor WS1 but lets focus on this short trade first. risking 1.5% for 4.5% win.
Btcusdtshort

Risk-averse funds drive BTC higher.The sharp collapse of the DXY has triggered violent fluctuations in the global monetary system. As risk aversion heats up, investors are adjusting their asset allocations, with substantial capital flowing into "digital gold," which has enabled BTC to break last week's sideways consolidation and initiate an upward trend.
BTCUSD
buy@86500-87500
tp:88500-89500
I hope this strategy will be helpful to you.
When you find yourself in a difficult situation and at a loss in trading, don't face it alone. Please get in touch with me. I'm always ready to fight side by side with you, avoid risks, and embark on a new journey towards stable profits.

Bitcoin: Breaking Below $80K Soon,10% Correction on the Horizon?Hey Realistic Traders, Bitcoin is consistently hitting new lower lows. Could this signal that the bear market is here to stay? Let’s dive in.......
On the H4 chart, Bitcoin is clearly in a bearish phase. It consistently trades below both the trendline and the EMA 200, reinforcing the downtrend. Additionally, a rising wedge pattern has formed and broken out, and the MACD has shown a bearish crossover. This crossover is a key indicator, signaling that momentum is shifting from buyers to sellers.
Together, these signals suggest that Bitcoin may drop toward our first target at 79,081. After reaching this level, a short pullback is expected as traders take profits before the price continues its descent toward a new low at 73,633.
This outlook remains valid as long as the price moves below the stop-loss level at 89,557
Support the channel by engaging with the content, using the rocket button, and sharing your opinions in the comments below.
Disclaimer: "Please note that this analysis is solely for educational purposes and should not be considered a recommendation to take a long or short position on Bitcoin.

Consolidation Divergence - Range Trading StrategyLast week, BTC continued to oscillate in the 83K-86K range. Technically, the daily MACD showed increasing volume but a deviation from the price. At the same time, the Bollinger Bands narrowed sideways, and the market entered a typical "pre-breakout momentum" stage.
Before an effective breakthrough, you can rely on the range to sell high and buy low, strictly set stops, and pay close attention to changes in volume and energy and confirmation of the breakthrough direction.
BTCUSD
sell@86500-85500
tp:84500-83500
buy@83000-84000
tp:85000-86000
I hope this strategy will be helpful to you.
When you find yourself in a difficult situation and at a loss in trading, don't face it alone. Please get in touch with me. I'm always ready to fight side by side with you, avoid risks, and embark on a new journey towards stable profits.

"Bitcoin vs Tether" Crypto Market Heist Plan (Scalping/Day)🌟Hi! Hola! Ola! Bonjour! Hallo! Marhaba!🌟
Dear Money Makers & Robbers, 🤑💰✈️
Based on 🔥Thief Trading style technical and fundamental analysis🔥, here is our master plan to heist the "Bitcoin vs Tether" Crypto Market. Please adhere to the strategy I've outlined in the chart, which emphasizes short entry. Our aim is the high-risk Green MA Zone. Risky level, oversold market, consolidation, trend reversal, trap at the level where traders and bullish robbers are stronger. 🏆💸"Take profit and treat yourself, traders. You deserve it!💪🏆🎉
Entry 📈 : "The vault is wide open! Swipe the Bearish loot at any price - the heist is on!
however I advise to Place sell limit orders within a 15 or 30 minute timeframe most nearest or swing, low or high level for Pullback Entries.
Stop Loss 🛑:
📌Thief SL placed at the nearest/swing High or Low level Using the 4H timeframe (81000) Day/Scalping trade basis.
📌SL is based on your risk of the trade, lot size and how many multiple orders you have to take.
Target 🎯: 70000 (or) Escape Before the Target
"Bitcoin vs Tether" Crypto Market Heist Plan (Scalping/Day Trade) is currently experiencing a Bearish trend.., driven by several key factors.👇👇👇
📰🗞️Get & Read the Fundamental, Macro, COT Report, On Chain Analysis, Sentimental Outlook, Intermarket Analysis, Future trend targets... go ahead to check 👉👉👉🔗🔗
Detailed Point Recap 📋
Fundamentals 📊: Strong network + adoption ✅ offset regulatory risks ⚠️—moderately bullish 📈.
Macro 🌍: Inflation aids BTC 🥇, but tight policy/USD weigh ⚖️—mixed 🤔.
COT 📈: Institutional longs 📈 vs. leverage risks ⚡—cautiously bullish ✅.
On-Chain 🔗: LTH bullishness 📈 vs. STH selling 📉—leans positive but capped ⚖️.
Intermarket 🔄: Short-term bearish (equity/USD) 📉, long-term hedging 📈—mixed ⚖️.
Sentiment 😊: Neutral across cohorts ⚖️—lacking conviction 🤷.
Trends 🎯: Short-term downside ($70K) 📉 vs. long-term upside ($129K) 📈—context-driven 🔮.
Outlook 🌟: Neutral now ⚖️, tilting bearish short-term 📉, bullish long-term 📈.
⚠️Trading Alert : News Releases and Position Management 📰 🗞️ 🚫🚏
As a reminder, news releases can have a significant impact on market prices and volatility. To minimize potential losses and protect your running positions,
we recommend the following:
Avoid taking new trades during news releases
Use trailing stop-loss orders to protect your running positions and lock in profits
💖Supporting our robbery plan 💥Hit the Boost Button💥 will enable us to effortlessly make and steal money 💰💵. Boost the strength of our robbery team. Every day in this market make money with ease by using the Thief Trading Style.🏆💪🤝❤️🎉🚀
I'll see you soon with another heist plan, so stay tuned 🤑🐱👤🤗🤩

How to make a profit?Currently, the BTC market is clearly in a sideways trend 😶, with the price fluctuating between $83,000 - $86,000, presenting trading opportunities 🤝. Here's the analysis: 👉
Market data shows BTC has been repeatedly supported around $83,000 recently 😏. Last week, trading volume spiked at this level, signaling strong buying. The KDJ indicator shows oversold conditions, hinting at a potential short - term rebound 🚀. However, $86,000 is a tough resistance. Multiple breakout attempts failed, and selling pressure grows near this level 😣. Per the Bollinger Bands, $86,000 is close to the upper band, likely triggering a pullback ⬇️.
Moving Average System: The 5 - day and 10 - day moving averages are intertwined, unable to clearly indicate the trend. Their repeated crossovers show the market is in disorderly fluctuations. 👉
💰💰💰 BTCUSD💰💰💰
🎯 Sell@85500 - 85000
🎯 TP 84000 - 83000
Traders, if you're fond of this perspective or have your own insights regarding it, feel free to share in the comments. I'm really looking forward to reading your thoughts! 🤗
👇The accuracy rate of our daily signals has remained above 98% within a month! 📈 We sincerely welcome you to join our channel and share in the success with us! 🌟

It is in a sideways oscillation trend. Sell @ 85500Currently, the BTC market is clearly in a sideways trend 😶, with the price fluctuating between 83,000 and 86,000, offering trading opportunities 🤝. Here’s the analysis: 👉
Market data shows that the BTC price has been repeatedly supported around 83,000 recently 😏. Last week, when it hit this level, trading volume spiked, signaling strong buying. The KDJ indicator shows oversold conditions, hinting at a potential short - term rebound 🚀. However, 86,000 is a tough resistance. Multiple breakout attempts failed, and selling pressure grows near this level 😣. Per the Bollinger Bands, 86,000 is close to the upper band, likely triggering a pullback⬇️
Moving Average System: The 5-day moving average and the 10-day moving average are intertwined, just like an entangled rope 🧵, unable to clearly indicate the trend direction. Their repeated crossovers fully demonstrate that the market is in a state of disorderly fluctuations. 👉
💰💰💰 BTCUSD💰💰💰
🎯 Sell@85500 - 85000
🎯 TP 84000 - 83000
Traders, if you're fond of this perspective or have your own insights regarding it, feel free to share in the comments. I'm really looking forward to reading your thoughts! 🤗
👇The accuracy rate of our daily signals has remained above 98% within a month! 📈 We sincerely welcome you to join our channel and share in the success with us! 🌟

BTC | FAKE REVERSAL - Here's WhyI'm not convinced of the recent "bullish" price action. In fact, I say it's likely the calm before the next bearish move down.
In a downtrend, there are a few tale tell signs that the price has gone into full bear mode . In this video, I discuss two of them.
Make sure you catch up on ALTCOINS, and their ideal buying zones HERE 👀👇
__________________
BINANCE:BTCUSDT

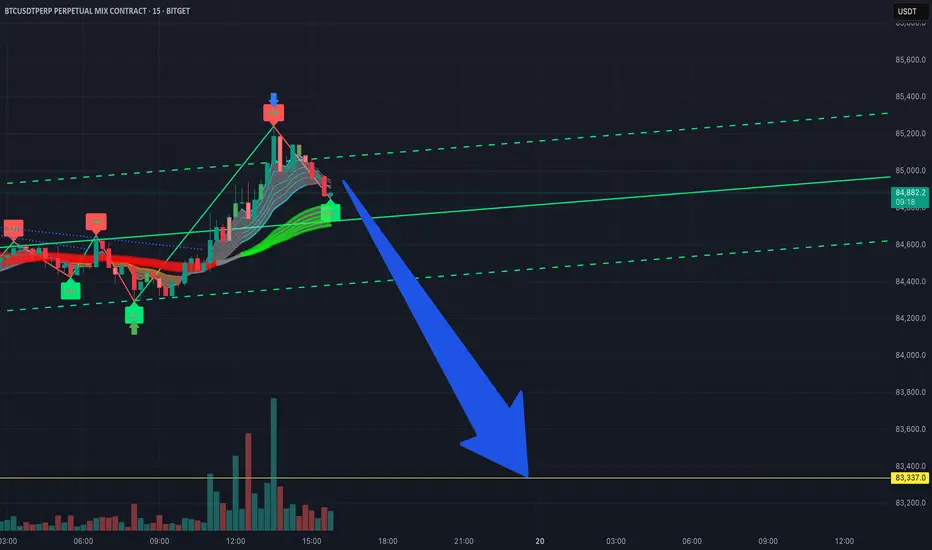
I’m estimating a short target for Bitcoin futures on the 15-minuLooking at the 15-minute chart on Bitget, I'm expecting a potential drop down to around 83,337. Just something to keep an eye on if you're in a short-term trade.
The BTC market is clearly in a sideways trendCurrently, the BTC market is clearly in a sideways trend 😶. The price is fluctuating between 83,000 and 86,000, presenting trading opportunities 🤝. Investors can try buying on dips and shorting at highs. The analysis is as follows: 👉
Market data shows that the BTC price has been supported around 83,000 several times recently 😏. When it reached this level last week, the trading volume surged, indicating a large amount of buying. The KDJ indicator shows an oversold condition at this point, suggesting a possible short-term rebound 🚀. However, the price encounters strong resistance at 86,000. Multiple attempts to break through have failed, and the selling pressure increases as the price approaches this level 😣. According to the Bollinger Bands indicator, 86,000 is close to the upper band, which is likely to trigger a pullback ⬇️.
Within this range, buying on dips is reasonable 👍. If the price drops to around 83,000, investors can buy moderately. In the long run, BTC is still in an uptrend. The short-term sideways movement may be an adjustment. Historically, new upward trends often follow similar sideways trends 💹. The support at 83,000 is strong. Even if it is briefly broken, the possibility of a sharp decline is small. When buying, set the stop-loss at 82,000, and there is a chance to make a profit when the price rebounds 💰.
Shorting at highs is also feasible 👌. When the price approaches 86,000, investors can establish short positions. The resistance here is significant, making it difficult for the price to rise. A pullback will enable short sellers to make a profit 😃. However, shorting is risky, as BTC may break through the resistance. Set the stop-loss at 87,000 when shorting, and close the position immediately if the resistance is broken 🙅♀️.
💰💰💰 BTCUSD💰💰💰
🎯 Sell@86000 - 85500
🎯 TP 84000 - 83000
Traders, if you're fond of this perspective or have your own insights regarding it, feel free to share in the comments. I'm really looking forward to reading your thoughts! 🤗
👇The accuracy rate of our daily signals has remained above 98% within a month! 📈 We sincerely welcome you to join our channel and share in the success with us! 🌟

Shorting Analysis on Bitcoin - Fxdollars- {15/04/2025}Educational Analysis says that BTCUSD may give countertrend opportunities from this range, according to my technical analysis.
Broker - BITSTAMP
So, my analysis is based on a top-down approach from weekly to trend range to internal trend range.
So my analysis comprises of two structures: 1) Break of structure on weekly range and 2) External pushback to fill the remaining fair value gap
Let's see what this pair brings to the table for us in the future.
Please check the comment section to see how this turned out.
DISCLAIMER:-
This is not an entry signal. THIS IS ONLY EDUCATIONAL PURPOSE ANALYSIS.
I have no concerns with your profit and loss from this analysis.
I HAVE NO CONCERNS WITH YOUR PROFIT OR LOSS,
Happy Trading, Fx Dollars.

BTCUSDT shortBTCUSDT has notably deviated from the 4-hour EMA50 — by as much as 2.8%, which is a significant move for this asset.
Additionally, the daily EMA50 is acting as strong resistance, holding the price down.
I expect a pullback within the next couple of days — key levels are marked on the chart.
Want to track such deviations automatically? Send me a DM — I’ll grant you access to the indicator.

BTCUSD Today's strategyYesterday, the price of Bitcoin increased, but the trading volume decreased, weakening the short-term upward momentum. However, in the long run, the market has sufficient liquidity. The active trading of a large number of investors supports price discovery, and it is likely to drive up the price when there are favorable factors.
It should be noted that the cryptocurrency market is highly volatile and uncertain. Although we are bullish on the price of Bitcoin today, unexpected factors may change its trend. When making investment decisions, investors should assess their risk tolerance and operate with caution.
BTCUSD
buy@83500-84500
tp:85500-86500
I hope this strategy will be helpful to you.
When you find yourself in a difficult situation and at a loss in trading, don't face it alone. Please get in touch with me. I'm always ready to fight side by side with you, avoid risks, and embark on a new journey towards stable profits.

Keep a close eye on the downward movement of BTC at all times.Today, BTC is in a sideways trend, with its price fluctuating in the range of 83,000 to 86,000. 📊
At present, there are no significant new developments in the area of tariffs. 👍
However, what we need to be vigilant about is that if the tariff situation deteriorates and triggers the market's safe - haven mechanism, a large amount of capital is highly likely to flow into the relatively stable gold and foreign exchange markets. 😟
This, in turn, could lead to a large - scale sell - off in the Bitcoin market. 💥
Therefore, it is recommended to consider short - selling at relatively high price points. 📉
The accuracy rate of our daily signals has remained above 98% throughout a month 📈! You are warmly welcome to follow us and join in on the success 🌟.
💰💰💰 BTCUSD 💰💰💰
🎯 Sell@84500 - 85500
🎯 TP 82500 - 81500
Traders, if you're fond of this perspective or have your own insights regarding it, feel free to share in the comments. I'm really looking forward to reading your thoughts! 🤗

BTCUSDT:Obtaining of the Latest Trading SignalsThe updated price of BTC has broken through the trend resistance. The only problem I see now is the lack of momentum after the breakthrough. Bitcoin will not be able to continue to rise. It will return to the channel and consolidate below 83,600. In this case, we will consider a continued decline. For the operation, wait for a rebound to go short.
Trading Strategy:
Sell@85500-84500
TP:82100-81100
The signals last week resulted in continuous profits, and accurate signals were shared daily.

At present, a selling phenomenon has emergedAt present, a selling phenomenon has emerged😰, and a large number of traders are waiting for the market to open⏰.
When other markets open on Monday, the situation of a large amount of capital flowing out to other trading fields also deserves attention. 😟
Especially the flows to the XAU/USD and USOIL markets, or other foreign exchange markets. 💱 The movement of funds to these areas might be influenced by economic news, geopolitical events, or simply portfolio re - balancing by investors. 📰
💰💰💰 BTCUSD 💰💰💰
💰💰💰 BTCUSD 💰💰💰
🎯 Sell@84000 - 84500
🎯 TP 82500 - 81500
Recently, the market has been extremely volatile 😱, which has led to the clearing of many traders' accounts or significant losses 😫. You can follow my signals and gradually recover your losses and achieve profitability 🌟💪.
Traders, if you're fond of this perspective or have your own insights regarding it, feel free to share in the comments. I'm really looking forward to reading your thoughts! 🤗

Short - term Upside & Mon. Outflow RiskAnalysis of the Price Trend of Bitcoin 📈: Short - term Upward Expectations 💰 and the Risk of Capital Outflow on Monday 💸
The current price of BTC is at 84,500 points. 📊
Considering various factors comprehensively, there is a possibility that the price will rise to around 86,500 points tomorrow. 🚀 This could be due to factors like positive market sentiment or recent trends in the cryptocurrency space. 💰
However, when other markets open on Monday, the situation of a large amount of capital flowing out to other trading fields also deserves attention. 😟
Especially the flows to the XAU/USD and USOIL markets, or other foreign exchange markets. 💱 The movement of funds to these areas might be influenced by economic news, geopolitical events, or simply portfolio re - balancing by investors. 📰
💰💰💰 BTCUSD 💰💰💰
🎯 Buy@84000 - 84500
🎯 TP 85500 - 86500
Recently, the market has been extremely volatile 😱, which has led to the clearing of many traders' accounts or significant losses 😫. You can follow my signals and gradually recover your losses and achieve profitability 🌟💪.
Traders, if you're fond of this perspective or have your own insights regarding it, feel free to share in the comments. I'm really looking forward to reading your thoughts! 🤗

BTC at $85,300: Technical Alerts & What Traders Must Act OnAfter BTC powerfully pierced the $83,000 level, it swiftly accelerated its ascent, surging to around $85,300. However, a bearish divergence signal emerged on the 4 - hour chart, clearly indicating a certain weakening of the short - term bullish momentum. At present, the price has pulled back to the crucial support level of $85,000.
In the event of a break below this level, BTC may further decline towards the zone spanning from $83,800 to $83,500. Regarding technical indicators, the Relative Strength Index (RSI) has retreated from the overbought zone to 62, and the red bars of the Moving Average Convergence Divergence (MACD) indicator have notably shrunk in volume, strongly suggesting an impending correction.
In the short run, close attention should be directed towards the performance at the pivotal $84,500 watershed. If BTC rebounds and firmly holds above $85,000, it could potentially retest the resistance zone between $85,300 and $85,500 once again. Conversely, if it breaks below $84,500 on high trading volume, the retracement is likely to persist.
From a trading strategy perspective, a wait - and - see stance is generally advisable. Aggressive traders might consider taking a short position with a light exposure within the $85,000 - $85,300 range, setting a stop - loss above $85,500. Prudent traders, on the other hand, are better off waiting for a low - entry long opportunity in the area between $83,500 and $84,000.
Investment itself doesn't carry risks; it's only when investment is out of control that risks arise. When trading, always remember not to act on impulse. I will share trading signals every day. All the signals have been accurate without any mistakes for a whole month. No matter what gains or losses you've had in the past, with my help, you have the hope of achieving a breakthrough in your investment.
Traders, if this concept fits your style or you have insights, comment! I'm keen to hear.

BTC Today's strategyCurrently, BTC is fluctuating upwards within an ascending channel, which closely resembles its price movement that began on March 10th. This suggests that, barring significant changes in the market environment, BTC prices are likely to continue their upward trend and move towards higher price ranges in the near future.
Meanwhile, investors should closely monitor various risk factors that could impact the market, such as changes in regulatory policies and fluctuations in the macroeconomic landscape, and adjust their investment strategies accordingly.
Buy@ 83,500 - 84,500
tp: 86,000 - 87,000
Hope this trading strategy is helpful to you. If you have different opinions, your feedback is most welcome.

#BTCUSDT shows signs of reversal📉 SHORT BYBIT:BTCUSDT.P from $82,125.0
🛡 Stop loss: $82,976.0
🕒 Timeframe: 4H
✅ Overview:
➡️ The BYBIT:BTCUSDT.P chart shows a rising wedge — a typical bearish pattern.
➡️ Price hit the upper wedge boundary and started to decline, breaking support.
➡️ A second top (Top 2) has formed on weakening volume, signaling a possible reversal.
➡️ The POC at $82,490.8 has been broken — price is holding below it, strengthening the bearish case.
🎯 TP Targets:
💎 TP 1: $81,430.0
💎 TP 2: $80,887.0
💎 TP 3: $80,485.0
📢 Additional scenario notes:
📢 Entry activates upon breakdown and consolidation below $82,125.
📢 Watch for increased volume at key TP levels for confirmation.
📢 A move above $82,976.0 invalidates the setup — stop placed just above key resistance and wedge top.
🚀 BYBIT:BTCUSDT.P shows signs of reversal — a corrective move to the downside is expected.

BTC/USD) rejected point analysis Read The ChaptianSMC Trading point update
This chart presents a bearish short-term technical analysis for Bitcoin (BTC/USD) on the 2-hour timeframe. Here’s a breakdown
---
Key Observations:
1. Downtrend Structure:
Price is forming lower highs and lower lows.
A clear downtrend is marked on the chart.
2. Rejection Zone:
The yellow highlighted area near $83,800–$84,000 is labeled as a “rejected point.”
Price touched this zone and got rejected again, confirming resistance.
3. 200 EMA (Exponential Moving Average):
The 200 EMA is at $82,291, acting as dynamic resistance. Price is currently below it, reinforcing bearish momentum.
4. Support Level / Target:
The yellow box at the bottom around $74,559 is marked as the support zone and target level.
This is the previous low and aligns with the lower boundary of the descending channel.
5. RSI (Relative Strength Index):
RSI is showing a potential bearish divergence and is pointing downward, suggesting weakening bullish momentum and a likely move lower.
Mr SMC Trading point
---
Trade Idea:
Bias: Bearish
Entry: Around $81,300–$82,000 (after rejection confirmation)
Target: $74,559 (support level)
Stop-loss: Could be placed just above the rejection zone, around $84,000
---
Pales support boost 🚀 analysis follow)

BTCUSD:You need to refer to this strategyPresident Trump of the United States suddenly announced the suspension of tariffs, which led to a significant change in market sentiment.
Since tariffs play a crucial role in global economic relations and market expectations, this unexpected move has caused investors to adjust their investment portfolios.
As the new tariff suspension policy has reduced market uncertainties to a certain extent, gold, which is usually regarded as a safe-haven asset, has been sold off.
Conversely, the price of BTC has soared, reflecting the market's rapid response to this major policy change.
If you're at a loss right now, don't face it alone. Please get in touch with me. We are always ready to fight side by side with you.

BTC | BEARISH Cycle Begins | $71KThere are a few tell signs that BTC has entered the bearish market.
If the price fails to maintain closing daily candles ABOVE the 70k area, there is a likelihood for a nasty Head and Shoulders pattern to form.
A key point to watch are the Bollinger Bands, which gives you an indication of the next possible zone to watch.
_____________________
BINANCE:BTCUSDT

BTCUSDT Next SupportsThe price is close to two long-term support lines which is likely to be tested in the next candles
