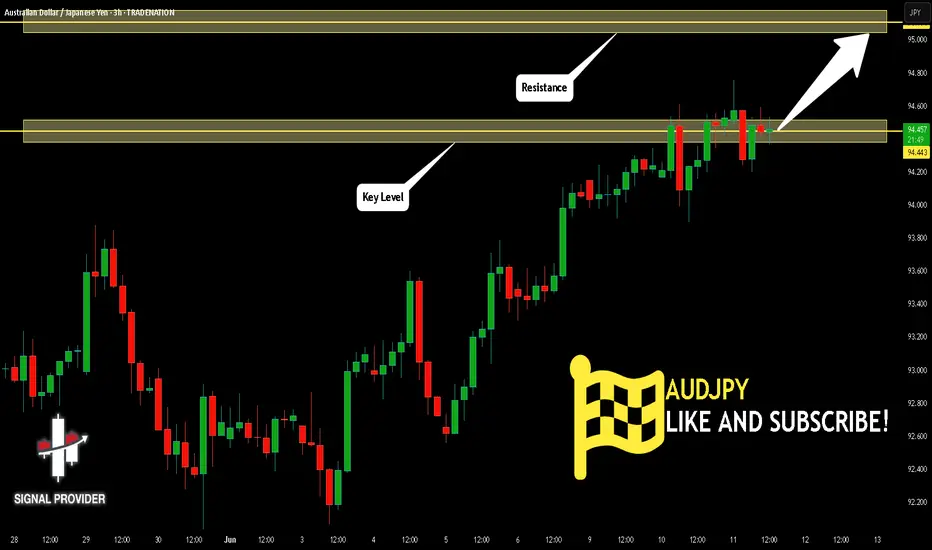
AUDJPY Is Bullish! Long!
Here is our detailed technical review for AUDJPY.
Time Frame: 3h
Current Trend: Bullish
Sentiment: Oversold (based on 7-period RSI)
Forecast: Bullish
The market is trading around a solid horizontal structure 94.443.
The above observations make me that the market will inevitably achieve 95.104 level.
P.S
We determine oversold/overbought condition with RSI indicator.
When it drops below 30 - the market is considered to be oversold.
When it bounces above 70 - the market is considered to be overbought.
Disclosure: I am part of Trade Nation's Influencer program and receive a monthly fee for using their TradingView charts in my analysis.
Like and subscribe and comment my ideas if you enjoy them!
Buy!
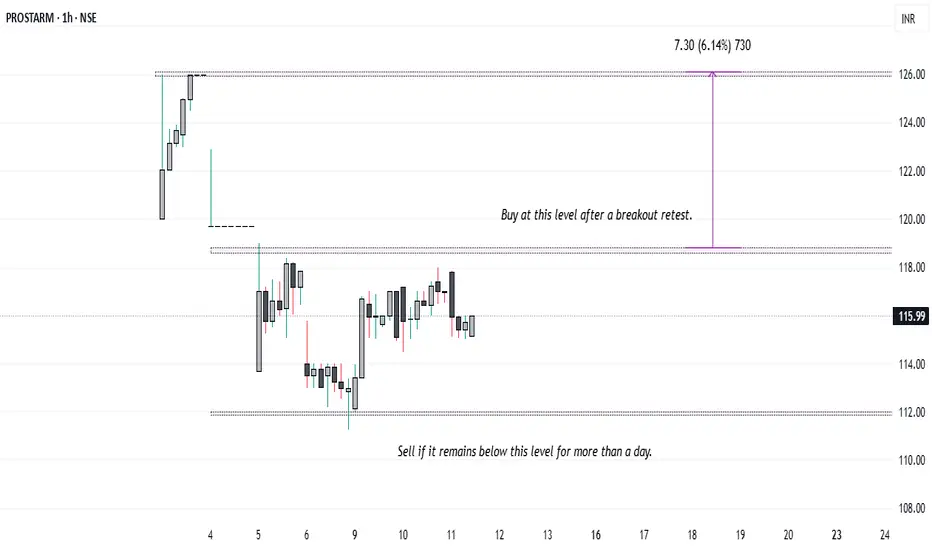
Prostarm Microfinance Ltd: Investment Update Buy, Sell, OR Hold Technical Outlook: Prostar Microfinance Ltd.
Current Market Structure:
Prostar Microfinance Ltd. is presently consolidating within a narrow trading range between ₹112 and ₹118. This range-bound movement indicates indecision in the market, with neither bulls nor bears taking full control at this stage.
Scenario-Based Strategic Guidance
1. Existing Shareholders (Including IPO Allottees):
Investors already holding shares—especially those allotted during the IPO—are advised to continue holding their positions while the stock remains above the key support level of ₹112. However, if the stock breaches this level on a daily close basis and sustains below ₹112 on the following trading session, it would signal a breakdown of the current support zone. In such a case, we recommend exiting the position and waiting for technical stabilization or a new bullish setup.
2. Prospective Buyers (No Current Holdings):
Investors looking to enter fresh positions should adopt a wait-and-watch approach until a clear breakout above ₹118 is observed. A breakout accompanied by significant volume and a confirmed close above ₹118 could offer a potential buying opportunity, with a near-term price target of ₹126.
3. Risk Monitoring:
A sustained move below ₹112 could open the downside toward the ₹105–₹100 levels. Hence, strict stop-loss discipline is crucial, especially for short-term traders and technical participants.
Summary :
| Scenario Action Plan
-------------------------- --------------------------------------------------
| Holding from IPO Hold above ₹112; exit if closes below and sustains
| No Holdings Buy only after a breakout and close above ₹118
| Post-Breakout First Target ₹126
Disclaimer: This is a technical outlook and should not be construed as investment advice. Investors are advised to consider their risk appetite, broader market conditions, and consult financial advisors before making investment decisions.
Doge Rocket End to End Cloud MoveThe idea basis is simple.
1) Full M pattern target did not fully hit, look for resistance that can send it lower to complete it.
2) Found the Daily Cloud End to End Move where we go to the very top and reject straight back down to fill out the M
We also have an inverse h&S showing 0.207 target
Good Luck

BX : First Attempt at Silent StockBlackstone has now decided to invest in Europe.
The stock is technically above the 50 and 200 period moving averages.
After leveling the trend line, an increase in volume was also observed.
In that case, holding a short-medium term or opening a long position with a reasonable risk/reward ratio in a small position size will not hurt us.
I have kept the stop-loss a little tighter now because even if the stop level comes in a sudden drop, it can be tried again. If that happens, I will share it as a new idea.
Risk/Reward Ratio : 3.00
Stop-Loss : 132.53
Take-Profit : 141.73

Strong Dollar, Shaky Gold: Is It Time to Buy?Gold has returned to a weaker stance, trading around $3,309 during the U.S. session. The U.S. dollar gained some positive momentum as markets leaned toward the possibility that the Federal Reserve will keep its policy unchanged in July following the May report, causing XAU/USD to drop lower into the weekend.
Additionally, U.S. economic data released on the same day continued to show signs of cooling. Specifically, weekly jobless claims came in higher than both the forecast and the previous week's figures, while the U.S. trade deficit narrowed significantly in May.
The index measuring the dollar's strength against a basket of six major currencies remained nearly unchanged. Meanwhile, the yield on 10-year U.S. Treasury bonds rose, and real yields climbed by 2 basis points, putting downward pressure on gold prices.
Nevertheless, gold still maintains its long-term uptrend. This correction is seen as a better buying opportunity.

$TSLA is making moves! 30% Upside Swing🚀 NASDAQ:TSLA is making moves!
The H5_S is almost there—just waiting for that green light 🟢 to lock in the entry!
🔥 Eyeing July 18th $325 Calls if we get the confirmation. Let’s see how this unfolds!
Not Financial Advice

GBPUSD – Holding the Uptrend, Eyeing Resistance BreakoutThe GBPUSD pair continues to respect a well-defined ascending channel on the H4 chart. Each time price retraces to the lower boundary, buying pressure has consistently stepped in. Currently, price is hovering near the channel’s lower edge and the EMA89 – forming a technical support area around 1.35370. If this zone holds, there is a strong potential for a rebound toward the resistance zone near 1.36100–1.36300, which has rejected price twice before.
From a news perspective, markets are awaiting the U.S. CPI report tomorrow. If inflation data comes in weaker, expectations for the Fed to cut interest rates will increase, putting pressure on the USD and allowing GBP to extend gains. Additionally, the Bank of England is expected to maintain a more hawkish stance due to persistent domestic inflation – which further supports the pound’s upward momentum.
Watching the EMA and lower channel boundary is key. If a clear bullish signal forms at this zone, a trend-following long strategy could carry a high probability of success.


GBP/USD LONG FROM SUPPORT
Hello, Friends!
GBP/USD pair is trading in a local uptrend which know by looking at the previous 1W candle which is green. On the 4H timeframe the pair is going down. The pair is oversold because the price is close to the lower band of the BB indicator. So we are looking to buy the pair with the lower BB line acting as support. The next target is 1.358 area.
Disclosure: I am part of Trade Nation's Influencer program and receive a monthly fee for using their TradingView charts in my analysis.
✅LIKE AND COMMENT MY IDEAS✅

GBP/CAD BULLISH BIAS RIGHT NOW| LONG
Hello, Friends!
GBP/CAD pair is trading in a local uptrend which know by looking at the previous 1W candle which is green. On the 1H timeframe the pair is going down. The pair is oversold because the price is close to the lower band of the BB indicator. So we are looking to buy the pair with the lower BB line acting as support. The next target is 1.853 area.
Disclosure: I am part of Trade Nation's Influencer program and receive a monthly fee for using their TradingView charts in my analysis.
✅LIKE AND COMMENT MY IDEAS✅

BITCOIN BULLS ARE GAINING STRENGTH|LONG
BITCOIN SIGNAL
Trade Direction: long
Entry Level: 103,835.09
Target Level: 109,309.96
Stop Loss: 100,185.18
RISK PROFILE
Risk level: medium
Suggested risk: 1%
Timeframe: 9h
Disclosure: I am part of Trade Nation's Influencer program and receive a monthly fee for using their TradingView charts in my analysis.
✅LIKE AND COMMENT MY IDEAS✅

GOLD Is Very Bullish! Buy!
Please, check our technical outlook for GOLD.
Time Frame: 9h
Current Trend: Bullish
Sentiment: Oversold (based on 7-period RSI)
Forecast: Bullish
The market is approaching a key horizontal level 3,327.72.
Considering the today's price action, probabilities will be high to see a movement to 3,385.41.
P.S
Please, note that an oversold/overbought condition can last for a long time, and therefore being oversold/overbought doesn't mean a price rally will come soon, or at all.
Disclosure: I am part of Trade Nation's Influencer program and receive a monthly fee for using their TradingView charts in my analysis.
Like and subscribe and comment my ideas if you enjoy them!

USDJPY Is Going Up! Long!
Here is our detailed technical review for USDJPY.
Time Frame: 2h
Current Trend: Bullish
Sentiment: Oversold (based on 7-period RSI)
Forecast: Bullish
The market is approaching a significant support area 144.671.
The underlined horizontal cluster clearly indicates a highly probable bullish movement with target 145.501 level.
P.S
The term oversold refers to a condition where an asset has traded lower in price and has the potential for a price bounce.
Overbought refers to market scenarios where the instrument is traded considerably higher than its fair value. Overvaluation is caused by market sentiments when there is positive news.
Disclosure: I am part of Trade Nation's Influencer program and receive a monthly fee for using their TradingView charts in my analysis.
Like and subscribe and comment my ideas if you enjoy them!

EURJPY Will Go Higher From Support! Buy!
Please, check our technical outlook for EURJPY.
Time Frame: 6h
Current Trend: Bullish
Sentiment: Oversold (based on 7-period RSI)
Forecast: Bullish
The price is testing a key support 164.890.
Current market trend & oversold RSI makes me think that buyers will push the price. I will anticipate a bullish movement at least to 166.192 level.
P.S
Overbought describes a period of time where there has been a significant and consistent upward move in price over a period of time without much pullback.
Disclosure: I am part of Trade Nation's Influencer program and receive a monthly fee for using their TradingView charts in my analysis.
Like and subscribe and comment my ideas if you enjoy them!

BTCUSDT – Uptrend Intact, Resistance Still in PlayBitcoin is currently moving within a healthy uptrend, showing a strong rebound from the 101,332 USDT support zone—aligned with the EMA 89 on the daily chart. Following an impressive recovery, the price is now approaching the 111,892 resistance area, which previously halted the bullish momentum and triggered a deep correction.
However, recent price action shows signs of stalling, suggesting a possible consolidation phase. If BTC fails to break above 111,892, a mild pullback toward the 104,000–101,000 zone may occur to build fresh momentum for the next bullish leg.
From a news perspective, the crypto market is buoyed by improving sentiment after weak U.S. job data, increasing the odds of an earlier-than-expected Fed rate cut. Additionally, continued capital inflows into Bitcoin ETFs are supporting medium-term upside potential for BTC.

sand buy spot "🌟 Welcome to Golden Candle! 🌟
We're a team of 📈 passionate traders 📉 who love sharing our 🔍 technical analysis insights 🔎 with the TradingView community. 🌎
Our goal is to provide 💡 valuable perspectives 💡 on market trends and patterns, but 🚫 please note that our analyses are not intended as buy or sell recommendations. 🚫
Instead, they reflect our own 💭 personal attitudes and thoughts. 💭
Follow along and 📚 learn 📚 from our analyses! 📊💡"

EURUSD – Still a chance to rebound if support holdsEURUSD has recently pulled back slightly after approaching resistance near the rising trendline. Currently, price is heading back to retest the support zone around 1.13200 – a key confluence area with the EMA89 and previous swing lows. This is a crucial level. If it holds, there’s a strong possibility for a rebound toward the 1.14280 resistance area.
On the H4 timeframe, the price structure remains within an ascending channel with no clear signs of trend reversal. The formation of higher lows suggests that buying pressure is still present. Notably, if this week’s CPI, PPI, and NFP data come in weaker than expected, market sentiment may shift further toward the idea of an early Fed rate cut – potentially providing a lift for EURUSD.
Additionally, rising geopolitical tensions could increase risk aversion, weakening the USD and further supporting the euro.

DEFI altcoin - The Trump Crypto ConnectionThe relationship between decentralized finance (DeFi), the Trump family, and Kevin O’Leary in 2025 centers around their public involvement in the crypto and blockchain space, particularly highlighted by their participation in events like DeFi World 2025 and specific DeFi projects tied to their names or influence.
The Trump family, notably Donald Trump Jr. and former President Donald Trump, has increasingly engaged with DeFi and cryptocurrency. Donald Trump Jr. spoke at the DeFi World 2025 Conference in Denver on February 26, alongside Kevin O’Leary, signaling a growing interest in blockchain’s potential to shape finance. Posts on X from DeFi confirm their appearances, with Trump Jr. scheduled at 3:00 PM and O’Leary at 3:45 PM, reflecting a shared platform to promote DeFi’s future. Beyond this event, the Trump family is linked to World Liberty Financial (WLFI), a DeFi project launched in September 2024. WLFI aims to democratize crypto lending and borrowing while reinforcing the U.S. dollar’s dominance, operating on Aave’s v3 protocol.
Kevin O’Leary, a Canadian investor and “Shark Tank” star, has been a vocal DeFi advocate since at least 2021, when he invested heavily in DeFi Ventures (later renamed WonderFi), targeting 4.5–8% yields on crypto assets. His participation in DeFi World 2025 alongside Trump Jr. underscores his ongoing commitment. O’Leary sees DeFi as a way to bypass financial middlemen, predicting it could transform trading within years. His practical involvement contrasts with the Trump family’s more symbolic and policy-driven engagement, though both share a bullish stance on crypto’s future.
Fully diluted Market Cap of only $2.64Mil.


USDCHF Will Go Higher! Long!
Please, check our technical outlook for USDCHF.
Time Frame: 9h
Current Trend: Bullish
Sentiment: Oversold (based on 7-period RSI)
Forecast: Bullish
The market is testing a major horizontal structure 0.821.
Taking into consideration the structure & trend analysis, I believe that the market will reach 0.832 level soon.
P.S
The term oversold refers to a condition where an asset has traded lower in price and has the potential for a price bounce.
Overbought refers to market scenarios where the instrument is traded considerably higher than its fair value. Overvaluation is caused by market sentiments when there is positive news.
Disclosure: I am part of Trade Nation's Influencer program and receive a monthly fee for using their TradingView charts in my analysis.
Like and subscribe and comment my ideas if you enjoy them!

EURUSD : Dips Below 1.1400 The EUR/USD pair is currently hovering around 1.141, reflecting a clear lack of buying interest. As Friday's U.S. session unfolded, the pair lost momentum and slipped below the 1.1400 mark—an important psychological level that had previously offered support.
This decline came on the back of stronger-than-expected U.S. nonfarm payrolls data for May, which surprised markets and reignited confidence in the resilience of the American labor market. As a result, the U.S. dollar gained significant strength, bolstered by the growing probability that the Federal Reserve will hold interest rates steady through the next two policy meetings.

EURUSD – Upper Boundary Holds Firm, Watch for a PullbackEURUSD remains well-contained within its ascending channel, but price has repeatedly been rejected near the upper boundary around the 1.14790 zone. This highlights that profit-taking pressure near the previous high remains significant.
The current bounce from the lower boundary is unconvincing, as the recent highs are not surpassing the previous ones. While EMA34 and EMA89 are still offering support, if price moves toward 1.14790 but fails to break through, a “minor double top” pattern may emerge—raising the risk of a short-term correction.
A notable scenario would be a rejection at 1.14790, followed by a pullback toward the lower channel boundary around 1.13870. A break below this level could temporarily invalidate the short-term uptrend.
At this stage, buyers should remain patient and only look to re-enter near clear support zones. Avoid chasing entries near major resistance areas.

BTCUSDT – Is This Just Resistance or a Bull Trap?Bitcoin is now pressing against the key resistance zone around $106,920—a level that has consistently rejected price advances in recent weeks. After a decent recovery, momentum seems to be stalling, and often, that quiet before the storm tells us more than a breakout ever could.
Zooming in, we may be witnessing a classic fake-out formation—a subtle move above resistance to trap late buyers before a sharp reversal. If bulls can’t firmly hold this zone, BTC could very well slip back toward $101,500, aligned with the broader descending trendline.
⚠️ This isn’t about calling tops—it’s about respecting structure and understanding exhaustion. Resistance exists for a reason, and history reminds us: when enthusiasm fades, gravity returns.

Gold on Watch: Rebound or Just Another Dip?Hey traders, let’s take a closer look at what’s happening with gold this week.
After multiple failed attempts to break above the 3,385 USD resistance, XAUUSD has continued to retreat, searching for fresh momentum. As the new week begins, price action is hovering around the psychological 3,330 USD level, with no clear signs of a bottom yet.
At the moment, gold remains under pressure, weighed down by the U.S. dollar’s strength in global markets. Still, weekly sentiment among analysts is split: 7 are bullish, 6 are bearish, and 1 expects prices to hold steady.
Retail traders, however, seem more optimistic. In a recent online poll of 256 participants, 66% predicted gold would rise, 15% saw a drop, and the rest expected sideways movement.
All eyes are now on upcoming economic news that could tip the scales. Personally, I'm leaning toward a recovery — how about you?
