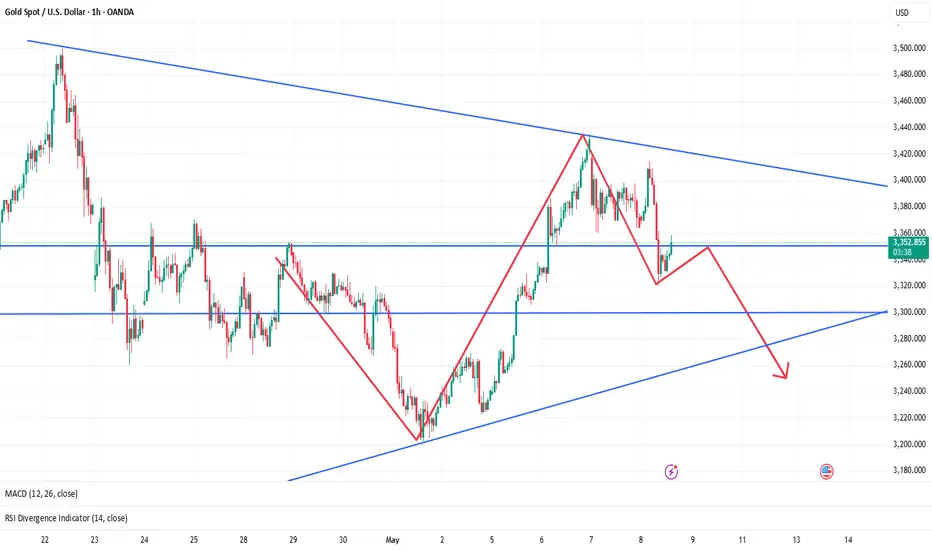
Gold is expected to fall below 3300, continue to short gold!Fundamentals:
1. Pay attention to whether the geopolitical conflicts escalate, including the situation between India and Pakistan, Russia and Ukraine, and the situation between the United States and Iran, etc.
Technical aspects:
Although the gold price gradually rebounded after hitting 3320 points, the current rebound momentum is relatively weak. The gold price has turned from strong to weak, and the short-term "M"-shaped top structure formed by 3435 points and 3414 points above has suppressed the upward space of the gold price. Therefore, we still focus on shorting gold after the rebound. First, we focus on the resistance area of 3355-3365 points above. If the gold price rebound fails to successfully break through this area, the gold price will fall again and is expected to continue to fall to around 3280 points.
Trading strategy:
Consider shorting gold after gold rebounds to the 3355-3365 area, target price: 3340
Candlestick Analysis

Simple Break of Structure BoS Trading Strategy Explained
One of the best and reliable strategies to trade break of structure BoS is to apply multiple time frame analysis.
In this article, I will teach you my break of structure gold forex trading strategy. You will get a complete step-by-step guide with examples.
Let's start with a quick theory and let me explain to you what is break of structure BoS in Smart Money Concept SMC trading.
In a bullish trend, break of structure BoS is an important event that signifies a continuation of an uptrend. It is based on a violation and a candle close above the level of the last higher high (HH).
After a breakout, the broken level becomes the first strong support for trend-following buying.
Check multiple examples of confirmed breaks of structure BoS on GBPNZD forex pair on a weekly time frame.
In a downtrend, Break of Structure BoS means a bearish trend continuation . Break of Structure is considered to be confirmed when a candle closes below the level of the last lower low (LL).
The broken key level becomes the closest strong support for buying.
That's the example of a healthy downtrend on USDJPY forex pair on a daily. Each break of structure BoS pushed the prices lower, providing a strong signal to sell.
What newbie traders do incorrectly, they trade break of structure without a confirmation strategy, and it leads to substantial losses.
Though GBPCHF is trading in a bullish trend and though each BoS provided a trend-following signal. The price retraced significantly lower below the broken structure before the growth resumed.
When the price retests a broken structure after BoS in a bullish trend, start lower time frame analysis.
If you identified a break of structure on a daily, analyze 4h/1h time frames.
If on a 4H, then 30/15 minutes.
After the price sets a new higher high with BoS in uptrend, it usually starts trading in a minor bearish trend on lower time frames.
With our strategy, your signal to buy will be a retest of a broken structure and a consequent bullish Change of Character CHoCH . That will provide an accurate bullish signal.
In a bearish trend, analyze the lower time frames after a retest of a broken structure. Your signal to sell will be a bearish Change of Character CHoCH.
Look at a price action on EURCHF on a daily.
We see a strong bullish trend and a confirmed Break of Structure BoS.
According to the rules of our trading strategy, we start analyzing 4h/1h time frames after a retest of a broken level of the last Higher High.
Our signal to buy is an intraday bullish CHoCH. We open a long trade after that with the stop loss below the intraday lows and take profit being a current high.
That's how simple this strategy is.
Multiple time frame analysis provides the extra level of security.
Strong lower time frame confirmation substantially increases the win ratio of a trading setup.
❤️Please, support my work with like, thank you!❤️
I am part of Trade Nation's Influencer program and receive a monthly fee for using their TradingView charts in my analysis.

Golden stage low area: 3285-3275!Fundamentals:
1. Focus on Trump's dynamics and tariff-related issues;
2. Pay attention to whether geopolitical conflicts will escalate, including the situation between India and Pakistan, Russia and Ukraine, and the situation between the United States and Iran, etc.
The current expectation of interest rate cuts has declined, and the tariff storm has cooled down. At the same time, the market is betting on a further trend correction, which may cause capital outflows from the market, which will further hit gold bulls!
Technical aspects:
As I expected in my previous article, gold is expected to fall below 3300. Sure enough, gold has shown signs of falling below 3300. In the current structure, gold may further extend to the 3280-3270 area, which is also an important support area of primary concern in the short term; and as gold fell sharply, the market was bearish, and short-term resistance also moved down to the 3315-3325 area.
Trading strategy:
1. Consider the shorting opportunity after gold rebounds to the 3315-3325 area, TP: 3300-3290
2. Consider the longing opportunity after gold falls to the 3285-3275 area, TP: 3300-3310

GOLD (XAUUSD): Retest of ATH Soon!Gold broke through a daily significant horizontal resistance level yesterday and closed above it.
It appears that the bullish trend is likely to continue, with the price expected to retest its all-time high soon.
After reaching this level, be prepared for a potential breakout that could drive prices even higher.

USDJPY: Pullback From Resistance 🇺🇸🇯🇵
There is a high chance that USDJPY will retrace
from the underlined blue resistance cluster.
As a confirmation signal, I spotted a double top pattern
on that on an hourly time frame.
Closest support - 145.1
❤️Please, support my work with like, thank you!❤️
I am part of Trade Nation's Influencer program and receive a monthly fee for using their TradingView charts in my analysis.

AUDCAD: More Growth Ahead?! 🇦🇺🇨🇦
AUDCAD bounced strongly after a test of a significant daily/intraday support cluster.
The price managed to violate a resistance line of a falling wedge
pattern and close above that on an hourly time frame.
I expect a movement higher at least to 0.8944
❤️Please, support my work with like, thank you!❤️

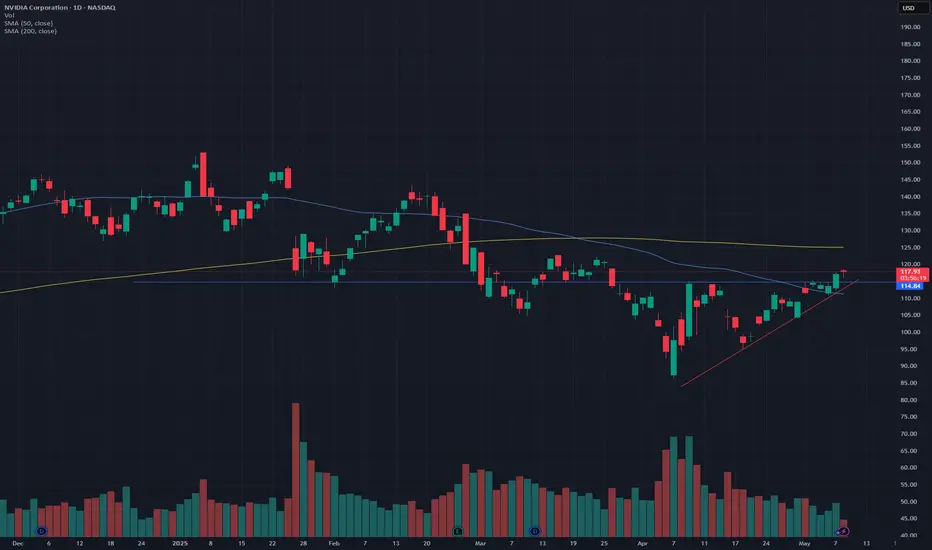
NVIDIA: Breakout above ascending triangle, retest confirmationNVDA has been forming an ascending triangle over the past few weeks, with declining volume. Finally, it broke out yesterday, and today, we had a retest of the resistance line. NVDA was down about 1% earlier today however after a successful retest of the resistance line, it is now up 0.8% at the time of writing.
In terms of support, it seems the price has successfully bounced off the 50-Day SMA line. While an ascending triangle is bullish, the 200-Day SMA is likely going to be a point of resistance (around $125).
This is amid the renewed overall market strength and the news related to the reduced limitations of exporting AI chips - which is contributing to the momentum.
Please note: Not financial advice.
DOLLAR INDEX (DXY): Bullish Reversal Confirmed?!
Dollar Index formed an inverted head and shoulders pattern on a daily.
Its neckline breakout is a strong bullish reversal signal.
The broken neckline of the pattern turns into a significant support now.
We can expect a growth from that at least to 101.25 resistance.
❤️Please, support my work with like, thank you!❤️

Pay attention to 3360 and go short if it does not break🗞News side:
1. China and the United States hold talks on trade issues
2. India-Pakistan conflict escalates again
3. Geopolitical risks
📈Technical aspects:
At present, gold has fallen below the trend line support. In the short term, we should focus on the battle for 3360. This point is not only the previous support-to-resistance level, but also the key signal for judging the trend reversal. If it cannot hold on to this position, the short trend will continue; if it recovers effectively, it may return to above 3400. Before losing the defensive line (the last starting and falling point) 3360-3362, the bears will still have the upper hand. It just so happens that the 4H lifeline is also in the 3360-3362 area. If the suppression is successful, the price will enter the 3362-3284 area from the lifeline to the lower track.
The rebound layout of the US market operation is short-selling, with the target at 3340-3330, and further support at 3310-3300.
If you agree with this view, or have a better idea, please leave a message in the comment area. I look forward to hearing different voices.
TVC:GOLD FOREXCOM:XAUUSD FXOPEN:XAUUSD FX:XAUUSD OANDA:XAUUSD
AUD/USD Looks Set for a PullbackThe V-bottom on AUD/USD certainly delivered for bulls, considering its low was printed amid a flurry of panicked headlines with the Aussie was on the brink of falling below 59c. But we're yet to see a pullback, even though it has been teasing one for a few weeks.
But given AUD/USD formed its most bearish day since April 4 on Wednesday, with a bearish engulfing candle which saw a false break of 65c before closing beneath its 200-day SMA, perhaps a pullback is imminent.
Also note the bearish divergence on the RSI (2).
Bears could seek to fade into moves towards the 200-day SMA, and retain a bearish bias while prices remain beneath Wednesday's high. A retest of the April VPOC at 0.6371 seems feasible, and a break beneath the 0.6344 low assumes a much larger correction is underway.
Matt Simpson, Market Analyst at City Index and Forex.com

No BREAKDOWN! Yet to decide the trend! As we can see despite the break it managed to close inside the structure and hence still the indecision remains in view as till it sustains either side of the structure, no directional move can be expected but gaps can be created due to war like situation leading to sluggishness in the market so plan your trades accordingly and keep watching

Is Horizen $ZEN The Next Big Crypto Investment Opportunity?In May 2025, LSE:ZEN has reached a strong imbalance trading at $8 after a period of consolidation for a couple of months. A morning star price action candlestick pattern is being created This imbalance suggests that buying pressure is outweighing selling pressure, creating a favorable environment for potential upward momentum.
Horizen is a privacy-focused blockchain platform that combines security, scalability, and decentralization. Built with a strong emphasis on privacy and interoperability, Horizen offers a unique ecosystem that includes sidechains (called ZenApps), a decentralized treasury system, and a robust node network. The native cryptocurrency, LSE:ZEN , powers transactions, staking, and governance within the Horizen ecosystem.

Dxy bullish idea for next week - MMBMThis is a bullish possibility for DXY price action for next week.
Monthly:
- Price took a swing low confluent with a bearish breaker in discount and closed above the level;
Weekly:
- Price Took a swing below monthly swing with a bullish reaction. If this week closes with above previous weeks high, it confirms a bullish weekly swing;
Daily:
- Monday printed the likelly low of the week
- A daily fair value gap is open allow with a volume imballance around monday open signalling bullish price action - a retrace to these levels would be a good buying opportunity.
4h:
- there is a market maker buy model in play.
- as of now, price already printed an intermidiate term low signalling that low risk buy myght have happened.
News forecast:
- I expect NFP to either retrace price to daily fvg or daily volume imbalance and leave a bullish reaction.
- FOMC next week might bring the volatility to complete the mmbm
Thank you for reading

Gold is expected to pull back, short gold!Fundamentals:
Focus on the Fed's interest rate decision and Powell's speech;
I think the Fed will keep the interest rate decision unchanged this time, at least it will not announce a rate cut this time, which may suppress the gold market;
Technical aspects:
Before the Fed's interest rate decision, gold is currently in a volatile state. However, relatively speaking, it is currently in a volatile and bearish state, with short-term resistance in the 3395-3405 area; and gold has repeatedly tested the 3370-3360 below during the retracement process. After multiple tests, gold may be more likely to break through this support area; the key support below is in the 3360-3350 area, followed by the 3320-3310 area.
Trading strategy:
Consider shorting gold in the 3395-3405 area, TP: 3370-3360

AUDCAD SHORT Market structure bearish on HTFs DW
Entry at both Daily and Weekly AOi
Weekly Rejection at AOi
Previous Weekly Structure Point
Daily Rejection At AOi
Daily previous Structure point
Around Psychological Level 0.89500
H4 Candlestick rejection
Levels 5.41
Entry 95%
REMEMBER : Trading is a Game Of Probability
: Manage Your Risk
: Be Patient
: Every Moment Is Unique
: Rinse, Wash, Repeat!
: Christ is King.


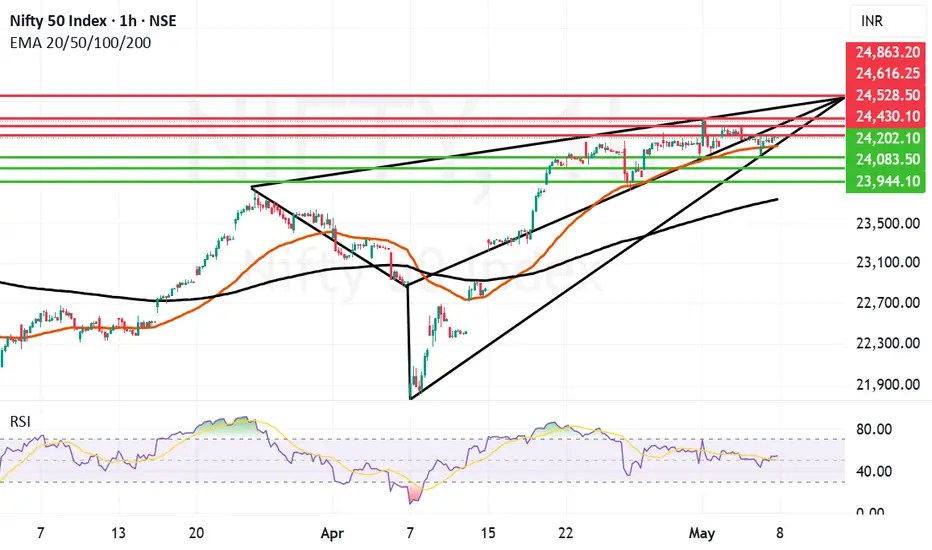
Very Strong performance by Nifty to close in Positive todayDespite the fear of escalation of tensions at Indo-Pak border and Indian carrying out Operation Sindoor Nifty closed in Green today. This signifies the strength of Indian market, India as an Economy and India as a country. Very few would have imagined that Indian markets will close in Green today when the market begun early morning. The situation still remains fluid/dynamic and explosive. so still investors should keep stop losses and trailing stop losses in place.
Supports for Nifty remain at: 24315 (Strong Mother line for hourly chart), 24202, 24083, 23944 and 23754 (Strong Father Line support). Below 23754 Bears can take control of the market and drag it towards 23K.
Resistances For Nifty remain at: 24430, 24528, 24616 and 24863. Closing above 24863 can empower Bulls in a big way to Pull Index towards 25K+ levels.
Disclaimer: The above information is provided for educational purpose, analysis and paper trading only. Please don't treat this as a buy or sell recommendation for the stock or index. The Techno-Funda analysis is based on data that is more than 3 months old. Supports and Resistances are determined by historic past peaks and Valley in the chart. Many other indicators and patterns like EMA, RSI, MACD, Volumes, Fibonacci, parallel channel etc. use historic data which is 3 months or older cyclical points. There is no guarantee they will work in future as markets are highly volatile and swings in prices are also due to macro and micro factors based on actions taken by the company as well as region and global events. Equity investment is subject to risks. I or my clients or family members might have positions in the stocks that we mention in our educational posts. We will not be responsible for any Profit or loss that may occur due to any financial decision taken based on any data provided in this message. Do consult your investment advisor before taking any financial decisions. Stop losses should be an important part of any investment in equity.
Gold is in shock again, will the short position continue?🗞News side:
1. Tariffs push up inflation and slow down the economy, and the Federal Reserve may be in trouble
2. The situation between India and Pakistan escalates again
📈Technical aspects:
Gold experienced a big plunge yesterday, and today it bottomed out near 3275 again and then started to rebound. The current gold price is caught in a wide range of fluctuations, with long and short positions frequently alternating to impact the market, making it difficult to form a unilateral trend. At present, the gold price once rebounded to around 3330. If the gold price breaks through the 3336 line, short-term trading in the European market may touch the upper level near 3350, or even the 3365 line. Today's market cannot chase the rise and sell the fall. Overall, it is still a wide range of fluctuations. It should be a violent roller coaster before the subsequent surge. The European session relies on the low point of 3310 to step back as a defense, focusing on the upper 3350-3360, and further close the key resistance of 3370. The short-term focus below is the support of 3280-3290.
If you agree with this view, or have a better idea, please leave a message in the comment area. I look forward to hearing different voices.
OANDA:XAUUSD FX:XAUUSD FXOPEN:XAUUSD FOREXCOM:XAUUSD TVC:GOLD

Start buying goldTechnical aspects:
Gold has bottomed out and rebounded after a rapid decline today. It has now stood above 3330. When gold breaks above 3330, it has to some extent broken away from the technical repair structure and began to tend to a bullish pattern in terms of form. Although gold is currently under pressure in the 3350-3360 area, as the center of gravity of gold moves up, the support below has gradually moved up to the 3325-3315 area. So I think there is still room for gold to rise, and it may continue to rebound to the 3345-3365 area.
Trading strategy: Consider going long on gold in the 3330-3320 area, TP: 3345-3365

1st PublishPatience is key in trading. I'm waiting for confirmation on EUR/USD. What would your setup look like?

GBPAUD: 2 Strong Bearish Confirmations 🇬🇧🇦🇺
GBPAUD is in a very bearish price action after a test
of the underlined horizontal resistance.
The price formed an inverted cup and handle pattern
and violated its neckline and a support line of a rising
parallel channel on an hourly time frame.
Probabilities will be high to see a decline at least to 2.064 support.
❤️Please, support my work with like, thank you!❤️

LODHA - Bearish due to forming double Top pattern
TECHNICAL INDICATORS -
DOUBLE TOP PATTERN formation -
NSE:LODHA has formed a double top pattern indicating strong downward pressure for the stock
Double top is characterized by two consecutive peaks on a price chart, with a dip or low between them & subsequent breakout
VOLUME SPIKE -
the stock has recently shown two large volume spikes indicating strong upcoming momentum for the stock
Generally volumes increase before a significant price movement
SHOOTING STAR candlestick -
the stock has formed a shooting star candlestick recently indicating trend reversal for it ie from upward movement to downward movement
Shooting star is characterized by a small body at bottom and a long upper shadow of a candlestick
GAP-DOWN BREAKOUT -
the stock has broken out of the pattern with a gap-down indicating very strong downward pressure
PROFIT TARGET -
1200
STOP LOSS -
1325
