#NZDCHF short term buying opportunityprice forming Higher highs and Higher lows in bullish channel and currently testing channel return line which also coincide with 4H time frame #demand area.
Also we have reverse bullish divergence and 30 minutes EMA acting as a Support just below the price.
All together gives confluences for this short term bullish idea
Channeltrend

#GBPAUD Short term selling opportunityAlthough in long-term view price is in bullish Daily and weekly move, but in short term price managed to form bearish market structure ( I mean 4H and 1H timeframe ) so its possible to look for selling opportunities but with extra cautious.
As we can see in the chart we have valid 4H bearish channel, price recently broke below supportive area which hold price higher for 3 time and now can act as a resistance, price also below 4H EMA and seems like going to test it again, price also around our channel middle line which can also act as resistance.

Parallel channel tight squeeze. BTCLong story short without going into to much detail.
BTC is currently trapped between 2 important parallel channel (blue hand drawn circle). confirmation of breakout in either direction is likely to mean volatility .
Breaking out of the top of the green channel likely mean bullish movements shortter.
Breaking down out of the white channel likely means bearish shortterm.
These channels have been valid S and R for over a year

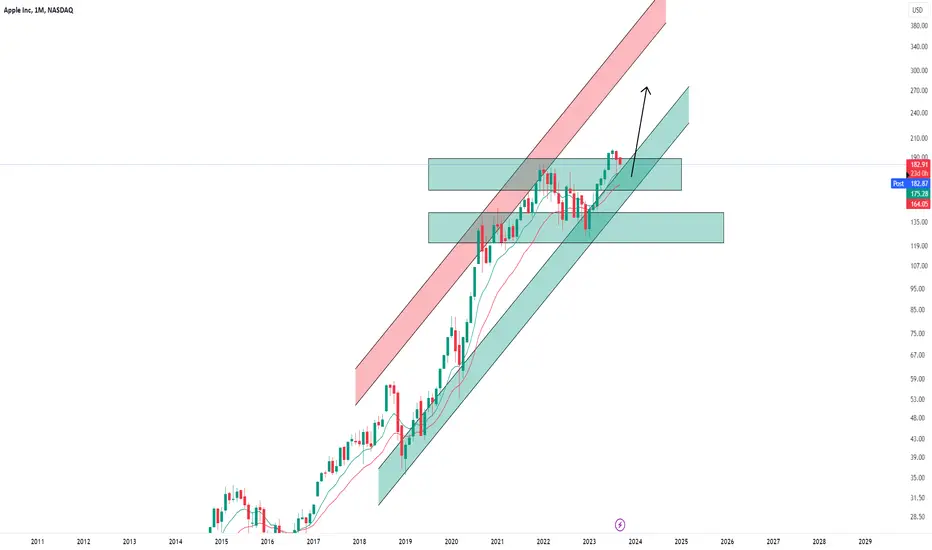
Apple (AAPL) -> The Company Of The FutureMy name is Philip, I am a German swing-trader with 4+ years of trading experience and I only trade stocks , crypto , options and indices 🖥️
I only focus on the higher timeframes because this allows me to massively capitalize on the major market swings and cycles without getting caught up in the short term noise.
This is how you build real long term wealth!
In today's anaylsis I want to take a look at the bigger picture on Apple.
Since the beginning of 2019 Apple stock has been trading in a solid rising channel and just recently rejected the support area at the $130 level.
Apple also perfectly broke above its previous all time high and is coming back for a retest after which I do expect another bullish rally to retest the channel resistance.
- - - - - - - - - - - - - - - - - - - -
I know that this is a quite simple trading approach but over the past 4 years I've realized that simplicity and consistency are much more important than any trading strategy.
Keep the long term vision🫡
Sell NZDJPY ChannelSell NZDJPY Channel
Sell Nzd/Jpy @ 86.75
Tp - 86.20
Sl - 87.00
Its Good chance to sell Now
Thank you

Nasdaq -> What's Happening Here?Hello Traders and Investors ,
my name is Philip and today I will provide a free and educational multi-timeframe technical analysis of the Nasdaq 💪
Looking at the macro view on the monthly timframe you can see that at the moment the Nasdaq is retesting massive resistance of the 10+ years rising channel formation so I do expect a monthly push lower.
Just two weeks ago the Nasdaq perfectly retested the 0.382 fibonacci retracement level and created a quite strong rejection towards the upside.
Looking at the daily timeframe you can see that Nas100 is currently retesting the neckline of the double top of July of 2023 and if Nas100 actually breaks above this structure zone, I do expect new highs going into 2024.
Keep in mind: Don't get caught up in short term moves and always look at the long term picture; building wealth is a marathon and not a quick sprint📈
Thank you for watching and I will see you tomorrow!
My previous analysis of this asset:

NIFTY INTRADAY LEVELS FOR 30/08/2023BUY ABOVE - 19370
SL - 19320
TARGETS - 19440,19470,19520
SELL BELOW - 19320
SL - 19370
TARGETS - 19230,19140,19070
Previous Day High - 19378
Previous Day Low - 19310
I am sharing NIFTY levels this levels acts as important support & resistance for intraday. if you want to trade with this levels wait for 15 min Candle closing above that levels. You can trade with breakout and reversal both.
In this channel, I share my expertise in trading strategies, technical analysis, and market trends to help you make informed decisions in your trading ventures.
Stay tuned for daily updates, in-depth market analyses, and real-time trading scenarios to witness firsthand how we transform from Zero to Hero in the trading world. My Only aim is to empower you with the knowledge and skills necessary to navigate the complexities of the financial markets successfully.
Based on price action major support & resistance's are here, the red lines acts as resistances, the green lines acts as supports. If the price breaks the support/resistance, it will move to the next support/resistance line. White lines indicates previous day high & low, high acts as a resistance & low acts as a support for next day.
Please NOTE: this levels are for intraday trading only.
Disclaimer - All information on this page is for educational purposes only,
we are not SEBI Registered, Please consult a SEBI registered financial advisor for your financial matters before investing And taking any decision. We are not responsible for any profit/loss you made.
Request your support and engagement by liking and commenting & follow to provide encouragement
HAPPY TRADING 👍

EURUSD will higher moveThs is my psychological view about eurusd .it has already printed double bottom in the 1H time frame but ,due to the weekly close of the market may be reduced the strength of the doble bottom .so to breakout this bearish channel EURUSD has to form a new patter like head and should to make a bullish reversal .so i am expecting a bullish bias for the next week on the EURUSD

HZN ASX Price action has been adhering to the uptrend channel for a while. Tested res @ 0.165 several times and a base forming on the 0.150 support with the 200 day EMA coming in.
Might look for a slight retrace and see whether this candle closes above the 10 day EMA. Has respected most of the uptrend with solid support & resistance points interacting with the 200 day EMA.
Watching:
28/8/23
0.160

US100 / NASDAQ looks enough UpDo you see Channel and Resistance.
It is good place for reverse for my opinion.
I will looking structure on H1/M15 or M5 for entry. target is new lower low

Happy Holiday And A Long Term Vision🎉Hello Traders and Investors ,
my name is Philip and I am on vacation for the next 4 days until Wednesday evening.
I won't post any analysis until then but here is a long term outlook on Bitcoin💰💰
Everything looks still very bullish despite the recent drop so keep your long term vision and I will certainly buy the dip.
Will be back on Wednesday!
Keep in mind: Don't get caught up in short term moves and always look at the long term picture; building wealth is a marathon and not a quick sprint📈
Thank you for your support and I will see you on Wednesday!
My previous analysis of this asset:

CETUS: A DEX on SUI and AptosThe chart is self-explanatory. The black horizontal lines are TP targets and the upside potential is great, while downside we already have support.
NFA. DYOR.

Crude oil buy channel formedBuy Channel formed in crude, so Buy at 6632
Target 1 (6685)and target 2 (6710)

Ar sideway bearish#Ar is in descending channel. Price will dump slowly with small pump dumps by staying in the channel.
Wait for channel breakout, if price goes above the channel then Bullish Scenario will be considered.

BTCI think King BTC is about to slaughter some bears here.. Not FA but don't fade the channel yet IMO

Ocean detailed analysis #ocean is ranging in 1hr descending channel. A short scalp exists with tight stoploss.
While On Big time frame, there is descending channel. If breakout happens then price will touch green lines otherwise red lines. support resistance provided.
Complete scalp signal provided in Grp.

Nasdaq -> -20% Massive Drop Ahead!Hello Traders and Investors ,
my name is Philip and today I will provide a free and educational multi-timeframe technical analysis of Nas100 💪
Looking at the macro view on the monthly timframe you can see that at the moment the Nasdaq is retesting massive resistance of the 10+ years rising channel formation so I do expect a monthly push lower.
With the recent strong rally on the Nasdaq it is quite likely that we will see at least a retest of the 0.382 weekly fibonacci retracement level which is then maybe acting as a first strong support area.
My last analysis on the Nasdaq perfectly played out with the Nasdaq breaking below the daily bullish trendline and creating a double top in the process - therefore everything is currently looking quite bearish and I do expect more daily downside.
Keep in mind: Don't get caught up in short term moves and always look at the long term picture; building wealth is a marathon and not a quick sprint📈
Thank you for watching and I will see you tomorrow!
My previous analysis of this asset:

KPR Mills: Headed for a channel tradeCMP: 668 | Industry: Textiles
P/E: 28.87 | Industry P/E: 33.2|ROE: 23.4% | ROCE: 24.4% |BV: INR 108 | EPS: INR 23.1| MCAP: 32,033 Cr.
Aggressive Entry: 668 | Resistance Levels: 710 | 756 | 801 Stop Loss: 598
Confirmation entry levels > 680 | CCI: 92| EMA (9d): 658.7 | S. RSI: 72
Analysis: KPR Mills formed its last bottom in December 2022 at 485. Post that the stocks have been forming new higher highs and higher lows within a parallel channel with decent consolidation of 4 – 5 weeks on average before every rally to new monthly highs. The red line indicates the channel bandwidth line and a close above this line would indicate a confirmation to trade up to and beyond channel resistance levels. Entries at current levels can be taken for 710 levels and a strong support stands at 600, a close below which will hit the stoploss.

EurUsd -> There Is Your Bullish Plan!Hello Traders and Investors ,
my name is Philip and today I will provide a free and educational multi-timeframe technical analysis of EurUsd 💪
EurUsd just perfectly retested and already rejected the 0.618 fibonacci level in confluence with a retest of previous support which was after the break turned strong resistance.
EurUsd is also now approaching weekly support and also the bottom of the solid rising channel so after some bullish rejection it will be quite likely that EurUsd provides more short term bullish upside.
With the moving averages shifting bearish on EurUsd just a couple of days ago, there is no need to look for a long setup now - Instead I am waiting for the inverted head and shoulders to play out and then I am looking for longs on a retest of the neckline.
Keep in mind: Don't get caught up in short term moves and always look at the long term picture; building wealth is a marathon and not a quick sprint📈
Thank you for watching and I will see you tomorrow!
My previous analysis of this asset:

USDCAD, D1 - Reaction on resistance levelPrice reacted on resistance level made of upper channel band and 61.8% Fibo. Expected some move down. Trade carefully!

USDCHF - The price is forming a correction to the downside!The price is in the major down channel and forming a ascending channel within the major channel that will help the price to continue further downfall.

Chart pattern: ChannelA channel is a pattern used in the technical analysis of financial markets that defines the movement of the price of an asset between the upper and lower lines of the pattern (parallel lines). Channels can be bullish, bearish, or sideways.
They are reversal patterns, meaning they indicate a signal for a change in trend.
When it comes to trading them, there are different ways to do so. We can trade within the channel, aiming for the opposite end of the line we are situated on. Alternatively, we can trade the trend change. The trend change can be traded once the channel is broken, either within it or by waiting for the price to break the pattern. This latter option is riskier, but it can lead to greater profits as the trading begins at a point with a higher projected movement. (🇬🇧)

GBPUSD - Reversal and Huge uptrend is in progressThe price is brought back to the major channel. Though the price was broke out the Major channel, it was quickly recovered and the price is well within the Major channel.
We can see inverse H&S and the price is heading upwards
