GOLD - A long squeeze of support could trigger growthFX:XAUUSD continues to consolidate, Friday's long squeeze (false breakdown) of support provides an opportunity for growth amid geopolitical issues...
The dollar is strengthening against the backdrop of Thursday's economic data and Trump's geopolitical actions, but against this backdrop, gold is behaving quite cautiously and looks quite strong.
Trump said that tariffs on eight European countries could rise to 25% if Greenland is not sold to the US - more tariffs and an escalation of the trade war could lead to a strong market reaction.
In the new trading week, we are awaiting Trump's speech (high volatility possible), US GDP, Core PCE, and PMI. The data may set the medium-term tone for the market...
Resistance levels: 4593, 4621, 4639
Support levels: 4581, 4561, 4550
The long squeeze has shifted the market imbalance towards buyers. Locally, we are seeing consolidation in the 4581-4593 zone. A close above 4593 or a retest of 4581 could trigger further growth within the current trend
Best regards, R. Linda!
Chart Patterns

The Trade That Changed Me ForeverThere was a trade years ago that worked perfectly.
Not because it was lucky.
Not because the market was easy.
But because I didn’t think.
Everything was already decided.
Structure was clear. Risk was defined.
I just executed.
And that moment stayed with me.
Think about driving.
The road changes.
Traffic changes.
Conditions are never the same.
Yet you don’t overthink every move.
You don’t debate the steering or the brakes.
You just drive.
Because repetition turned chaos into instinct.
That’s exactly what happened with my trading.
Flawless Execution Is the Turning Point
That trade taught me something simple:
Trading becomes profitable when execution becomes automatic.
When price reaches your level, there’s no conversation.
No hesitation... No emotion... No noise...
YOU. JUST. ACT.
I didn’t feel excitement.
I didn’t feel fear.
I felt calm.
When execution becomes second nature, trading stops being heavy, and starts flowing... Just like driving.
Question for you:
When did trading start to feel natural for you? or are you still forcing every decision?
⚠️ Disclaimer: This is not financial advice. Always do your own research and manage risk properly.
📚 Stick to your trading plan regarding entries, risk, and management.
Good luck! 🍀
All Strategies Are Good; If Managed Properly!
~ Richard Nasr

Gold Price Respects Ascending Trend Line - Next Target 4,680Hello traders! Here’s my technical outlook on XAUUSD (4H) based on the current chart structure shown in the screenshot. XAUUSD is trading within a broader bullish structure, supported by a well-defined ascending trend line that has guided price action since the market formed a solid base and started to grow. After the initial recovery, gold transitioned into a consolidation range, where price moved sideways, showing temporary balance between buyers and sellers. This range was eventually resolved to the upside with a clean breakout, confirming renewed bullish momentum. Following the breakout, price continued higher along the rising trend line, forming higher highs and higher lows. During this advance, the market experienced several false breakouts and shallow corrections, all of which were absorbed above the trend line, highlighting strong demand on pullbacks. The area around 4,540–4,560 is clearly defined as a Buyer Zone / Support Level, where previous resistance flipped into support and buyers repeatedly stepped in. Currently, XAUUSD is trading above the Buyer Zone and holding above the ascending trend line, which keeps the bullish structure intact. Price is now approaching the Seller Zone / Resistance Level around 4,660–4,680, which aligns with a descending resistance line from prior highs. This area represents a key supply zone where selling pressure may emerge and cause a reaction or short-term consolidation. My scenario: as long as XAUUSD remains above the Buyer Zone and continues to respect the rising trend line, the bullish bias remains valid. I expect buyers to defend pullbacks into support and attempt a continuation move toward the 4,680 Resistance Level (TP1). A clean breakout and acceptance above this resistance would confirm further bullish continuation and open the door for higher targets. However, a strong rejection from the Seller Zone followed by a decisive breakdown below the Buyer Zone and trend line would weaken the bullish structure and signal a deeper corrective move. For now, price is at a key decision area near resistance, and patience with proper risk management is essential. Please share this idea with your friends and click Boost 🚀

Gold Weekly Levels: Break above 4630 → 4720/4725🔱 GOLD WEEKLY SNAPSHOT — EXECUTIVE SUMMARY (NEW WEEK | JAN 2026)
✨ Bullish bias stays active for the week — but the upside is capped
🧲 Fresh overhead sell-side liquidity: 4630–4635 = first magnet
🟣 Max overbought + January ceiling: 4720–4725
📌 Expectation: limited upside from Point C in January
🧲 Fresh buy-side liquidity : 4500–4510 = preferred reload area
🛡 Bull structure invalidation: 4450 — break below invalidates outlook
🎯 Bull targets: first 4630–4635 → on valid breakout, ext 4720–4725
🏦 Core play: accumulate dips 4500–4510 reduce risk into 4630–4635
________________________________________
🗳️ Gold Weekly Scenarios — What’s Your Play?
Which path do you have for XAUUSD next week?
🅰️ Hold 4500–4510 → accumulate zone performs → rotation into 4630–4635
🅱️ Early sweep below 4510 → reclaim 4500–4510 → squeeze into 4630–4635
🅲 Direct drive into 4630–4635 → reaction/rejection → dip back toward 4500–4510 for reload
🅳 Break below 4450 → bullish outlook invalidated → downside opens further (risk-off shift)
Your key levels: 4500–4510 (buy-side) / 4450 (invalidation) / 4630–4635 (sell-side) / 4720–4725 (max-out)
________________________________________
🔥 GOLD WEEKLY SNAPSHOT — BY PROJECTSYNDICATE
🏆 Swing Structure
Gold remains in a bull-controlled tape for the new week, with the plan centered around dip accumulation + controlled upside targets:
• 4500–4510 is the fresh buy-side liquidity zone and the preferred area to build/scale long exposure.
• Bulls’ first major objective is 4630–4635, which is fresh sell-side liquidity — expect profit-taking, supply, and reaction risk there.
• If price breaks and holds above 4630–4635 (valid breakout), the market can extend into 4720–4725, defined as:
o max overbought zone
o AB swing 1.62 extension
o January 2026 max-out ceiling (expectation: limited upside beyond this in January)
• 4450 is the line in the sand: a break below invalidates the bullish outlook and exposes broader downside risk.
________________________________________
📈 Trend
Higher-timeframe bias: Bullish (new week)
Tactical: Two-phase week
Phase 1: Dip Accumulation & Rotation Higher
• Bulls ideally defend the 4500–4510 zone
• Accumulation/reloading happens on dips
• Rotation targets the overhead liquidity magnet 4630–4635
Phase 2: Breakout Decision at Supply
• 4630–4635 becomes the decision zone
• If rejected: expect rotation lower / reload behavior (watch 4500–4510 again)
• If valid breakout: extension unlocks toward 4720–4725 (January max-out zone)
________________________________________
🛡 Supports — Demand / Buy-Side Liquidity Zones
✅ 4500–4510 (Fresh buy-side liquidity)
• Primary dip-buy / accumulation zone this week
• Expect strongest bid response / “reload” behavior here
⚠️ 4450 (Bullish invalidation level)
• Break below = bullish thesis invalidated
• Opens risk for further downside continuation (structure shifts)
________________________________________
🚧 Resistances — Upside Objectives / Liquidity Zones
🎯 4630–4635 (Fresh sell-side liquidity)
• Primary bull target for the week
• High probability reaction zone (scale out / reduce risk)
🚀 4720–4725 (Max overbought + AB 1.62 extension | Jan 2026 max-out)
• Only in play after a valid breakout beyond 4630–4635
• Treated as January’s ceiling — upside expected to be limited from Point C this month
• High-risk zone for chasing longs; prioritize execution + protection
________________________________________
🧭 Bias Next Week
Primary bias: Bullish
What you’re trading this week:
• Bulls: accumulate dips 4500–4510 → target 4630–4635 → breakout continuation toward 4720–4725
• Bears: look for rejection signals at 4630–4635 and especially 4720–4725 (January max-out)
________________________________________
⚖️ Base Case Scenario (Most likely path)
Early week: dips are bought / accumulation near 4500–4510
Mid-week: rotation higher toward 4630–4635
Late week: decision at 4630–4635
• If acceptance occurs → extension attempt toward 4720–4725
• If rejection occurs → pullback for reload toward 4500–4510
________________________________________
🚀 Breakout / Invalidation Triggers
✅ Bullish continuation trigger
• Strong push into 4630–4635 and clean breakout/acceptance above it
• Opens the path to 4720–4725
⚠️ Supply reaction trigger
• Tap/sweep into 4630–4635 + rejection behavior (stall/wicks/displacement down)
• Signals pullback risk back toward 4500–4510
🛑 Bullish invalidation trigger
• Break below 4450
• Bullish outlook invalidated; downside opens further
________________________________________
🔓 Bull / Bear Structural Lines (Updated)
🟢 Bull control zone: Above 4500–4510 (dip-buy regime intact)
🟡 Transition / decision zone: 4630–4635
🟣 January max-out zone: 4720–4725
🔴 Invalidation line: Below 4450
________________________________________
🧭 Recommended Strategy Framework (Updated)
1️⃣ Primary Play — Accumulate the dips (with structure)
Idea: bullish week → build exposure where liquidity is fresh
• Scale longs near 4500–4510
• Prefer confirmation via stabilization/reclaim behavior
• Keep risk defined with 4450 as the structural line
2️⃣ Profit-taking Plan — Sell into the first magnet
• Scale out into 4630–4635 (fresh sell-side liquidity)
• Tighten risk aggressively as price enters the zone
• Assume reaction risk increases near 4635
3️⃣ Breakout Play — Only if price proves acceptance
• If 4630–4635 breaks and holds → target 4720–4725
• Treat 4720–4725 as January max-out: reduce risk quickly, don’t overstay
________________________________________
✅ Weekly Levels
• 4720–4725: January max-out / max overbought / AB 1.62 extension
• 4630–4635: fresh sell-side liquidity (primary bull target / reaction zone)
• 4500–4510: fresh buy-side liquidity (dip accumulation zone)
• 4450: bullish invalidation (break below flips the outlook)

GOLD 1H CHART ROUTE MAP UPDATE & TRADING PLAN FOR THE WEEKHey Everyone,
Please see our 1h chart levels and targets for the coming week.
We are seeing price play between two weighted levels with a gap above at 4598 and a gap below at 4539, as support. We will need to see ema5 cross and lock on either weighted level to determine the next range.
We will see levels tested side by side until one of the weighted levels break and lock to confirm direction for the next range.
We will keep the above in mind when taking buys from dips. Our updated levels and weighted levels will allow us to track the movement down and then catch bounces up.
We will continue to buy dips using our support levels taking 20 to 40 pips. As stated before each of our level structures give 20 to 40 pip bounces, which is enough for a nice entry and exit. If you back test the levels we shared every week for the past 24 months, you can see how effectively they were used to trade with or against short/mid term swings and trends.
The swing range give bigger bounces then our weighted levels that's the difference between weighted levels and swing ranges.
BULLISH TARGET
4598
EMA5 CROSS AND LOCK ABOVE 4598 WILL OPEN THE FOLLOWING BULLISH TARGETS
4634
EMA5 CROSS AND LOCK ABOVE 4634 WILL OPEN THE FOLLOWING BULLISH TARGETS
4666
EMA5 CROSS AND LOCK ABOVE 4666 WILL OPEN THE FOLLOWING BULLISH TARGETS
4700
EMA5 CROSS AND LOCK ABOVE 4700 WILL OPEN THE FOLLOWING BULLISH TARGETS
4729
BEARISH TARGETS
4564
EMA5 CROSS AND LOCK BELOW 4564 WILL OPEN THE FOLLOWING BEARISH TARGET
4539
EMA5 CROSS AND LOCK BELOW 4539 WILL OPEN THE FOLLOWING BEARISH TARGET
4496
EMA5 CROSS AND LOCK BELOW 4496 WILL OPEN THE SWING RANGE
4459
4427
As always, we will keep you all updated with regular updates throughout the week and how we manage the active ideas and setups. Thank you all for your likes, comments and follows, we really appreciate it!
Mr Gold
GoldViewFX

Geopolitical Tensions Keep Gold BidMacro & Fundamental Context
Escalating geopolitical risks, ongoing regional conflicts, and rising political uncertainty continue to drive risk-off sentiment across global markets.
In this environment:
The USD shows mixed reactions as demand for safety competes with expectations of policy flexibility.
Gold remains structurally supported as capital rotates into safe-haven assets amid uncertainty.
As long as global tensions remain unresolved, downside moves in Gold are likely to be corrective rather than trend-breaking.
Technical Structure (H1)
Gold remains in a bullish market structure, confirmed by multiple BOS (Break of Structure).
The current pullback is unfolding into stacked Fair Value Gaps (FVG) — a typical rebalancing phase in an uptrend.
No confirmed bearish structure break at this stage.
Key Price Zones
Intraday Resistance: 4,581
Upper FVG: 4,569.369
Mid FVG: 4,545.716 – 4,535.432
Deep FVG / Structure Support: 4,512.551
Scenarios (If – Then)
Scenario 1 – Bullish Rebalance
If price holds above 4,535.432 – 4,512.551, expect buyers to step in.
A recovery above 4,581 would reopen the path toward 4,620+.
Scenario 2 – Deeper Liquidity Sweep
A deeper pullback into 4,512.551 is still acceptable within the bullish structure.
Only a clear H1 close below 4,512.551 would weaken the bullish bias.
Summary
Gold is reacting to global uncertainty, not just technicals.
As long as geopolitical risks persist, buy-the-dip remains the dominant mindset.
Risk-off flows favor Gold.
Structure defines the bias.

#XAUUSD: +3000 Pips Buying Opportunity Targeting $5000! Dear Traders,
Gold has completed a small correction in both the daily and intraday timeframes. We believe the price will now move in an impulse move likely reaching our ultimate goal of $5000. Our initial targets are $4700, $4800 and finally $5000.
This is our view only so please conduct your own analysis.
Team Setupsfx_❤️🚀

(XAUUSD) Gold Bullish Setup After Sell-Side Liquidity SweepPrice swept sell-side liquidity below the higher timeframe demand and quickly reclaimed the range, signaling strong bullish intent.
This move appears to be a liquidity grab rather than a true breakdown, trapping late sellers.
Price is now reacting from a bullish re-entry / mitigation zone, where continuation to the upside is expected after bullish confirmation.
The primary objective is the range high supply, with a possible extension toward the higher timeframe premium supply zone.
Bias remains bullish as long as price holds above HTF demand.

Gold (XAUUSD) Bullish Breakout SetupGold is trading above a rising trendline, indicating sustained bullish structure.
Price is consolidating within a strong buying zone, and a confirmed breakout above 4623 may trigger further upside.
Key resistance levels are 4640, followed by the final target at 4659.
Bias remains bullish as long as price holds above the trendline support.
Proper risk management is advised.

EURUSD Short: Supply Holds, Bears in Control, Move To 1.1550Hello traders! Here’s a clear technical breakdown of EURUSD (3H) based on the current chart structure. EURUSD initially traded within a consolidation range, where price moved sideways after a prior decline, indicating temporary equilibrium between buyers and sellers. This range acted as a base for the next directional move. A confirmed breakout from the range triggered a bullish recovery, shifting short-term control to buyers. Following the breakout, price developed a well-defined ascending channel, marked by consistent higher highs and higher lows. Pullbacks during this phase were corrective and respected the channel structure, confirming sustained bullish momentum. However, as EURUSD approached the upper boundary of the channel, upside strength began to fade. A fake breakout above channel resistance signaled buyer exhaustion and increasing sell-side pressure at higher prices. Near the highs, price formed a clear rounding top pattern around a key pivot point, reflecting a gradual loss of bullish momentum rather than an impulsive reversal. This topping structure was followed by a breakdown below internal support, confirming a short-term shift in market control. After losing the ascending structure, EURUSD transitioned into a descending channel, establishing a bearish corrective phase characterized by lower highs and lower lows.
Currently, EURUSD is trading within the descending channel and moving toward a key Demand Zone around 1.1550, which aligns with previous structural support and historical reactions. This zone represents the next important area where selling momentum may slow and buyers could attempt a defensive response.
My primary scenario remains bearish as long as EURUSD stays below the 1.1680 Supply Zone and continues to respect the descending channel structure. Pullbacks into supply that show rejection can be viewed as potential continuation opportunities, with 1.1550 Demand Zone acting as the first downside target (TP1). A clean breakdown and acceptance below 1.1550 would open the door for a deeper bearish continuation toward lower demand levels. However, a strong bullish breakout and sustained acceptance above 1.1680 would invalidate the short bias and signal a possible transition back into consolidation or bullish recovery. Until such a breakout occurs, market structure favors sellers, and upside moves are considered corrective. Manage your risk!

Hellena | GOLD (4H): LONG to 161.8% Fibo 4728 .Colleagues, the price is updating its maximum, and I think we shouldn't stop there.
After re-marking the waves, I realized that it would be more correct to place wave “3” at the 4549 level, since 5 waves fit well into it.
This means that the price is now in wave “5,” which can be quite unpredictable, but if we look at the blue waves, we can assume that there is now a medium-term impulse wave “3,” which means we can apply Fibonacci extension levels and see the 161.8% level as the target.
But I don't want to take such a risk and will set a slightly lower target - in the 4728 area. At the moment, we need to be very careful.
Manage your capital correctly and competently! Only enter trades based on reliable patterns!

Gold 30-Min — Volume Buy Reversal Triggered⚡Base : Hanzo Trading Alpha Algorithm
The algorithm calculates volatility displacement vs liquidity recovery, identifying where probability meets imbalance.
It trades only where precision, volume, and manipulation intersect —only logic.
Technical Reasons
/ Direction — LONG / Reversal 4610 Area
☄️Bullish momentum confirmed through strong candle body.
☄️Structure shifted with higher-low near key demand base.
☄️Volume expanding confirms order-flow alignment upward.
☄️Buyers reclaimed imbalance with sustained clean break.
☄️Algorithm detects rising momentum under low liquidity.
⚙️ Hanzo Alpha Trading Protocol
The Alpha Candle defines the day’s real control zone — the first battle of momentum.
From this origin, the Volume Window reveals where the next precision strike begins.
⚙️ Hanzo Volume Window / Map
Window tracked from 10:30 — mapping true market behavior.
POC alignment exposes institutional bias and breakout potential zones.
⚙️ Hanzo Delta Window / Pulse
Delta window monitors real buying vs. selling power behind each move.
Tracks volume aggression to expose who controls the candle — buyers or sellers.
When Delta aligns with Volume Map, momentum becomes undeniable.
yesterday
Note
☄️ we add inner Reversal 4596 : 4599 Area . ( bearish Reversal zone )
and we will Target 4560 Zone

Silver Strength (XAG/USD) – Safe-Haven Demand Fuels Upside📝 Description 🔍 Setup (Market Structure) FX:XAGUSD
XAG/USD continues to show strong bullish structure on the H1 timeframe.
Price has respected a well-defined demand zone with multiple retests and rejections, confirming strong buyer interest. Silver is trading above EMA and Ichimoku cloud support, signaling trend continuation rather than exhaustion.
The broader backdrop supports metals as safe-haven assets, keeping the upside bias intact.
📍 Support & Resistance
🟡 Key Demand / Support Zone: 85.00 – 87.00
🟢 1st Resistance: 98.00
🟢 2nd Resistance / Extension Target: 101.00
Trend strength remains valid above demand with higher-high structure intact
🌍 Fundamental Context
1.Rising geopolitical tensions and trade-related uncertainty
2.Investors rotating into safe-haven assets like Silver
3.Risk-off sentiment continues to support precious metals
#XAGUSD #Silver #PreciousMetals #SafeHaven #ForexTrading #TechnicalAnalysis #PriceAction #TradingView #Kabhi_TA_Trading
⚠️ Disclaimer
This analysis is for educational purposes only.
Markets are volatile — always manage risk properly and use a stop-loss.
💬 Support the Idea 👍 Like if you’re bullish on Silver
💬 Comment: Breakout continuation or pullback first? 🔁 Share with traders watching metals

Trendline Resistance SetupThis chart represents a detailed intraday analysis of gold prices, focusing on key levels and potential price movements for January 19, 2026. The chart highlights crucial support and resistance zones, trendline resistance, and expected price reactions at various levels. Key strategies include waiting for a breakout above 4620.851 for potential upside, or monitoring a break below 4657.992 for potential downside. The final target is set at 4550.000, providing a clear risk-to-reward setup for traders.

DASHUSDT | Don't FOMO buy now...Here is where you enterHello traders,
DASH has went ape mode the last couple of days reaching 70% in a single day peeking at $96.85. Buying here would not be very smart. Price is already overextended.
I can see that price has already formed a complete 5 impulsive waves and now is about to do an ABC correction.
My zone of interest to re-buy again would be between $53-$63
DASH goal's in this cycles will surpass $300 with ease.
Good Luck!

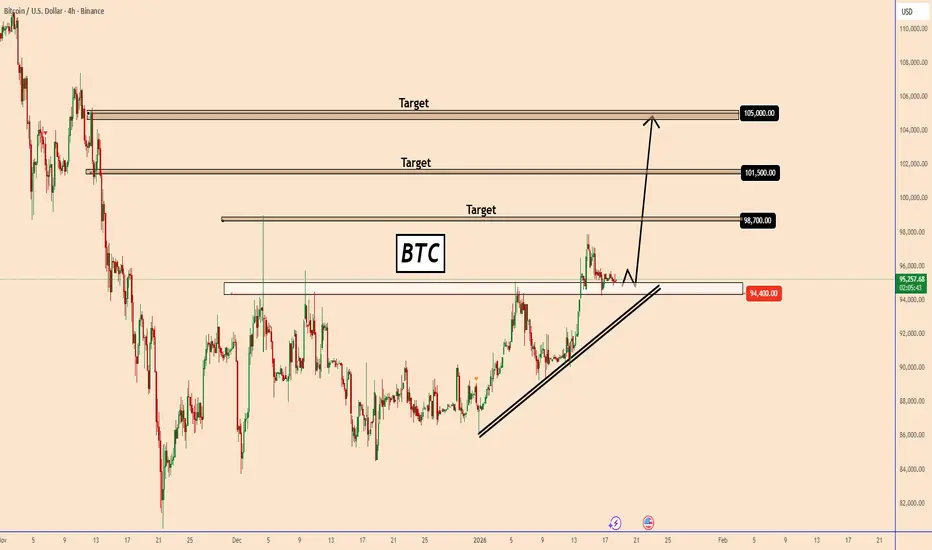
BTC: Breakout Confirmed – Bulls Defend 94,400 SupportBTC: Breakout Confirmed – Bulls Defend 94,400 Support
Four days ago BTC managed to break through a strong resistance area that has now turned into resistance.
The price has been holding above 94400 for several days after the breakout, showing strong bullish momentum.
As long as the price is rising again, this is increasing the chances of BTC rising further.
Main targets:
98700
101500
105000
You may find more details in the chart!
Thank you and Good Luck!
❤️PS: Please support with a like or comment if you find this analysis useful for your trading day❤️
XAUUSD: Holds Key Support - Buyers Aim for $4,720 ResistanceHello everyone, here is my breakdown of the current XAUUSD setup.
Market Analysis
XAUUSD is trading within a broader bullish market structure, supported by a rising trend line that has guided price action from the recent swing lows. Earlier in the move, gold advanced inside a well-defined upward channel, confirming strong buyer control with consistent higher highs and higher lows. This bullish leg eventually led to a breakout attempt near the upper boundary of the channel, after which price experienced a sharp corrective move and transitioned into a consolidation phase. Following the correction, XAUUSD formed a range, where price moved sideways as buyers and sellers reached temporary equilibrium. This range acted as an accumulation zone before the next directional move. Price eventually broke out of the range to the upside, signaling renewed bullish momentum. However, shortly after the breakout, a fake breakout occurred on the downside, where price briefly dipped below support but was quickly reclaimed by buyers, reinforcing demand strength.
Currently, price is holding above a clearly defined Support Zone around 4,650, which aligns with the former range high and a key structural level. This area is now acting as demand after the successful breakout and retest. On the upside, XAUUSD is approaching a major Resistance Zone near 4,720, where selling pressure has previously emerged. The recent price action shows controlled consolidation above support, suggesting continuation rather than distribution.
My Scenario & Strategy
My primary scenario remains bullish as long as XAUUSD holds above the 4,650 Support Zone and continues to respect the rising trend line. In this case, I expect buyers to remain in control and attempt another push toward the 4,720 Resistance Zone (TP1). A clean breakout and acceptance above this resistance would confirm bullish continuation and open the door for further upside expansion.
However, a strong rejection from resistance followed by a decisive breakdown below the 4,650 support would weaken the bullish bias and signal a deeper corrective move. Until that happens, the overall structure favors buyers, and pullbacks into support are viewed as potential continuation opportunities.
That’s the setup I’m tracking. Thank you for your attention, and always manage your risk.

EURUSD Descending Channel Points to Further Downside To 1.1560Hello traders! Here’s a clear technical breakdown of EURUSD (3H) based on the chart structure shown in the screenshot. EURUSD initially traded inside a well-defined ascending channel, confirming a bullish recovery phase after forming a base from the prior decline. Price respected the rising support line and produced higher highs and higher lows, showing strong buyer control. During this bullish phase, the market experienced several breakouts and fake breakouts near the upper boundary of the channel, signaling increasing volatility and early signs of exhaustion. As price approached the upper resistance area, buying momentum weakened, and the market failed to sustain acceptance above the highs. Near the top of the structure, EURUSD formed a clear turnaround and distribution phase, followed by a loss of bullish momentum. Price then broke below the ascending channel, confirming a structural shift. After this breakdown, the market transitioned into a descending channel, where price is now forming lower highs and lower lows. This confirms that sellers have taken short-term control, and bullish moves are now corrective in nature. A key Seller Zone / Resistance Level around 1.1680 was tested multiple times after the breakdown. Each attempt to reclaim this area resulted in rejection, reinforcing it as a strong supply zone. Recent price action shows continued respect of the descending channel resistance, with pullbacks failing and momentum favoring the downside. Currently, EURUSD is trading below resistance and is moving toward the Buyer Zone and Support Level around 1.1560, which aligns with previous structure and demand. This area represents the next key reaction zone and the primary downside objective (TP1). A reaction or temporary pause may occur there, but structurally it remains a bearish continuation zone unless buyers regain control. My scenario: as long as EURUSD stays below the 1.1680 Resistance / Seller Zone and continues to respect the descending channel, the bearish bias remains valid. I expect sellers to push price toward the 1.1560 Support / Buyer Zone (TP1). A clean breakdown and acceptance below this level would open the door for a deeper bearish continuation. However, a strong bullish breakout and acceptance back above 1.1680 would invalidate the short scenario and suggest a shift back toward consolidation or recovery. For now, market structure clearly favors sellers. Please share this idea with your friends and click Boost 🚀

ES Weekly Levels: Reversal Zone 6865–6875 → Target 6950/6955🔱 ES WEEKLY SNAPSHOT — EXECUTIVE SUMMARY (NEW WEEK | JAN 2026)
✨ Bull reversal setup is the focus — but weakness remains until key sell-side is reclaimed
🧲 Fresh overhead sell-side liquidity / bear FVG: 6950 plus key level 6955
📌 Context: ES gapped down at the open → signals continued weakness into the week
🧲 Bull FVG + preferred reversal zone: 6865–6875 = best area to scale into longs
🛡 Failure zone / risk-off trigger: loss of 6865–6875 opens downside to 6795 → 6790
🎯 Bull target: 6950 fresh liquidity pocket overhead
🏦 Core play: scale buys 6865–6875, manage risk if the zone fails, take profit into 6950–6955
🗳️ ES Weekly Scenarios — What’s Your Play?
Which path do you have for ES next week?
🅰️ Hold 6865–6875 → reversal works → rotation into 6925 → tag 6950
🅱️ Sweep below 6875 → reclaim 6865–6875 → squeeze into 6950–6955
🅲 Drive into 6950–6955 → rejection from sell-side → pullback toward 6925 → 6865
🅳 Break/hold below 6865–6875 → weakness confirms → downside opens to 6795 → 6790
Your key levels: 6955 / 6925 / 6865 / 6795 / 6790
Your FVGs: 6950 (bear sell-side) / 6865–6875 bull reversal

ETHEREUM - Bullish market behavior pattern. Confirmation?BINANCE:ETHUSDT is forming a consolidation in the $3300 zone in a “descending wedge” pattern, which is a relatively bullish market behavior model.
The market is reacting to the improvement in the fundamental background, inflows of funds are increasing, and buyers are showing interest. Local trends are beginning to change for the better. After the rally, Bitcoin is trying to consolidate above 94-95K, and if it succeeds, we will have a green signal.
Ethereum is consolidating and fighting for the 3300 zone after implementing a U-formation pattern. Overall, there are signs of bulls in the market, and if buyers keep the price above 3300, the market will have an opportunity for growth.
The price is forming a descending wedge against the backdrop of a local bull market. A close above 3315 will be a confirming signal for growth.
Resistance levels: 3315, 3383, 3450
Support levels: 3300, 3281
The price has consolidated above 3300 and above 3315, as well as broken the resistance of the descending wedge. If the bulls keep the price above these key areas, another bull run may form...
Best regards, R. Linda!

XAUUSD – Strong Opening Gap: When Smart Money Doesn’t WaitHello everyone, Domic here.
Looking at the XAUUSD H4 chart at the start of the week, what really stands out to me is not where price is trading, but the strong bullish GAP that appeared right at the market open.
In context, this GAP formed at a very “logical” spot. Prior to the weekend, price had been holding firmly above both the EMA 34 and EMA 89, with the bullish structure fully intact. At the same time, price action was getting increasingly compressed around the 4,580–4,610 zone. When a market consolidates long enough within a strong uptrend, it often doesn’t climb step by step anymore — it jumps to a new price level. This opening GAP is a direct result of that built-up pressure.
As for the catalyst, the story behind this move is fairly familiar. Expectations of a dovish Fed stance going into next year remain unchanged, US bond yields have failed to establish a fresh upside trend, while geopolitical risks continue to support safe-haven demand. When such factors emerge or intensify over the weekend, the market often cannot react immediately. Instead, the adjustment gets priced in at the weekly open. Combined with thinner liquidity during the Asian session, it doesn’t take much buying pressure for a GAP like this to form.
The key question many traders are asking now is: will this GAP get filled?
My view is quite straightforward — not every GAP is meant to be filled . In a strong uptrend, GAPs often act as continuation signals rather than inefficiencies to be corrected. At this stage, my preferred scenario is a technical pullback toward the upper part of the GAP to “retest conviction,” followed by a continuation toward the 4,700–4,730 area. If that zone is broken decisively, it would add another layer of confirmation to the medium-term bullish trend.

XAUUSD – The Bullish Trend Remains DominantHello traders, I observe that XAUUSD is currently in a phase where fundamental news and technical structure are fully aligned in favor of a bullish trend.
On the fundamental side , global risk-off sentiment has intensified after U.S. President Donald Trump proposed new tariffs on eight European countries related to the Greenland issue . This rise in geopolitical and financial uncertainty has driven strong capital flows into safe-haven assets , pushing gold to new record highs and reinforcing its key role in central banks’ reserve strategies.
On the chart, the bullish structure remains clearly intact, with higher lows forming consistently. Price continues to respect the ascending trendline and is well supported by the Ichimoku system. The 4,610 – 4,615 zone stands out as a critical near-term support; as long as price holds above this area, the bullish trend remains valid. The next upside target is projected around 4,730 – 4,735.
👉 In conclusion , as long as global uncertainty persists and safe-haven flows remain active, XAUUSD retains a strong foundation to continue higher, and higher price levels are likely to be tested sooner rather than later.

XAUUSD | Head & Shoulders Pullback Into Weekly SupportHI!
Gold is still trading within a broader bullish structure, while the visible head & shoulders pattern points to a short-term corrective move, not a full trend reversal.
Price is approaching a strong confluence zone made up of weekly support + S&D area, where a bullish reaction is likely.
Long setup idea (buy-the-dip scenario):
Entry zone: 4,540 – 4,535 (marked S&D area)
Invalidation: Clean break and close below 4,520
Target 1: 4,590 (previous range high)
Target 2: 4,610 – 4,620 (continuation toward trend highs)
As long as price holds above weekly support, any dip into the highlighted zone is considered a pullback within an uptrend rather than a bearish reversal.
Disclaimer: As part of ThinkMarkets’ Influencer Program, I am sponsored to share and publish their charts in my analysis.
