Bearish drop?USD/CHF is reacting to a resistance level, which is a pullback resistance aligning with the 61.8% Fibonacci retracement, and could decline from this level toward our take-profit target.
Entry: 0.8279
Why we like it:
There is a pullback resistance level that lines up with the 61.8% Fibonacci retracement.
Stop loss: 0.8313
Why we like it:
There is a pullback resistance level.
Take profit: 0.8226
Why we like it:
There is a pullback support level.
Enjoying your TradingView experience? Review us!
Please be advised that the information presented on TradingView is provided to Vantage (‘Vantage Global Limited’, ‘we’) by a third-party provider (‘Everest Fortune Group’). Please be reminded that you are solely responsible for the trading decisions on your account. There is a very high degree of risk involved in trading. Any information and/or content is intended entirely for research, educational and informational purposes only and does not constitute investment or consultation advice or investment strategy. The information is not tailored to the investment needs of any specific person and therefore does not involve a consideration of any of the investment objectives, financial situation or needs of any viewer that may receive it. Kindly also note that past performance is not a reliable indicator of future results. Actual results may differ materially from those anticipated in forward-looking or past performance statements. We assume no liability as to the accuracy or completeness of any of the information and/or content provided herein and the Company cannot be held responsible for any omission, mistake nor for any loss or damage including without limitation to any loss of profit which may arise from reliance on any information supplied by Everest Fortune Group.
Chart Patterns

QQQ Technical Analysis! SELL!
My dear subscribers,
This is my opinion on the QQQ next move:
The instrument tests an important psychological level 488.86
Bias - Bearish
Technical Indicators: Supper Trend gives a precise Bearish signal, while Pivot Point HL predicts price changes and potential reversals in the market.
Target - 463.87
About Used Indicators:
On the subsequent day, trading above the pivot point is thought to indicate ongoing bullish sentiment, while trading below the pivot point indicates bearish sentiment.
Disclosure: I am part of Trade Nation's Influencer program and receive a monthly fee for using their TradingView charts in my analysis.
———————————
WISH YOU ALL LUCK

Will the price of gold continue to rise?The pressure position on the 44-hour chart is around 3270-3280, which becomes an important dividing point for intraday short-term trading. In the intraday trading, we focus on the 3200-line long-short watershed. Before gold falls further and breaks through, gold will maintain a bullish trend. In the intraday trading, we focus on the recent starting point of 3222 support. If gold wants to move steadily upward, it will not fall below 3222 in the day. In the short term, we refer to the points above 3222 to arrange long positions! Gold operation strategy: Gold falls back to 3230-3232, stop loss at 3220, target 3260-3270; it is recommended to go short when it touches 3270-3268, stop loss at 3280, target 3240-3230;

USDJPY Will Move Higher! Long!
Take a look at our analysis for USDJPY.
Time Frame: 12h
Current Trend: Bullish
Sentiment: Oversold (based on 7-period RSI)
Forecast: Bullish
The market is on a crucial zone of demand 144.942.
The oversold market condition in a combination with key structure gives us a relatively strong bullish signal with goal 148.284 level.
P.S
We determine oversold/overbought condition with RSI indicator.
When it drops below 30 - the market is considered to be oversold.
When it bounces above 70 - the market is considered to be overbought.
Disclosure: I am part of Trade Nation's Influencer program and receive a monthly fee for using their TradingView charts in my analysis.
Like and subscribe and comment my ideas if you enjoy them!

USDJPY and GBPJPY Analysis todayHello traders, this is a complete multiple timeframe analysis of this pair. We see could find significant trading opportunities as per analysis upon price action confirmation we may take this trade. Smash the like button if you find value in this analysis and drop a comment if you have any questions or let me know which pair to cover in my next analysis.

Bitcoin (BTC): Looking For Re-Test of $92,000Weekends were pretty bloody, where we had a strong sell-off on the markets, but yet we did not see the proper re-test of the local resistance zone (which is still the resistance and now proper support zone).
We are looking for the price to decline back towards the GETTEX:92K , where we will be looking either for further downward movement or upward movement.
We set both sell and buy entry zones for us so let's wait now
Swallow Academy

EURCAD: Still Bearish Outlook 🇪🇺🇨🇦
Last week, we discussed a confirmed bearish breakout of
a major horizontal support on EURCAD.
The broken structure was retested, and I see a strong bearish
intraday price action on an hourly time frame.
Probabilities will be high to see a down movement at least to 1.558 level today.
❤️Please, support my work with like, thank you!❤️
I am part of Trade Nation's Influencer program and receive a monthly fee for using their TradingView charts in my analysis.


EURUSD Bearish Structure AnalysisFX:EURUSD is currently bearish in structure, forming an imperfect Head and Shoulders pattern with EMA potentially flipping. Price target is heading towards support or the 200 EMA.

$1000CHEEMSUSDT Breakout Alert🚨 Breakout Alert! BINANCE:1000CHEEMSUSDT 🚀
Price broke out of a symmetrical triangle on the 12-hour chart, bullish confirmation in play.
- Entry: CMP
- Target 1: 0.001681
- Target 2: 0.002183
- Final Target: 0.003322
- SL: 0.001336
Volume confirmation next?
Watch closely! 👀


XAUUSD Channel Up intact and targeting the 1D MA50.Gold (XAUUSD) has been trading within a Channel Up since the October 30 2024 High and is currently on its latest technical Bearish Leg. The last pull-back tested the 1D MA50 (blue tend-line) before rebounding again.
As you can see the Low that this pull-back made was also on the 0.618 Fibonacci retracement level. On the current Bearish Leg, the 0.618 Fib is at 3155 and can make contact with the 1D MA50 within 1 week. That is our short-term Target, but depending on the Fed Rate Decision on Wednesday, it may be achieved earlier.
-------------------------------------------------------------------------------
** Please LIKE 👍, FOLLOW ✅, SHARE 🙌 and COMMENT ✍ if you enjoy this idea! Also share your ideas and charts in the comments section below! This is best way to keep it relevant, support us, keep the content here free and allow the idea to reach as many people as possible. **
-------------------------------------------------------------------------------
Disclosure: I am part of Trade Nation's Influencer program and receive a monthly fee for using their TradingView charts in my analysis.
💸💸💸💸💸💸
👇 👇 👇 👇 👇 👇


For the patience ones.If a close bellow the last weeks price action occurs, We can sell short at the market or wait for a possible retrace then get in. Its a long ride until the target but if all goes well will be possible to build a massive position but until then we wait for the first trigger. More updates as the trade develops.

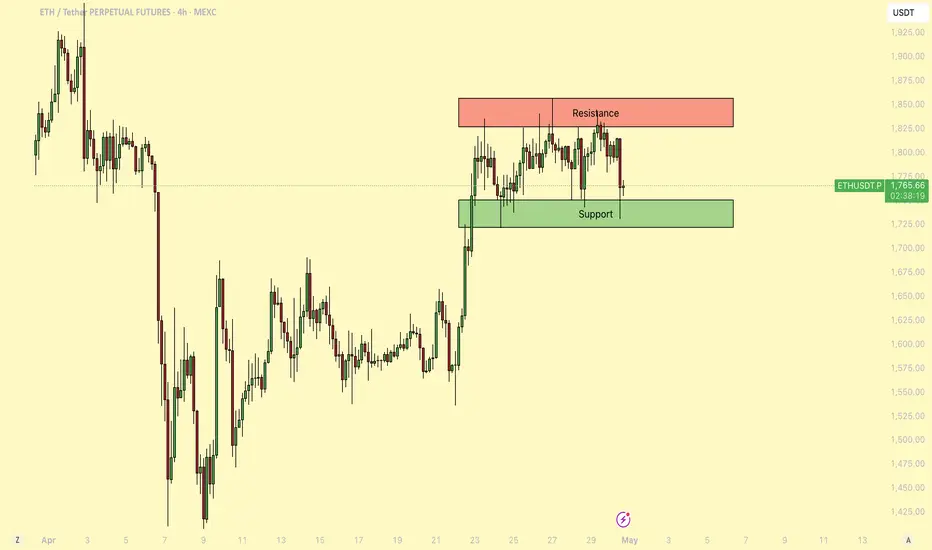
ETH - Consolidating before a major breakout!About a week ago, Ethereum (ETH) saw a strong upward move, pushing the price up with notable momentum. Since then, it has entered a period of consolidation, trading within a tight range as the market awaits the next decisive move.
-------------------------------
Which Direction Will ETH Break?
After such a strong rally, this kind of consolidation is normal. It could signal a continuation to the upside, especially if this is part of a broader relief rally. However, it's important to note that during the rapid move up, ETH left behind a 4h Fair Value Gap (FVG), which may attract price back down for a potential fill in the event of a breakdown.
-------------------------------
Stochastic RSI insight
On the daily chart, the Stochastic RSI remains in the overbought zone. Historically, when this indicator lingers in such territory, ETH has seen notable pullbacks. This could be an early sign that a downward move is more likely unless momentum changes soon.
-------------------------------
ETH vs. the 50-Day Moving Average
ETH is currently struggling with the 50-day Moving Average (MA), trading just below this key resistance level. As long as ETH remains under the 50-day MA, bearish pressure could continue. However, a reclaim and sustained hold above this level would likely indicate a shift toward bullish momentum.
-------------------------------
My Outlook
This range is tricky to trade, and a breakout in either direction is possible. Personally, I think there's a chance ETH could sweep the recent highs before a larger move down. The overbought Stochastic RSI and resistance at the 50-day MA both suggest that the rally might be losing steam in the short term.
-------------------------------
Thanks for your support.
- Make sure to follow me so you don't miss out on the next analysis!
- Drop a like and leave a comment!
"DXY Dollar Index" Market Bullish Heist Plan (Day/Swing Trade)🌟Hi! Hola! Ola! Bonjour! Hallo! Marhaba!🌟
Dear Money Makers & Robbers, 🤑 💰💸✈️
Based on 🔥Thief Trading style technical and fundamental analysis🔥, here is our master plan to heist the "DXY Dollar Index" Bank Heist. Please adhere to the strategy I've outlined in the chart, which emphasizes long entry. Our aim is to escape near the high-risk ATR Line Zone. It's a Risky level, overbought market, consolidation, trend reversal, trap at the level where traders and bearish robbers are stronger. 🏆💸"Take profit and treat yourself, traders. You deserve it!💪🏆🎉
Entry 📈 : "The heist is on! Wait for the Crossing previous high (100.400) then make your move - Bullish profits await!"
however I advise to Place Buy stop orders above the Moving average (or) Place buy limit orders within a 15 or 30 minute timeframe most recent or swing, low or high level for Pullback entries.
📌I strongly advise you to set an "alert (Alarm)" on your chart so you can see when the breakout entry occurs.
Stop Loss 🛑: "🔊 Yo, listen up! 🗣️ If you're lookin' to get in on a buy stop order, don't even think about settin' that stop loss till after the breakout 🚀. You feel me? Now, if you're smart, you'll place that stop loss where I told you to 📍, but if you're a rebel, you can put it wherever you like 🤪 - just don't say I didn't warn you ⚠️. You're playin' with fire 🔥, and it's your risk, not mine 👊."
📍 Thief SL placed at the nearest/swing low level Using the 2H timeframe (99.000) Day/swing trade basis.
📍 SL is based on your risk of the trade, lot size and how many multiple orders you have to take.
🏴☠️Target 🎯: 102.300
🧲Scalpers, take note 👀 : only scalp on the Long side. If you have a lot of money, you can go straight away; if not, you can join swing traders and carry out the robbery plan. Use trailing SL to safeguard your money 💰.
💰💵💸"DXY Dollar Index" Bank Money Heist Plan is currently experiencing a bullishness,., driven by several key factors. .☝☝☝
📰🗞️Get & Read the Fundamental, Macro Economics, COT Report, Geopolitical and News Analysis, Sentimental Outlook, Intermarket Analysis, Index-Specific Analysis, Future trend targets with Overall outlook score... go ahead to check 👉👉👉🔗🔗🌎🌏🗺
⚠️Trading Alert : News Releases and Position Management 📰🗞️🚫🚏
As a reminder, news releases can have a significant impact on market prices and volatility. To minimize potential losses and protect your running positions,
we recommend the following:
Avoid taking new trades during news releases
Use trailing stop-loss orders to protect your running positions and lock in profits
💖Supporting our robbery plan 💥Hit the Boost Button💥 will enable us to effortlessly make and steal money 💰💵. Boost the strength of our robbery team. Every day in this market make money with ease by using the Thief Trading Style.🏆💪🤝❤️🎉🚀
I'll see you soon with another heist plan, so stay tuned 🤑🐱👤🤗🤩

XAUUSD Analysis todayHello traders, this is a complete multiple timeframe analysis of this pair. We see could find significant trading opportunities as per analysis upon price action confirmation we may take this trade. Smash the like button if you find value in this analysis and drop a comment if you have any questions or let me know which pair to cover in my next analysis.

EURUSD SHORT Just my analysis for EURUSD
Zone Supply + Zone QM:
1.13797 - 1.13505
SL: 1.13924
TP: 1.09001

Gold intraday trading strategyGold operation strategy:
1. Go short at 3270-75 when gold rebounds, and cover short at 3388-93 when it rebounds, stop loss at 3397, target at 3230-3235, and continue to hold if it breaks;
2. Go long at 3220-3225 when gold falls back, stop loss at 3214, target at 3265-70, and continue to hold if it breaks;


BTC latest analysis strategy signalBitcoin has reclaimed the $90K–
92K
zone after a sharp 32% correction from its all-time high, closing the week strongly above this critical area.
As long as price holds above $90,000, the primary bias remains bullish. The $90K–
92K
area now acts as a key support zone, ideal for pullback buying opportunities.
A breakout above $101,000 could trigger a strong acceleration toward the next major targets at $115K–$125K.
A weekly close below the green support zone would invalidate the bullish scenario and suggest caution.


Today's rebound continues to be short!The logic behind the current rise and fall of gold has changed. The main factors for the previous crazy rise in gold and the decline at 3,500 were the tariff war, which has gradually turned from tension to relaxation. The latest news shows that the two sides are trying to contact each other to prepare for the next round of negotiations.
Later, we should focus on the Federal Reserve. Trump previously asked the Federal Reserve to cut interest rates to reduce the impact of the tariff war on the economy. Powell's resistance once made Trump want to change the chairman of the Federal Reserve. The big non-agricultural data on Friday was better than expected, which means that the time for the Federal Reserve to cut interest rates will be delayed, which is bad for the gold market. Therefore, gold may fall further at the beginning of next week.
On the other hand, after the world's largest gold ETF reduced its positions significantly since the peak of 3,500 on April 22, it has continued to reduce its positions slightly during this period, and there has been no obvious increase in positions, which reflects that gold has further bottoming out.
The daily line on Friday closed with a cross K, following three consecutive negatives. From a technical point of view, it is either a signal of continued decline or a reversal. Combined with the news data and the overall trend, the probability of continued decline is very high.
On the one hand, the rebound strength on the hourly and 4-hour charts is not strong, and the upward continuity is poor. The 100-day moving average is always under pressure to fall, and the trend is still bearish.
On the other hand, the adjustment on the daily and weekly lines has not yet ended, and the indicators show that there is still further decline. Next week, we should focus on the 618 golden section position of 3160. As for whether it can be the bottom position, in addition to the price point, it is also necessary to consider the K-line pattern comprehensively. We will talk about it next week.
Therefore, for gold on Monday, we can rely on the 3264-3268 line of pressure to continue shorting, and the limit of the pullback cannot exceed the 618 position of 3275, which is the watershed. The support below is 3222-3224, and if it breaks, it will hit the low point of 3201-3202, which may not be maintained.
