Gold Market Update: Restructuring and Imbalance SweepThe gold market has restructured, forming a daily candle pullback to a key daily supply POI. Prices may prompt an imbalance liquidation sweep toward the next substantial demand at $2722. Should this level not hold, the market sentiment may shift accordingly, keeping traders vigilant for further movements. follow for more insights capitalist , boost idea and comment your thoughts
Chart Patterns

audnzd is bearishthe pair was trying several times to break the depicted level but failed and left a fake break on the level and now is heading south toward tp's
please see what the market will play out

Another bullish continuation for salesforceNYSE:CRM is looking at a potential strong bullish continuation after the stock has broken out of the bullish flag with a huge bullish bar with the support of a spike in volume. Furthermore, the stock has been in an uptrend channel since Dec 2022 and it is likely to continue higher. Hence, we are adding on to a buy position on CRM with near-term target price of 408. Should correction happens, the next support will be at 297 and 316.
Momentum is stable in the mid-term after stochastic may potentially cross right above the mid-point line. 23-period ROC has been rising and has broken past the 50-line. Directional movement index is showing early signs of the rise in bullish strength.

SILVER: Expecting Bullish Continuation! Here is Why:
Looking at the chart of SILVER right now we are seeing some interesting price action on the lower timeframes. Thus a local move up seems to be quite likely.
❤️ Please, support our work with like & comment! ❤️

The Bullion on the Rise Again📊 FX:XAUUSD Gold (XAU/USD) Weekly Market Update
Hey traders,
While I couldn’t prepare our usual video analysis, here’s a detailed breakdown of the Gold market alongside chart snapshots.
Last week, Gold revisited the 2615 level, near the 38.2% Fibonacci zone , which turned out to be yet another bear trap. Many shorts got liquidated, as seen in the surge in short volume.
Thanks to our strategy, we stuck with the trend, entering at 2629 . We’re now running a strong 400 pips Open P/L , with Gold currently heading towards the 26.2% Fibonacci zone.
🔑 Key Levels to Watch:
Minor resistance expected at 2685 and 2710 before reaching the 2750 target profit.
🔍 Fundamental Backup to Our Trade:
1️⃣ Geopolitical Tensions:
Escalating Middle East instability: Rebel forces ousted President Bashar al-Assad in Syria, heightening fears of broader regional uncertainty.
Safe-haven demand for Gold surged as investors sought security amidst these developments.
2️⃣ China's Gold Purchases:
China's central bank resumed gold acquisitions in November after a six-month break, providing additional bullish momentum.
3️⃣ Dovish U.S. Monetary Policy:
Friday’s U.S. jobs report indicated softening labor market conditions, fueling expectations for a 25-basis-point rate cut at the Fed’s final meeting this year.
Lower interest rates enhance Gold’s attractiveness as a non-yielding asset.
🔮 Potential Scenarios:
Bullish: Sustained geopolitical instability and dovish monetary policy may drive Gold above the 50-period SMA (~$2,678) and closer to our target.
Bearish: A reduction in geopolitical risk premium or sticky inflation could pressure Gold toward the 100-period SMA (~$2,586)- very unlikely.
Stay sharp, watch these levels, and trade smart! 💡
🧠 Let’s Collaborate!
What’s your take on GOLD this week? Share your ideas and charts below in comment. Let’s discuss whether we’re headed to new highs or revisiting support levels!
Cheers,
The NFX Team™ 💚

GBP/USD BEARISH ALERTRight now GBPUSD is on 1.2426
We have trend line and resistance trend line which give us a signal for sell
We can put sell positions from 1.2426-1.2440
our target will be next 2 supports
Tp1 1.24068
Tp2 1.23857
USE PROPER MONEY MANAGMENT AND GET THIS TRADE TOGATHER
BE IN PROFIT TOGATHER 💪

USDCHFUSDCHF ( U.S Dollar / Swiss Franc )
Completed " 12345 " Impulsive Waves
Break of Structure
RSI - Divergence
Exp FIAT in Short Time Frame
Demand Zone

BTCUSD: Perfect Bullish Area: 100000Disclaimer: This analysis is not a trading advice but a personal opinion only published for the sack of study.
Greetings: What do you think about Bitcoin today. kindly share your opinion in the comment section
BTCUSD Price Now: 100300
Currently market has experienced a huge drop which was necessary because market had to retest and find the new supporting area for hitting a new All Time High. BTCUSD is still bullish and can go further high. I think its the best area for buy till 105000 which can show a little resistance but if it breaks this resistance then its next target will be 107500. Market is working under a fixed range even if goes down it would not be a drastic fall.
Supporting Areas: 100000, 98000
Resistance Areas: 105000, 107500
Demand Zone: 107500
Like, comment and support for more updates on BTCUSD
Thanks for your support

EUR/USD BEARS WILL DOMINATE THE MARKET|SHORT
Hello, Friends!
We are now examining the EUR/USD pair and we can see that the pair is going up locally while also being in a uptrend on the 1W TF. But there is also a powerful signal from the BB upper band being nearby, indicating that the pair is overbought so we can go short from the resistance line above and a target at 1.017 level.
✅LIKE AND COMMENT MY IDEAS✅

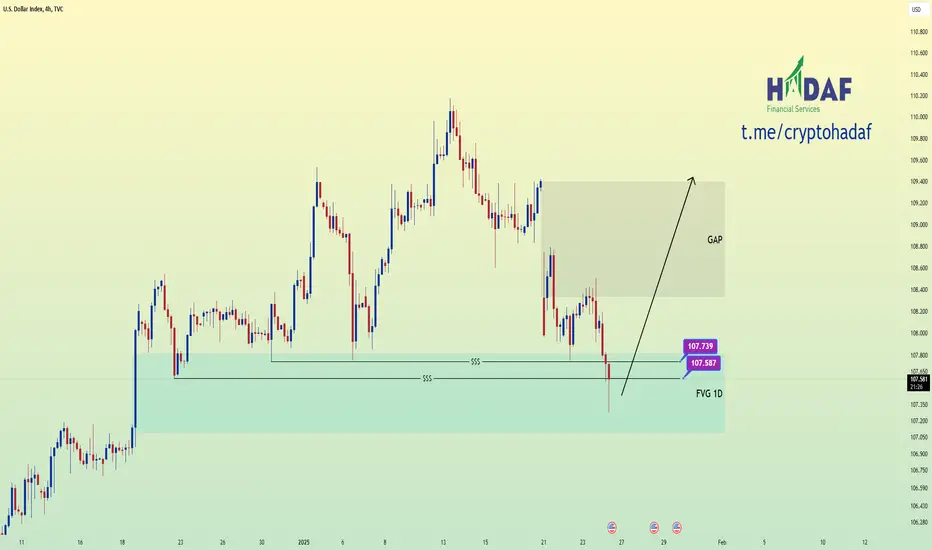
#DXYGiven the filling of both liquidity shown in the large FVG area where we previously saw a good pump, it seems that the dollar index will once again have the ability to rise to fill the gap that has arisen.
GBP/USD SELL $$$
The 15-minute is bearish. But the 1-hour and 4-hour are not bearish yet. I expect more on the short trade because the price has hit the daily zone. After the 1+4-hour zone is broken, the decline will be heavier and the risk is less.

AudUSD BUYAfter taking key liquidity towards buy side. Also formed a 30 min positive order block and the target will be the nearest first high or liquidity.

Bitcoin and altcoin overview (January 28-29)Yesterday for Bitcoin, there were signs of absorption of sales by cumulative delta which led to a rebound.
At the moment, we have approached the lower boundary of the selling zone, from where a reaction is naturally expected. Yesterday's scenario is still in effect, and we prioritize expecting sales to resume.
Selling zones: $103,000-$105,600(accumulated volumes), $107,000-$109,000(volume anomalies).
Buying zones: $97,000-$94,300(maximum volumes of global sideways), $92,000-$90,000(volume anomalies), $89,000-$86,300(accumulated volumes).
Interesting altcoins
The Ach coin is currently between 2 unprocessed volume zones, so when entering each of them, there is an opportunity to open a trade in the opposite direction if there is a reaction. Buyer's zone: $0.32-$0.285. Seller's zone: $0.37-$0.4.

SONACOMSSONACOMS
watch this level.
*I am Not SEBI Registered, This is purely education purpose only. Not recommended BUY/Sell.

AudCad is bearishthe critical levels is depicted on the chart and the pair is going south for a while
we are following the case for downward tp
please see daily chart as well as below:

CADCHF // Selling scenario, Reversal pattern found on TOP..📉 CADCHF Price Forecast 📉
CADCHF has broken the upward trendline and formed a head and shoulders pattern at the top of the uptrend, signaling a potential bearish reversal. The golden crossover of the 200EMA and 50EMA has already occurred, and the price is now facing resistance at the 50EMA.
With the bearish setup confirmed, the market is likely to fall further.
🎯Technical Target Levels:
- 0.6280
- 0.6240
📢 Follow for more insights and updates. Don't miss out on the next big move!

XAUUSD Chart Anylisis 1Hour idea XAUUSD Chart Anylisis 1Hour idea
This is not financial advice trade and manage your own risk

BTCUSD chart Anylisis 1Hour ideaBTCUSD chart Anylisis 1Hour idea
This is not financial advice trade and manage your own risk

Monday CLS, Key level. OB in the Premium, Model 1Monday CLS, Key level. OB in the Premium, Model 1
Im positioning myself to the EURUSD Long
youu are welcome to comment with your thoughts and share your charts or questions below, I like any constructive discussion.
What is CLS?
This company is trading for the biggest investment banks and central banks. They trade over 6.5 trillion daily volume. They are smart money of the all markets.
CLS operates in the specific times which will give you huge advantage and precisions to you entries. Focus on that. Its accuracy is amazing.
Good luck and I hope this educational post helps to become better trader
“Adapt what is useful, reject what is useless, and add what is specifically your own.”
Dave FX Hunter ⚔

The 3 Step Risk Managment Booster StrategyThis is important for you to digest the power of risk management
is very important for you to understand
this next strategy
I called it "the risk management booster strategy"
is not easy because it will force you
to trade with discipline
Its very popular to just jump the gun in trading
and enter the market order
so what is the risk management booster strategy?
only use the following:
-Stop orders
-limit orders
-Pivot Points Indicator for entry
This 3 step risk management system will
help you trade with the discipline that you need
in the financial markets
to learn more rocket boost this content
look at the chart of Tesla NASDAQ:TSLA
based on this strategy
you can see the place to place a buy order.
trade safe.
Disclaimer: Trading is risky please learn risk management
and profit-taking strategies
Also feel free to use a simulation trading account.

USDCHF - BearishUSDCHF is in bearish trend and currently facing rejection from Fib 0.618 level. Take short entry at current price with SL above previous LH.

GBPNZD SHORTSGBPNZD have been on a down trend and will continue doing so for a while. I expect a contact with the trend line that will initiate the fall to 2.16912 and then 2.14900.

EURAUDFor EURAUD I expect buys to the ray line above that will fill the wick seen on the daily. There is also a probability that price might come for a third touch on the trendline below before the buys happen.
