Excellent yesterday's sessionAs discussed throughout my yesterday's session commentary: "My position: In my opinion I need to stay on Hourly 4 time-frame for us and the potential break-out to the downside since Hourly 4 chart remains Bearish (never Swing Buy while #H4 is Bearish) on logarithmic scale, hence on limited upside. My expectation is that we still have one (minor) rebound left which will be the final Selling attempt / entry towards #3,300.80 benchmark, if Buyers manage to reverse this, #3,352.80 and #3,400.80 marks are Targets to monitor / which I will pursue with set of Scalp and Swing orders. Trade accordingly as I Bought #3,302.80 with set of aggressive Scalp orders."
I have Bought Gold with aggressive Scalps from #3,297.80 - #3,302.80 zone, firstly closing my orders as near as #3,310.80. Later on, did #4 more Scalps from #3,308.80 - #3,313.80 / closing all as near as #3,322.80 as I announced that Gold will certainly recover as per above (cca #171.000 EUR Profit using #100 Lots).
Technical analysis: Ranged Price-action came as no Technical surprise as Price-action remains in Rectangle on a combination of Fundamental pressure and Technical necessity for a Lower Low’s extension. It is closely related to currency Volatility on DX (and the economy related Fed’s talks and Tariffs agreements of utmost importance) as the Price-action in near equilibrium with DX (# -0.27%) also on Weekly scale and even if the pair completes full scale reversal, Gold should stay under Selling pressure. On the Short-term side, there is an clear Resistance and Support zone, limiting Sellers advances to it’s maximum thru Fundamental side (every early to late U.S. session revives Buyers on the aftermath). Gold should already Trade widely below #3,300.80 psychological barrier, but now Resistance tests seems more likely to develop and showcase Short-term Buyers presence. Hourly 4 chart points that Lower High’s Lower zone is near and Resisting the Price-action at #3,334.80 - #3,342.80 which makes it an possible Hourly 1 chart’s Ascending Channel variance - typical Target of similar sequence if break-out is delivered includes #3,348.80 - #3,352.80 on Short-term. In extension - I will advance with extreme care ahead of the most significant macroeconomic events of the week and since my model leans more to the Bullish side and Fundamentally Gold may soar, I will remain Scalping Gold as using Swing orders practically is worthless on such market.
My position: I will keep Buying and Selling Gold only with my aggressive Scalp orders from my key entry and reversal points.
Chart Patterns

Monday Markets Update SP500 may start pulling back, we'll have to see if they can get any downward pressure hapening. USOIL still looks bearish. Gold and Nat Gas both looks like they are going sideways right now. BTC still hasn't broken out above 110k.

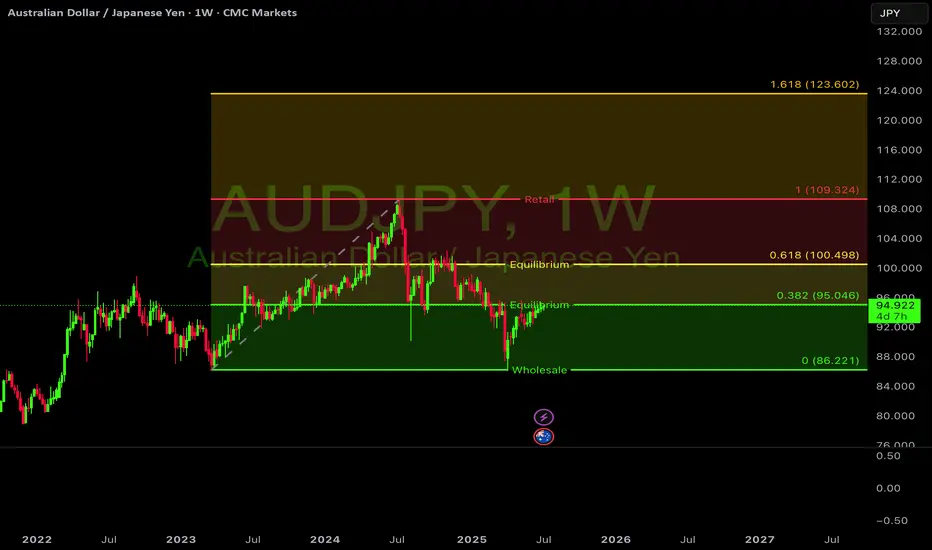
AUDJPY LONG????OANDA:AUDJPY showing resilience at channel support (94.50).
Multi-year uptrend intact with price bouncing from lower boundary. Current consolidation above 94 suggests strength.
Watch for continuation toward 100 resistance. #forex #technicalanalysis
XAU/USD : Get Ready for Another Fall ! (READ THE CAPTION)By analyzing the gold chart on the 4-hour timeframe, we can see that, as expected from our previous analysis, when the price was trading around $3327, it climbed to the supply zone at $3345. After reaching this key level, strong selling pressure emerged, leading to a sharp drop in gold today down to $3296.
This move played out exactly as anticipated, and now, if the price stabilizes below $3330, we could expect further downside pressure on gold.
The Main Analysis :

Potential bearish drop?The Loonie (USD/CAD) has rejected off the pivot, which has been identified as an overlap resistance and could drop to the 61.8% Fibonacci support.
Pivot: 1.3688
1st Support: 1.3599
1st Resistance: 1.3743
Risk Warning:
Trading Forex and CFDs carries a high level of risk to your capital and you should only trade with money you can afford to lose. Trading Forex and CFDs may not be suitable for all investors, so please ensure that you fully understand the risks involved and seek independent advice if necessary.
Disclaimer:
The above opinions given constitute general market commentary, and do not constitute the opinion or advice of IC Markets or any form of personal or investment advice.
Any opinions, news, research, analyses, prices, other information, or links to third-party sites contained on this website are provided on an "as-is" basis, are intended only to be informative, is not an advice nor a recommendation, nor research, or a record of our trading prices, or an offer of, or solicitation for a transaction in any financial instrument and thus should not be treated as such. The information provided does not involve any specific investment objectives, financial situation and needs of any specific person who may receive it. Please be aware, that past performance is not a reliable indicator of future performance and/or results. Past Performance or Forward-looking scenarios based upon the reasonable beliefs of the third-party provider are not a guarantee of future performance. Actual results may differ materially from those anticipated in forward-looking or past performance statements. IC Markets makes no representation or warranty and assumes no liability as to the accuracy or completeness of the information provided, nor any loss arising from any investment based on a recommendation, forecast or any information supplied by any third-party.

Gold (XAUUSD) – July 8 Analysis | Decision Day at H4 Supply Zone
Gold is currently trading inside a key H4 supply zone (3342–3345) , and today’s session could act as a pivotal turning point for the ongoing structure.
We are now in a region where the H4 may either complete its pullback and resume the uptrend — or allow price to drop deeper toward 3280 before any bullish continuation.
Market Structure Overview
• H4 Trend: Still in a pullback
• M15 Trend: Gave a Change of Character (ChoCh) in the previous session
• Break of Structure (BoS): Not yet confirmed on M15
This puts us in a state of unconfirmed reversal . Without a clean BoS, this could still be a liquidity grab .
Key Levels & Current Setup
📍 H4 Supply Zone: 3342–3345
→ This is where price is currently reacting
→ Sellers may step in here if the broader pullback continues
📍 M15 Structure Status:
→ ChoCh already occurred
→ Price is in a retracement phase
→ BoS is needed to confirm a shift and signal the end of H4 pullback
What Today’s Session Will Decide
🔸 If M15 breaks structure upward (BoS):
→ H4 pullback may be complete
→ Bias turns bullish
→ We’ll plan long setups from M15 POIs with M1 confirmation
🔸 If M15 fails to break and reverses:
→ This could be a liquidity grab
→ Sellers may push price lower
→ Next downside target: 3280 H4 order block , still valid
⚠️ Reminder: Be Prepared for Both Scenarios
• No M15 BoS = No bias
• Wait for structure, not emotion
• Do not force long trades without confirmation
• 3280 remains a high-probability target if rejection confirms
Final Thoughts
This is a structure-led market — we don’t predict, we prepare.
Today’s price action may bring directional clarity.
Structure over speculation.
Let price show intent.
Then act with process, not impulse.
📘 Shared by @ChartIsMirror

DYDX Breakout from Falling Wedge | Targeting $1.60+# DYDX Breakout from Falling Wedge | Targeting $1.60+
📈 **DYDX/USDT Analysis – Daily Timeframe**
DYDX has just broken out of a falling wedge pattern – a classic bullish reversal formation – after holding a strong support zone around **$0.50**. This zone has acted as a reliable demand area for several months.
---
🔍 **Technical Highlights:**
- ✅ Falling wedge breakout confirmed with daily candle close above resistance
- 🟢 Strong support at $0.50–$0.52
- ⚠️ Horizontal resistance at $0.75 may act as a short-term barrier
- 🚀 Potential rally toward major resistance at **$1.60–$1.70** (target zone)
---
🎯 **Profit Targets:**
- First Target: **$0.75**
- Final Target: **$1.60 – $1.70**
❌ **Invalidation (Stop-loss idea):**
- If price breaks below $0.48 with volume, the bullish scenario may be invalidated.
---
📊 This setup is based on breakout structure and potential trend reversal. If volume confirms, this could be the beginning of a new mid-term uptrend.
💬 Let me know what you think about this setup! Would love to hear your feedback.

#SXP/USDT#SXP
The price is moving within a descending channel on the 1-hour frame, adhering well to it, and is heading for a strong breakout and retest.
We are seeing a rebound from the lower boundary of the descending channel, which is support at 0.1587.
We have a downtrend on the RSI indicator that is about to be broken and retested, supporting the upward trend.
We are looking for stability above the 100 Moving Average.
Entry price: 0.1624
First target: 0.1666
Second target: 0.1736
Third target: 0.1807

AUDJPY Bullish Channel Still Intact, Eyeing Breakout Above 95.00AUDJPY continues to respect its ascending channel, with the current bounce occurring right at the 61.8% Fibonacci retracement and lower trendline support. The structure supports further upside as long as price holds above the 94.00–93.80 zone, with targets set toward 94.77 and 95.36, potentially extending to 95.63 highs.
🧠 Fundamentals:
AUD Strength Drivers:
RBA remains relatively hawkish vs other G10 banks.
Australia's data this week (retail sales, NAB confidence) were mixed, but no rate cut pricing in the near term supports AUD.
Iron ore demand showing resilience despite Chinese slowdown concerns.
JPY Weakness Drivers:
BoJ remains ultra-dovish. No action expected in July.
Japan’s inflation remains tame; the yield gap with other majors keeps widening.
Risk-on sentiment reduces demand for safe-havens like JPY.
🔍 Technical Structure:
Strong upward channel since early June remains valid.
Current pullback held the 61.8% Fib retracement of the June-July leg.
Bullish engulfing near support confirms entry.
Immediate resistance at 94.77 → 95.36 → potential breakout to 95.63.
Invalid if price closes below 93.80 (channel break).
⚠️ Risk Factors:
Risk-off shift (e.g., geopolitical escalation or U.S. CPI surprise) may boost JPY.
China growth fears can weigh on AUD.
A sudden dovish shift from the RBA would invalidate bullish fundamentals.
🔁 Leader/Lagger Dynamics:
AUDJPY typically leads other yen crosses (e.g., NZDJPY, CADJPY) during risk-on moves. It’s also a barometer for broader risk sentiment, often following moves in equity indices like US500 or commodity-linked assets.
✅ Trade Bias: Bullish
TP1: 94.77
TP2: 95.36
TP3 (aggressive): 95.63
SL: Below 93.80
Event to Watch: China data this week + U.S. CPI (Jul 11)
📌 Watch for a strong bullish daily candle above 94.77 for continuation confirmation. Stay nimble around key global risk events.

GBPSGD buy !!Price is sitting @ a strong resistance area and beautiful rejection from the downside . it is time to buy this pair with 1:4 risk rewards. do not risk more than 1% per trade.

CHFJPY Rising Wedge Weekly analysis rejection below 183. Watch for rejection signals around 181–183.5. Unless there's a strong breakout above this zone, the pair is likely to reverse down toward 173–168 in the coming weeks. A break below 168 would be a major bearish shift.

Coinbase overbought and into massive resistanceI've highlighted a major area of resistance on Coinbase going back 4 years to 2021. Was above the trendline earlier in the week and is now getting rejected. Good short opportunity. Will monitor this one. I just bought some CONI

XLM ,1DAs BTC is Falling And BTC is given Breakout of Pattern in 4Hr , then Remaining coins will also fall drastically .
in 1D pattern of XLMUSDT , it is Breaking Down as BTC is also given Break Down of Pattern
Follow for More Ideas like This

XAUUSD GOING SHORTGOLD has recently broken its last low, shifting market structure (CHOCH) and indicating sellers are currently in control. This break opened up 2 clear Supply Zone above — a small base or last bullish candle before the drop — which is a key area where unfulfilled sell orders may be resting.
Price is likely to retrace back into these Supply Zone to fill those orders. Once it reaches this area, we expect selling pressure to resume and push price downward, honoring the imbalance left by the drop.
Entry:
I’m looking to sell from this Supply Zone on a pullback,
This lets me enter at a premium price while trading in direction of the newly established downward momentum.
Target:
The first Target Profit (TP) is set at the next Demand Zone below, where buying pressure might emerge. This Demand Zone is a key area to watch for a reversal or a temporary halt in downward momentum.
Stop Loss:
To control risk, the Stop Loss (SL) is placed just above the Supply Zone.
If price climbs above this area, it would invalidate the Supply’s ability to hold, signalling a potential reversal.
✅ Summary:
• Market has shifted to bearish after breaking last low.
• Supply Zone above is a key area to watch for selling opportunities.
• Sell upon retracement into Supply, with Stop Loss above and Target at Demand below.

Gold Price Setup: Bullish Continuation or Rejection? 🧠 Chart Analysis (XAU/USD – 1H):
Key Structure Highlights:
CHoCH (Change of Character) zones marked both up and down indicate a battle between bulls and bears.
Recent bullish CHoCH followed by a fair value gap (FVG) retest suggests potential continuation to the upside.
Price recently bounced strongly from demand zone, shown by the green arrows and strong candle reaction.
Ichimoku Cloud:
Price is trying to break back above the Kumo (cloud), a sign of bullish momentum building.
However, resistance is still present with the Kijun and Tenkan lines converging.
FVG (Fair Value Gap):
The current price is attempting to fill and break above the FVG zone.
A successful breakout above this area confirms bullish intention.
Fibonacci Levels:
Price is hovering around the 0.5 - 0.618 retracement zone, often a strong reversal or continuation point.
Upside targets lie near the 0.786 retracement (3352) and ultimate target at 3391, a major resistance level.
Risk Management:
Trade setup shows an excellent Risk:Reward ratio.
Stop-loss placed just below the last structure low.
Potential downside to 3290–3258 if breakout fails.
🟢 Possible Next Move:
Bullish Scenario: If price clears the FVG and breaks above 3353, expect continuation to 3391.
Bearish Rejection: If rejected at FVG/0.618 level, watch for a drop back to 3290 or even 3259.


GBP/USD30 Mins Frame
🧠 Technical Overview:
Price is currently testing a strong resistance zone after a gradual upward movement, with signs of a potential bearish reversal.
A rising wedge pattern is forming — typically a bearish reversal pattern, especially if broken to the downside.
🧩 Key Technical Elements:
1. Supply Zone:
Defined between 1.3675 and 1.3717 — a previously strong resistance area.
Price is currently facing rejection within this zone, showing weakening bullish momentum.
2. Entry Point:
Sell at 1.36560, triggered by rejection from the resistance zone and a potential breakdown below the ascending support (blue line).
3. Stop Loss:
1.37177, placed above the supply zone — a logical level that invalidates the bearish setup if reached.
4. Targets:
First Target: 1.35602 – a clear previous support level and logical profit-taking zone.
Second Target: 1.34207 – a stronger, more significant support zone, likely to be tested if bearish momentum continues.
📉 Expected Price Action:
The chart shows a weak rising wedge pattern, indicating potential buyer exhaustion.
A break below the ascending trendline (blue) may trigger strong downside movement.
The expected move is illustrated with the red arrow on the chart, indicating a bearish trajectory.
🔥 Risk-to-Reward Ratio (R:R):
First Target:
Potential Reward: ~95 pips
Risk (SL): ~61 pips
→ R:R ≈ 1.56:1
Second Target:
Potential Reward: ~235 pips
→ R:R ≈ 3.85:1
✅ Very favorable, especially toward the second target.
✅ Conclusion:
The short setup is technically valid and supported by price structure and resistance confirmation.
The supply zone has proven strong, and price is struggling to break above it.
A solid trade opportunity for short- to medium-term traders with clearly defined risk and reward.

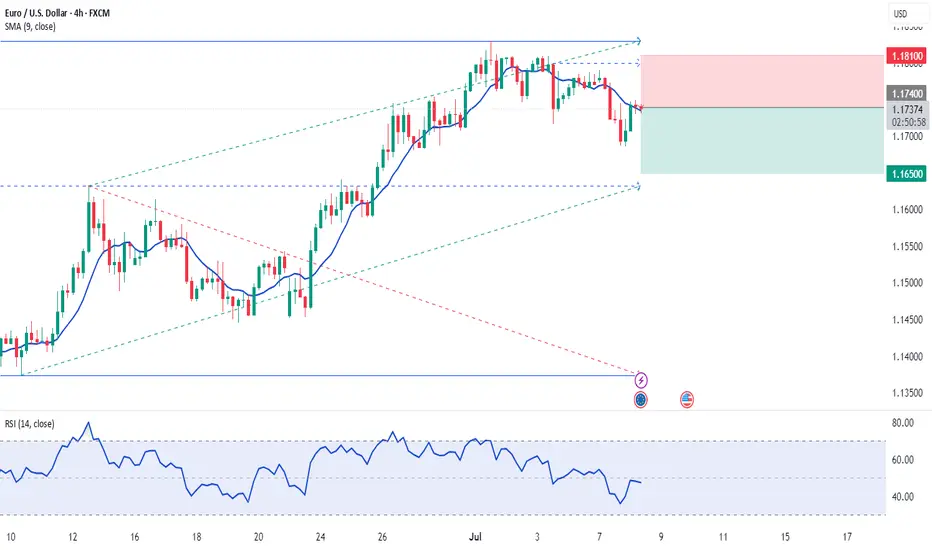
EUR/USD 2-Hour Chart - OANDA2-hour performance of the Euro/U.S. Dollar (EUR/USD) currency pair on the OANDA platform as of July 08, 2025. The current exchange rate is 1.17365, reflecting a 0.24% increase (+0.00279). The chart includes a recent sharp decline highlighted in a shaded area, with buy and sell signals at 1.17375 and 1.17357 respectively. Key price levels are marked, ranging from 1.1500 to 1.1850, with a focus on the recent market movement.

GBPCAD LONG FORECAST Q3 W28 Y25GBPCAD LONG FORECAST Q3 W28 Y25
Professional Risk Managers👋
Welcome back to another FRGNT chart update📈
Diving into some Forex setups using predominantly higher time frame order blocks alongside confirmation breaks of structure.
Let’s see what price action is telling us today! 👀
💡Here are some trade confluences📝
✅Daily Order block identified
✅4H Order Block identified
✅1H Order Block identified
🔑 Remember, to participate in trading comes always with a degree of risk, therefore as professional risk managers it remains vital that we stick to our risk management plan as well as our trading strategies.
📈The rest, we leave to the balance of probabilities.
💡Fail to plan. Plan to fail.
🏆It has always been that simple.
❤️Good luck with your trading journey, I shall see you at the very top.
🎯Trade consistent, FRGNT X


GOLD looks to be trying to make a bullish patternGold is trying to turn this downtrend around. Let's see if it can confirm the INV H&S pattern.

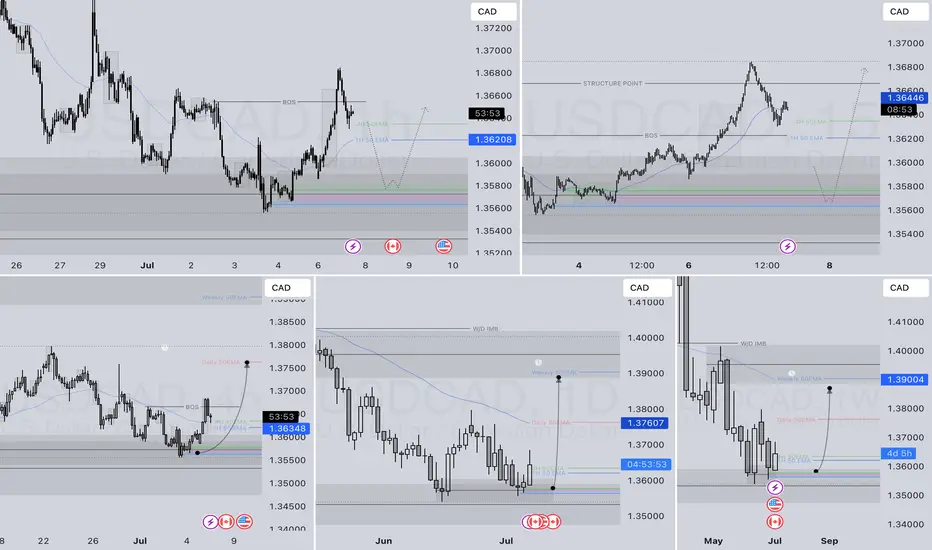
USDCAD LONG DAILY FORECAST Q3 W28 Y25USDCAD LONG DAILY FORECAST Q3 W28 Y25
Professional Risk Managers👋
Welcome back to another FRGNT chart update📈
Diving into some Forex setups using predominantly higher time frame order blocks alongside confirmation breaks of structure.
Let’s see what price action is telling us today! 👀
💡Here are some trade confluences📝
✅Daily Order block identified
✅4H Order Block identified
✅1H Order Block identified
🔑 Remember, to participate in trading comes always with a degree of risk, therefore as professional risk managers it remains vital that we stick to our risk management plan as well as our trading strategies.
📈The rest, we leave to the balance of probabilities.
💡Fail to plan. Plan to fail.
🏆It has always been that simple.
❤️Good luck with your trading journey, I shall see you at the very top.
🎯Trade consistent, FRGNT X
Gbpusd short scalp I will consider a short only if pull back happens prior to target 1 being a traded to.
I like the downward monetum this morning.
4 losses 1 win for the simulated scalps. If this one is triggered it is the 6th scalp out of 100
