Financial Markets Are Not Known for Their CharityFinancial markets are not charitable institutions—they operate on risk, speculation, and the push and pull of supply and demand. Many retail investors learned this the hard way.
Last November, retail investors rushed in at market highs, driven by optimism and FOMO. Now, many are clinging to their high entry points, hoping for a break-even price—even though some would need at least a 5x return just to get back to entry price one . The market, however, does not move according to people’s wishes.
Some retails are holding on, hoping to break even, but the reality is that they may never see those initial values again. Others, especially those with small wallets , are chasing big wins—sometimes looking for a 10x return—which often leads to deeper losses.
Remember this : " Financial Markets Are Not Known for Their Charity " .
BINANCE:ETHUSD BINANCE:XRPUSDT BINANCE:DOGEUSDT BINANCE:SUIUSDT
Chart Patterns

ETH vs USDT Crypto Heist - Bullish Breakout Plan!🔥 Thief Trading Style: ETH/USD Bullish Heist Plan 🔥
Dear Money Makers & Market Robbers 🤑,
Ready to pull off a master heist in the Ethereum vs. U.S. Dollar (ETH/USD) crypto market? 📈 Using Thief Trading Style’s technical and fundamental analysis, here’s our strategic plan to ride the bullish wave and escape near the dangerous MA zone. Follow the chart, stick to the plan, and let’s secure those profits! 💪🎯
---
📊 Trade Setup: The Heist Blueprint
- Market: ETH/USD (Crypto) 🌐
- Bias: Bullish Breakout 🌟
- Timeframe: 1D (Swing Trade) ⏰
Entry 📈:
- Breakout Entry: Wait for a confirmed breakout above the Moving Average (MA) at 2500. Set Buy Stop orders just above 2500 to catch the momentum. 🚀
- Pullback Entry: For safer entries, place Buy Limit orders at the most recent 15M/30M swing low (e.g., 2450-2475) for pullback opportunities. 📍
- Pro Tip: Set an alert on TradingView for the 2500 breakout to never miss the move! 🔔
Stop Loss 🛑:
- Breakout Traders: Place your Stop Loss below the recent 1D swing low at 2000 after the breakout confirms. This protects against false moves. ⚠️
- Pullback Traders: Adjust Stop Loss based on your risk tolerance (e.g., 1-2% of account per trade). Use lot size and multiple orders wisely. 📏
- Risk Warning: This is a high-risk heist! Manage your position size and stick to your risk plan. 🔥
Target 🎯:
- Aim for 2900 (near the dangerous MA zone, a risky overbought level with potential consolidation or reversal). 🏴☠️
- Escape Plan: Consider taking profits early if bearish signals (e.g., reversal patterns, high volume) appear near 2900. 💸
Scalpers 👀:
- Focus on Long-side scalps using tight trailing stops. Join swing traders for the full heist or scalp quick moves with high leverage (if your capital allows). 💰
---
📡 Why This Heist Could Work
The ETH/USD market is currently neutral with bullish potential, driven by:
- Technical Signals: Breakout above the 2500 MA signals strong bullish momentum, supported by higher lows on the 1D chart. 📊
- Fundamentals: Positive sentiment in crypto markets, fueled by macroeconomic trends and institutional interest (check COT reports for positioning). 📰
- Seasonal Factors: Crypto often sees Q2 bullish runs, aligning with our setup. 📅
- Intermarket Analysis: Bitcoin’s strength and USD weakness could propel ETH higher. 🌎
For deeper insights, review COT Reports, Geopolitical News, and Sentiment Analysis on platforms like Bloomberg or Cointelegraph. 🔗
---
⚠️ Risk Management: Protect Your Loot
- News Alerts: Avoid new trades during high-impact news (e.g., FOMC, CPI releases) to dodge volatility spikes. 🗞️
- Trailing Stops: Use trailing Stop Loss to lock in profits as price approaches 2900. 🔒
- Position Sizing: Never risk more than 1-2% of your account per trade. Stay disciplined! 🚨
---
💥 Boost the Heist! 💥
Support our Thief Trading Style by liking, commenting, and following for more high-octane trade plans! 🚀 Every boost strengthens our robbery crew, helping us conquer the markets together. 🤝 Let’s make money with ease and style! 🏆🎉

$RPLUSDT broken out BINANCE:RPLUSDT has broken out! 🚀
Clean breakout from descending trendline triangle with volume.
Targeting $17.72 (+263%).
Retest zone: $4.60–$5.00
Momentum looks strong, don’t sleep on this move!
DYRO, NFA

Weekly Market Wrap: Nifty Dips 340 Points Amid Global TensionsThis week, the Nifty 50 ended on a cautious note, closing at 24,008, down 340 points from the previous week's close. The index traded within a tight range, hitting a high of 24,526 and a low of 23,935—well within my anticipated levels of 24,900 to 23,800.
Silver Lining: Despite ongoing geopolitical tensions and negative news flow—including war-related developments—bulls managed to defend the critical psychological support of 24,000. That’s a sign of resilience in an otherwise shaky environment.
What’s Ahead?
For the upcoming week, expect high volatility. I see Nifty moving between 24,600 and 23,200. A weekly close below 23,800 could spell trouble for bulls, potentially opening the door for a drop toward major support zones at 23,200 and 23,000.
Technical Outlook:
Monthly & Daily Timeframes: Weak
Weekly Timeframe: Still bullish
So, while long-term charts show vulnerability, the weekly trend gives hope. I'm staying cautiously bullish—but will only turn aggressive once the monthly chart flips positive. Until then, it’s time to stay vigilant, not impulsive.
Global Cues: S&P 500 Holding Up Amid Uncertainty
The S&P 500 closed at 5,659, just 30 points down from the previous week, forming a doji candle—a clear sign of indecision. As long as the index holds above 5,532, there's no major cause for concern.
Bearish Trigger: Below 5,532, expect downside pressure toward 5,458 and 5,392, which could spill over into already fragile emerging markets like India.
Bullish Breakout: Above 5,770, bulls gain momentum, with potential upside targets of 5,821, 5,850, and 5,900. A rally here could bring relief to global equities, including Indian markets.

USDCAD Is Bearish! Sell!
Please, check our technical outlook for USDCAD.
Time Frame: 6h
Current Trend: Bearish
Sentiment: Overbought (based on 7-period RSI)
Forecast: Bearish
The price is testing a key resistance 1.393.
Taking into consideration the current market trend & overbought RSI, chances will be high to see a bearish movement to the downside at least to 1.388 level.
P.S
Overbought describes a period of time where there has been a significant and consistent upward move in price over a period of time without much pullback.
Disclosure: I am part of Trade Nation's Influencer program and receive a monthly fee for using their TradingView charts in my analysis.
Like and subscribe and comment my ideas if you enjoy them!

GBPUSD Is Very Bearish! Short!
Here is our detailed technical review for GBPUSD.
Time Frame: 9h
Current Trend: Bearish
Sentiment: Overbought (based on 7-period RSI)
Forecast: Bearish
The market is trading around a solid horizontal structure 1.330.
The above observations make me that the market will inevitably achieve 1.314 level.
P.S
Please, note that an oversold/overbought condition can last for a long time, and therefore being oversold/overbought doesn't mean a price rally will come soon, or at all.
Disclosure: I am part of Trade Nation's Influencer program and receive a monthly fee for using their TradingView charts in my analysis.
Like and subscribe and comment my ideas if you enjoy them!

KPR Mill (long leg candle)1 year daily chart given bre4ak out
RSI Above 60
Volume Increase
Resistance 1190 crossed now become support
Expected level 1626
formed long leg Bod candle

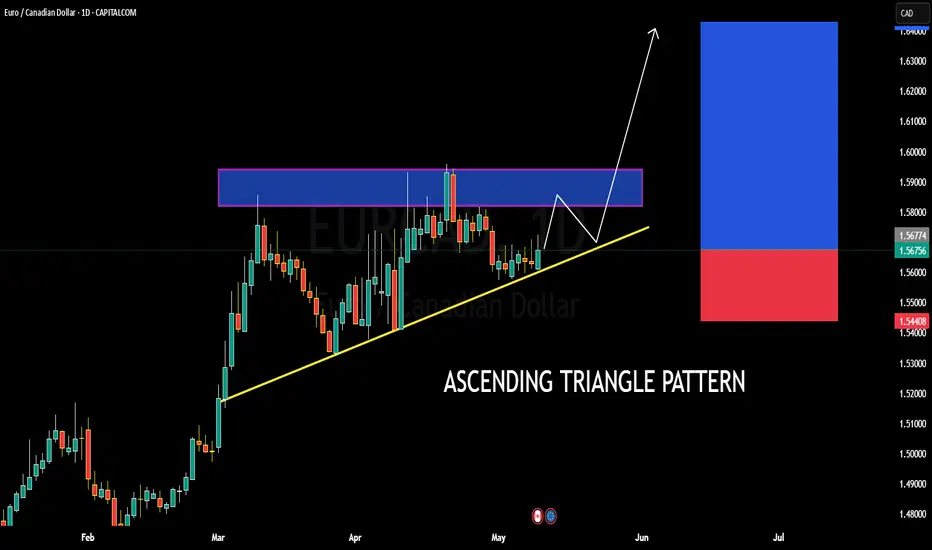
EURCAD BULLISH OR BEARISH DETAILED ANALYSISEURCAD is currently trading around 1.5600 and is consolidating within a textbook ascending triangle pattern on the daily timeframe. This setup signals a strong bullish bias as the pair continues to form higher lows, tightening under a key horizontal resistance zone between 1.5730 and 1.5770. Price is respecting the ascending trendline very well, indicating buyer strength. A breakout above this resistance zone could open the doors for a clean rally toward the 1.6400 psychological level, offering a strong risk-to-reward opportunity.
From a fundamental standpoint, the euro is gaining traction as recent Eurozone economic indicators suggest improving sentiment and a potential shift in ECB tone toward neutral. Meanwhile, the Canadian dollar remains pressured by falling crude oil prices and softening domestic data, including disappointing employment numbers this week. This divergence in fundamentals aligns well with the bullish technical structure for EURCAD, creating a high-probability scenario for buyers.
Looking ahead, a confirmed breakout above 1.5770 with volume could trigger a strong bullish impulse. The measured move from the triangle’s base supports a projection toward the 1.6400 area, making this setup attractive for swing traders aiming to ride the next leg higher. Risk should remain controlled below 1.5440, where the ascending structure would be invalidated.
I’m closely monitoring the price action near the breakout zone. Patience is key, but once we see bullish momentum pushing through the resistance, this trade setup has the potential to deliver a solid upside run. EURCAD remains one of my top bullish forex plays going into mid-May.
NEXT WEEK GBPJPY SIGNAL READ CAPTAINgbpjpy signal technical analysis satup 👇🏼
(gbpjpy) Sell zone
( TRADE SATUP)
ENTRY POINT (193.400) to (193.500) 📊
FIRST TP (193.000)📊
2ND TARGET (193.650) 📊
LAST TARGET (192.100) 📊
STOP LOOS (193.900)❌
FALLOW RISK MANAGEMENT

$TOTAL – Is This Another Bull Trap in the Making?The total crypto market cap ( CRYPTOCAP:TOTAL ) has surged from $2.32T and is currently trading around $3.25T, continuing its upward trajectory. On the surface, things look bullish—but is there more to the story?
Looking at the chart, the current market structure bears a striking resemblance to previous cycles:
• 2021: Massive bull run
• 2022: Painful bull trap
• 2024: Another explosive rally
• 2025: …potential bull trap?
If history is any guide, we could be nearing a critical turning point. The pattern suggests caution—could this rally be setting up for another steep correction?
My Take: Momentum is strong, but the similarities to past cycles are too close to ignore. If the market stalls at current levels, the risk of a bull trap becomes very real.
What do you think—repeat of history or a new chapter for crypto?
Please support this idea with a LIKE👍 if you find it useful🥳
Happy Trading💰🥳🤗

GBPJPY - LongGBPJPY is coming in to the previous daily high a few days ago, there's a Daily FVG 120 pips away. Doesn't seem unreasonable for liquidity to be taken from there before continuing back to the daily VAH level marked.
Short 193.75
TP at 192.00
Long 192.00
TP 195.80

NEXT WEEK EURUSD SIGNAL READ CAPTAINeurusd signal technical analysis satup 👇🏼
(eurusd) buy zone
( TRADE SATUP)
ENTRY POINT (1.12500) to (1.12400) 📊
FIRST TP (1.12800)📊
2ND TARGET (1.13200) 📊
LAST TARGET (1.13500) 📊
STOP LOOS (1.12100)❌
FALLOW RISK MANAGEMENT

BTCUSD SIGNAL READ CAPTAINbtcusd signal technical analysis satup 👇🏼
(btcusd) Sell zone
( TRADE SATUP)
ENTRY POINT (103.600) to (103.450) 📊
FIRST TP (103,000)📊
2ND TARGET (102.300) 📊
LAST TARGET (101.400) 📊
STOP LOOS (104.300)❌
FALLOW RISK MANAGEMENT

APOLLO MICRO SYSTEM LTD- FOR LONG HOLDING POSITION AND SWINGGood bullish candle braekout in Daily time frame. C.P is 130.21 . price range from 122 to 124 can be the reversal area for upside. If price takes a reversal form that point we can go long for swing next week .

Time to short GOLDBeing carefull with the break-out, let’s wait till the break-out is confirmed with the 4H candle Closure. If closed below the trend line, short position is opened.
BTC still has a chance to rise to 108rally base rally with the potential to touch 108000,
the trend is still bullish also we have not seen any reversal or trend transition.
wait for breakout and or confirmation

Ethereum Approaching Key Resistance – Breakout or Rejection?Ethereum ( CRYPTOCAP:ETH ) has been on a strong upward trend since bouncing from the $1500 zone, and it’s currently trading around $2372. All eyes are now on the next major resistance area between $2600 and $2900.
So what’s next—breakout or pullback?
If ETH can push through this resistance with strong momentum and volume, we could see a continuation toward $3000 and beyond.
A rejection from this level could lead to a dip back toward the $1900–$1700 support range.
My Take: The trend is bullish, but this resistance zone is a key test. A strong close above $2900 would confirm a breakout. Until then, caution and close observation are crucial.
What do you think? Will ETH break through or bounce down from here?
Share your thoughts below!
Kindly support this idea with a LIKE👍 if you find it useful🥳
Happy Trading💰🥳🤗

Example of both range indicators Combining Pulse Micro Range and Pulse Range Box provides a powerful dual-layered approach to understanding and trading range-bound conditions with precision. Each tool serves a distinct role—one detecting high-resolution micro consolidations, the other defining broader, structural range zones. Together, they create a multi-depth framework for identifying traps, timing entries, and anticipating breakouts.
Strategic Integration:
• Pulse Micro Range focuses on short-term compressions, ideal for detecting early signs of liquidity buildup, minor fakeouts, or scalping opportunities. It highlights price hesitation within seconds or minutes—perfect for M1/S15 precision trading.
• Pulse Range Box outlines the overall range structure, capturing the dominant high-low boundaries where price repeatedly rejects or traps traders. It provides the context and structure for assessing whether the market is in a range, prepping for a breakout, or stalling.
Benefits of Using Both Together:
• Micro-Inside-Macro View: Micro ranges often form near the edges or midpoints of the larger Pulse Range Box—giving clues to potential fakeouts, absorption zones, or momentum triggers.
• Trap Anticipation & Reaction: If price breaks the Pulse Micro Range but fails to exit the Pulse Range Box, it may signal a trap reversal or re-entry back into range.
• Breakout Qualification: A breakout from both the Micro Range and the Range Box, accompanied by momentum and confirmation from currency strength, can be treated as a high-probability trend initiation.
This synergy allows traders to layer confluences and manage risk more effectively. It enhances entry timing, sharpens exit decisions, and gives a clearer visual map of how the market breathes—both on the surface and underneath.

SOLANA... The next rising Star.Crossed the 38.2 Fib Rt . All cryptos flying. Lets see.
#Crypto
#Solana
#Bitcoin
#Trading

IDEAFORGE TECH - FOR SWING TRADE and Long positionCurrently price has given a very Good Bullish candle breakout in Daily Time frame. Current price is 463.50. Price is making H.H and H.L in DTF. We can go for a Long position in swing trade for next week .

Trade Idea: TSLA Sell – Watching for Bearish Reversal📅 Date: 10/05/2025🕒 Timeframe: 4H
🔍 Market Bias:
Trend direction: Uptrend in the short term
Key structure:
Higher highs and higher lows on both Daily and 4H
Fundamental Bias:
Despite technical strength, Tesla’s Q1 2025 showed weak fundamentals:
Revenue -9% YoY, EPS -71%, margin shrinkage
Global EV sales decline and loss of leadership in Europe
Valuation concerns: current price 86% above intrinsic value
Reputational risks affecting institutional sentiment
📊 Technical Analysis:
Key Support/Resistance zones:
$294 ~ 302 – Resistance zone (potential turning point)
$283 – Support zone (last HL on Daily)
Indicators used:
EMA50, EMA14: Price above both – confirms bullish momentum
RSI: Hovering around 70 (strong but nearing overbought)
MACD: Positive, and still building its momentum
Chart patterns / Price Action:
Clear bullish structure forming HL and HH
Watching for signs of exhaustion at resistance or break of HL
🟢 Entry Criteria:
No entry yet – waiting for confirmation of reversal
Look for bearish candlestick at resistance (e.g., engulfing or pin bar)
Break of 4H higher low structure or EMA50 cross
RSI divergence or MACD bearish crossover to support reversal bias
🎯 Trade Setup:
Entry: Pending – only after confirmation of bearish structure break (e.g., close below $283)
Stop Loss: Above $302 (recent swing high)
Take Profit: TP1 $270, TP2 $262 / ~1:2 RR
⚠️ Risk Management:
Risk per trade: 1% of account
Trade invalidation if: Price continues forming new HHs beyond $302

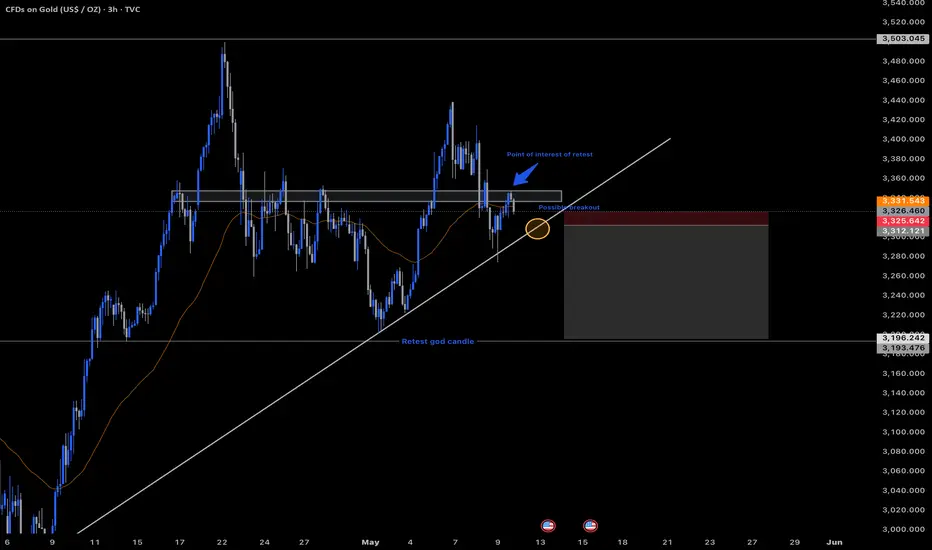
GOLD D1 Chart Analysis Update for 12 - 16 May 25 Hello everyone,
As you can see some levels mentioned in GOLD Chart for upcoming main focus in GOLD For Longer Term Buying 3000 - 3200 is good buying zone for longer term
however you can still follow-up time to time for 1 candle retracement zone on D1
3400 level remains crucial for now
Main events for the upcoming week US CPI & US PPI

BITCOIN ( Is this the final DIP ? )I bought the dip but it just keeps dipping!
it's time to put on my bear glasses and check this ponzi chart !! oh yeah
As you can see in these patterns the moments everyone ready for breakout, bitcoin dumps to another lower level and kills all hopium that moonboyz, frog army and GM gurus got
if you think that you are person who manage to buy the exact number at dip you are wrong too, like people who bought at 60k and had plan to sell at 90k
RSI looks bearish like the pattern , I start shorting at 17490 and not going to close it till 16950$
If you got crypto on Huobi and Gemini exchange watch out too
funds are NOT safu

BTCUSD technical analysis.This image appears to be a technical analysis chart for Bitcoin (BTC) against the US Dollar (USD) on a 1-hour timeframe, from the TradingView platform.
Key Elements:
1. Entry and Trend: The green arrow indicates a bullish trend prediction, suggesting a potential upward movement.
2. Target (TP): Marked at approximately 104,525, indicating the anticipated profit level.
3. Stop Loss (SL): Marked at around 103,204, to limit potential losses.
4. Current Price: Around 103,681, as shown in green, indicating a slight upward movement (+0.67%).
5. Support and Resistance Zones: The chart highlights consolidation and breakout zones, suggesting that the price might have recently broken out from a range.
This setup indicates a long (buy) position with a favorable risk-to-reward ratio. Is there a specific aspect of this analysis you would like to discuss?
