Chart Patterns

AUD/USD pair may form a long-term SELL positionBased on the analysis, the AUD/USD pair may form a long-term SELL trend . Based on this analysis, we can try to enter a Sell position with a small risk margin.

Aptos Preparing For A New All-Time High —$22.22, $33.33 & $44.44Good morning my fellow Cryptocurrency trader, I hope you are having a wonderful day.
Here we have a pretty nice dynamic on the Aptos (APTUSDT) chart. There is a sequence of long-term lower highs and lower lows, yet the chart looks solid and strong.
These lower lows and lower highs are not a bearish trend but rather a long-term, wide consolidation channel. April 2025 produced the lowest prices since Aptos initial low in December 2022.
From a TA perspective, seeing a reversal happening after this event is good news. The August 2024 stop-loss orders placed below this low have been activated, the same for October 2023. This means that liquidity is no longer on the downside. Once support has been challenged, the action moves toward resistance.
While these major support levels were pierced, this only happened for a few days. Now, APTUSDT is trading back above both those low points and this makes the market extremely bullish.
The Altcoins are growing but Bitcoin is not yet trading above 100K. The Altcoins tend to follow Bitcoin, if Bitcoin grows, the entire Cryptocurrency market grows.
The fact that many Altcoins are moving ahead and producing 2-3 digits green means that this is the real deal, we are ready for the 2025 bull market. This is to say, that the next rise for Aptos will not end in another long-term lower high, we are set to experience a new All-Time High. This is seen on the chart as $22.222, $33.333 and $.44.444. These are the levels for this bull market cycle.
When Bitcoin moves above 100K, expect the Altcoins market to explode!
Thank you for reading and for your continued support.
Namaste.

FLIPZONEWe have seen a very powerful SND pattern called flipzone, where price pierced the Supply Zone but printed what became a demand zone before violating the SZ and BOS. A retest of this zone gives us a possible long set up.
Lets see how it will playout

NVO at supportNVO at long term support here, IMO one of the cheapest plays in the market, has been obliterated with BS reports etc on it being far behind meanwhile its drug profiles in the pipeline show significant strength over LLY.. this is a no brainer imo im long targets 80-100-120

Gold has the strength to keep rising At the end of the week gold confirmed the formation of the trading range, support 3286, resistance 3356. I consider the continuation of realization of potential of false breakout of support as a positive scenario. If gold holds above 3313, the market may continue buying, which will lead to a rise to ATH
Scenario: the price is in a local descending channel, but in a global bullish trend. A bounce to 3313 from the channel resistance may occur, followed by a continuation growth to 3342 or to 3356.


EUR/USD Neutral, AUD/USD Neutral and EUR/AUD (Trade Recap)EUR/USD Neutral
Minimum entry requirements:
• 1H impulse down below area of interest.
• If tight non-structured 5 min continuation follows, reduced risk entry on the break of it.
• If tight structured 5 min continuation follows, reduced risk entry on the break of it or 5 min risk entry within it.
• If tight non-structured 15 min continuation follows, 5 min risk entry within it if the continuation is structured on the 5 min chart or reduced risk entry on the break of it.
• If tight structured 15 min continuation follows, reduced risk entry on the break of it or 15 min risk entry within it.
Minimum entry requirements:
• If structured 1H continuation forms, 1H risk entry within it.
AUD/USD Neutral
Minimum entry requirements:
• 1H impulse down below area of interest.
• If tight non-structured 5 min continuation follows, reduced risk entry on the break of it.
• If tight structured 5 min continuation follows, reduced risk entry on the break of it or 5 min risk entry within it.
• If tight non-structured 15 min continuation follows, 5 min risk entry within it if the continuation is structured on the 5 min chart or reduced risk entry on the break of it.
• If tight structured 15 min continuation follows, reduced risk entry on the break of it or 15 min risk entry within it.
Minimum entry requirements:
• If structured 1H continuation forms, 1H risk entry within it.

STOCKS LOWER??This is what Im gauging on the NAS100, as well as the Dow Jones and SnP500 (even though the charts aren't presented).
Technically, I see a 4H QM which sets the high, with the lows not giving the same HTF strength that the highs have given. We've got a nice trading range as price hasn't realigned for the stocks to show its true bullish direction to the ATHs, meaning I see this huge sell off continue until those lows have been ran. I see price printing lower.
Fundamentally, I like to think of the worst case scenario for Trump and the season we're in currently, its made me nice trades. Lets see

Brace for a 10% drop on solana (just the beginning…)No drama — just charts.
Solana’s hanging around $136, but don’t let the calm fool you.
We’ve already seen Break of Structure (BoS) and Change of Character (ChoCH) — structure has shifted.
Now I’m watching:
🔹 FVG starting at 135.7 (136 good choice)
🔹 Order Block between 137.0 – 138.5
This is where the first leg of the drop begins.
Short-term target: $125
That’s about a 9% move — but this is just the beginning.
I expect a much deeper move to follow — but for now, this is the setup worth tracking.
Status: Setting up
Confidence: High
Timing: Imminent
The Wolf is watching.
You’ve been warned.
– Alpha Sigma Wolf
“Not all howls are warnings. Some are confirmations”
#Solana #SolanaShort #CryptoTrading #TechnicalAnalysis #SmartMoneyConcepts #FVG #OrderBlock #AlphaSigmaWolf #TheWolfSees #WolfOfCrypto #PriceAction #ChoCH

GOLD SMASHES THROUGH $3,450🚨 GOLD SMASHES THROUGH $3,450 – IS THIS THE START OF A GLOBAL FINANCIAL RESET? 🚨
🔥 Unstoppable Surge in Motion 🔥
Gold has soared past $3,450 as Asian markets opened, climbing over $100 a day!
In just two weeks, gold is up by over $500 — this isn’t just a rally, it’s a major structural breakout.
A surge in demand from Chinese funds appears to be fuelling the rise, with increasing evidence that Asia is leading a strategic shift away from fiat risk.
💷 Is the Dollar in Decline? Investors Flee the Old System 💷
The US Dollar Index (DXY) has taken a sharp downturn — confidence in USD is clearly under pressure.
Capital is flowing out of the United States, signalling a move away from the traditional financial order dominated by the dollar.
This gold rally isn't just about price — it's a global vote of no confidence in the status quo.
📉 Implications for the UK
With the pound holding relatively stable against the dollar, this gold spike presents a unique hedge opportunity.
For UK investors, rising gold prices could help offset currency risk and inflation concerns — especially in the face of persistent market uncertainty and geopolitical tensions.
📊 Technical Overview 📊
Gold is currently testing critical resistance around $3,519.
A pullback may see it retest support at $3,416 or as low as $3,210.
Fibonacci levels indicate a likely consolidation zone around $3,416.
The momentum is strong — we could be in the early phase of a global asset rotation.
📈 2-Hour Gold Chart Insight
Recent charts show a parabolic move with significant volume, primarily from Asia-based buyers.
This is not a short-term speculative move — it's likely a long-term strategic repositioning.
🌍 What Comes Next? 🌍
Should gold maintain levels above $3,450, a move towards $3,600 and beyond looks increasingly likely.
Talk of a financial "reset" is no longer just fringe theory — it’s entering the mainstream conversation.
From a UK perspective, now could be the time to:
Re-evaluate gold as a portfolio stabiliser
Reconsider exposure to US-denominated assets
Anticipate further volatility across fiat currencies
📌 Key Price Levels to Watch:
Resistance: $3,519 / $3,601
Support: $3,416 / $3,210
Upside Target: $3,600+
📈 Suggested Trading Zones:
Buy Zone
Entry: $3,424 – $3,422
Stop Loss: $3,418
Take Profit Targets: $3,428 / $3,432 / $3,436 / $3,440 / $3,450
Sell Zone
Entry: $3,604 – $3,606
Stop Loss: $3,610
Take Profit Targets: $3,600 / $3,596 / $3,592 / $3,588 / $3,584 / $3,580
💬 What’s your take? Is gold signalling the end of USD dominance?
Is the UK prepared for a global monetary shake-up? Let’s discuss. 🪙

Bitcoin alert drop to 82kBitcoin’s dancing around $87,000, but the music’s about to stop.
We’ve got early Break of Structure (BoS) and clear Change of Character (ChoCH)—momentum’s fading fast.
Right now, I’m watching for a rejection off the upper range, which could trigger a sharp correction.
🔻 Target: $82,000
That’s a ~6% move.
Not massive—but definitely fast.
This isn’t the big drop…
Just a warm-up for something nastier.
You know how it goes—first they shake the weak hands. Then they bite.
Status: Setting up
Confidence: High
Timing: Soon.
You’ve been warned. The Wolf sees it before the pack does.
– Alpha Sigma Wolf
“Not all howls are warnings. Some are confirmations.”
#Bitcoin
#BTC
#BTCShort
#CryptoTrading
#TechnicalAnalysis
#SmartMoneyConcepts
#PriceAction
#BreakOfStructure
#AlphaSigmaWolf
#WolfOfCrypto
#TheWolfSees
#ChoCH

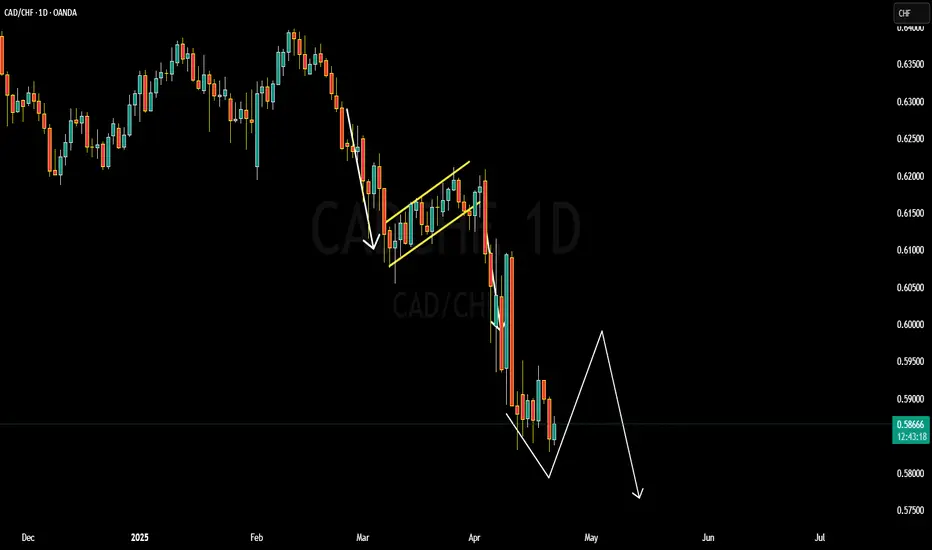
CADCHF BULLISH OR BEARISH DETAILED ANALYSIS We closely monitoring CADCHF, which is currently trading around 0.588. The pair has been in a strong downtrend, reflecting the broader weakness in the Canadian dollar against the Swiss franc. Technical indicators, including moving averages and momentum oscillators, suggest continued bearish momentum.
Fundamentally, the Canadian dollar is under pressure due to declining oil prices and a cautious stance from the Bank of Canada regarding interest rate hikes. In contrast, the Swiss franc benefits from its safe-haven status amid global economic uncertainties. The Swiss National Bank's relatively stable monetary policy further supports the franc's strength.
Key support levels to watch are at 0.57 and 0.58, while resistance levels are at 0.6050 and 0.6100. A break below the support could signal further downside potential, whereas a move above the resistance might indicate a reversal. Traders should remain cautious and consider macroeconomic developments when making trading decisions.
In conclusion, CAD/CHF presents a bearish outlook in the near term, influenced by both technical and fundamental factors. Monitoring economic indicators and central bank policies will be crucial for identifying potential trading opportunities in this pair.
Spring Loaded Wedge? Let the setup come to you! $SPXLowkey top watch for the next few weeks!
It was a chop zone last week = consolidation? Now zooming out, it’s looking like a loaded wedge/flag forming. A lot of bearish sentiment, tariff talks and unknown lately but this is looking mighty interesting of a formation. Volume also slowly declining, wondering if we’re setting up for once a decision/mutual agreement is made with US, China + others involved.
Green ray is my ENTRY: 5372.44
*Also eyeing 5329.66*
- For potential upside. We have a few gams above to also fill and can magnet upwards if we get news, volume etc.
Looking for the banger* here - of course, things are still brewing. Note this is the HOURLY timeframe. Wait for the setup to come!
Let me know your thoughts! Appreciate any insight. Do your DD! #NFA AMEX:SPY SP:SPX

AUD/USD $AUDUSD update M1 D1 H4 - NO shorts in 2025Monthly SFP + Weakness of the main currency
Forget about short positions for the next year
This might be the best entry point for long of the year
H4
Without closing the imbalance, they shouldn't go up, so I expect such a scenario
Based on all the data, I expect a local strengthening of the dollar in May and only growth after that
Best regards, EXCAVO
_____________________
Disclosure: I am part of Trade Nation's Influencer program and receive a monthly fee for using their TradingView charts in my analysis.


EURUSD 4/22/2025EU sell, catching the RTO of HTF BEARISH POI BMS. Holding price till 50% of 4 hr range. Entry is a bit before 50% of the oB just to make sure we get in the trade

LINKUSDT 1D AnalysisLINK ~ 1D Analysis
#LINK Buy after successfully penetrating this resistant line with a short -term target of at least 10%+.

XAUUSD 15mint ForecatHello guys, I hope you are well here let me tell you that the bearish order block has been touched, it is heading towards gold sale, our target will continue till FVG.


BTC/USDSomething like this makes the most sense from manipulation perspective.
I'm sure much was learned from the 2020 crash.
Say you build a shelf for your garage, hindsight says could've used screws instead of nails here and should've clamped there, wood glue, different joint style, etc etc etc... but the finished product won't look significantly different or have any change in functionality.
Sharp dive somewhere in the 40k region is my guess.


EURUSD 4H LongTrading Idea: Long Position on EURUSD
This chart illustrates a short position on EURUSD, capitalizing on Fibonacci Retracement and Order block
Analysis:
• Market Structure: The overall market structure is in bullish mode.
• Fair Value Gap: With recent breakout (both internal and external), the market created fair value gap, hence we expect retracement to fill that gap before giving further breakout.
• Fibonacci Retracement: We expect the market to retrace to the Fibonacci Golden level of 61.8%
• Order Block: We can also place another limit order near the Order Block.
Trade plan 1:
• Entry: 1.13705
• Stop Loss: 1.13144
• Take Profit: 1.15733
• Risk-Reward: 1:3.5
Trade plan 2:
• Entry: 1.2922
• Stop Loss: 1.1239
• Take Profit: 1.14082
• Risk-Reward: 1:2
Disclaimer : The information provided here is for educational purposes only and does not constitute financial advice. Trading in financial markets involves significant risk and may not be suitable for all investors. Past performance is not indicative of future results. Always do your own research and consult with a licensed financial advisor before making any trading decisions. The author is not responsible for any losses incurred as a result of using this information.
