COMPUSDT LongPure Price Action
Entry 1: 58.70 - 58.50
Entry 2: 57.20 - 56.40
TP 1: 72.00
TP 2: 80.20
TP 3: 97.00
NFA
COMP

COMP/USDT Long position COMP/USDT Long low risk position (just technical analysis , no funda)
Open: 58.68
Target 1: 60.83
Stop loss: 57.90


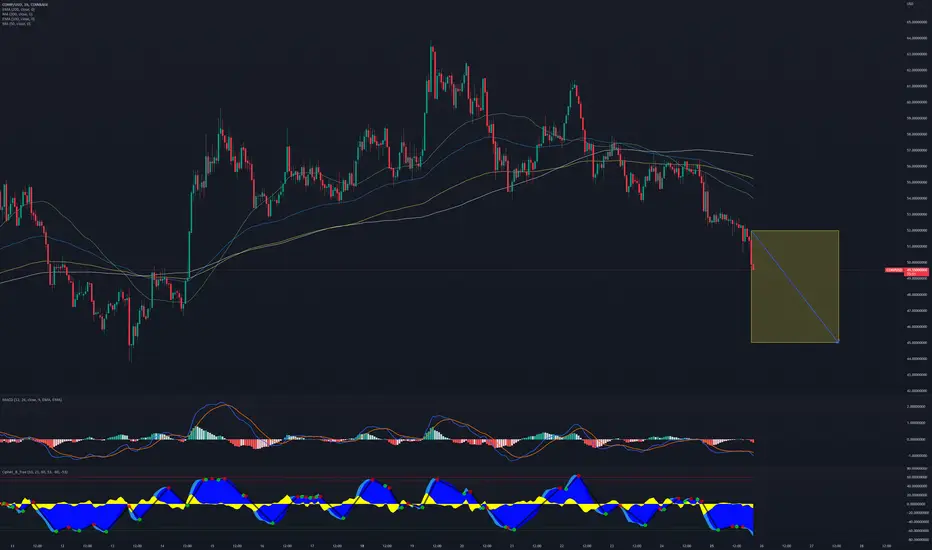
COMP USDT SHORT SWING| COMPUSDT | SHORT @ 52 - 50 | TP @ 49, 48, 47, 46, 45 | SL @ 58 | PATTERN = TRIPLE BOTTOM BREAKDOWN | COINBASE |
TRIPLE BOTTOM BREAKDOWN ON BPI CHART HOURLY
Swing trade idea. Kindly follow targets and stop loss. Will update with new targets once all 5 are achieved. Mostly trading with PNF charts, MACD, RSI, Stoch, BPI, Cipher, MA/EMA, Support/Resistance on hourly timeframes and higher time frames
COINBASE:COMPUSD BINANCE:COMPUSDT BINANCE:COMPUSDTPERP BINANCE:COMPUSD BITSTAMP:COMPUSD BITFINEX:COMPUSD FTX:COMPUSDT BYBIT:COMPUSDT
Compound Is Ready To Grow Strong After Hitting Bottom (75-150%) For Compound (COMPUSDT), the bottom was confirmed as soon as we saw the highest volume in many months 25-June.
But we could spot this type of action happening even before that through the 'bottom volume method' explained in a recent article.
As COMPUSDT now trades above EMA50, the bulls are in full control of this chart.
The next target is set at 75%.
It can go higher to 150% in the weeks ahead.
Namaste.

Compound vs Bitcoin Long-Term (Bullish Confirmed)The bullish bias has now been confirmed for Compound.
We are looking at COMPBTC but also COMPUSDT has gone bullish.
Notice the candle marked 13-June.
The Doji with -8 TD Sequential count marks the low.
The full green candle that follows confirms the low.
The current candle with a long wick below EMA10 (0.002376) just to recover and close the week above this level confirms the bullish bias.
With these signals in, the low, bounce and test of short-term support, we can expect prices to start moving up.
A change of trend = Long-term growth.
Long-term growth = Higher highs and higher lows.
Namaste.

Compound Cup & Handle Breakout Target (45%)We have a perfect C&H pattern now breaking bullish on the COMPUSDT chart.
We have high volume, green candles and bullish indicators...
This is all pointing higher.
The target is set at 45% from the current prise based on the chart pattern.
There can be additional growth.
Namaste.
--
Disclaimer: All the information shared here is intended for learning and/or entertainment purposes only.
Make sure to do your own research and build a plan/strategy before trading.

Long idea COMPThinking this time the breakout from this macro trend (resistance) is different as price action and the lagging strand has managed to find it self above the cloud on the 1 hour. There seems to have occured like a floating retest (not 100% on this terminology) with a sort of mini flag formation here.
Target overhead is 2 x the risk, which takes us to revisit the local high once more.
COMP/BTC looking very healthy.

COMP - breakout attempt no.6?COMP going for the break once more. This diagonal resistance has been hounded. Surely it will break now.
The fib mapping gives some nice levels, to take profit and then to sit and wait for the retest of the resistance as support.

An alert just went off COMPAn alert of mine just went off. COMP just broke through the upside of a falling wedge that has been in place since august 2021. Exciting times. Lets see where this one goes.
Good luck everyone. Will zoom out on charts and post below.

Compound vs Bitcoin | Triple ReversalGood Sunday my fellow cryptocurrency trader, we will focus on 3 signals only for Compound vs Bitcoin (COMPBTC) today.
Feel free to support our work in whatever way you see fit!
Let's get started!
COMPBTC 3X Bullish Chart Signals
(1) Full Green Candle (Break above EMA10)
Today's candle is full green on rising volume.
This candle is also breaking a downtrend;
Breaking above EMA10 after a Doji...
(2) Doji Candlestick
-8 Doji at a new low closing green predicts this weeks candles.
(3) RSI Bullish divergence
A very strong divergence on the RSI with more than a year in place.
Compound looks good vs Bitcoin.
Namaste.

Compound (COMP) formed huge Gartley for upto 856% big pumpHi dear friends, hope you are well and welcome to the new trade setup of Compound (COMP) token.
On a monthly time frame , the price line of COMP has formed bullish Gartley pattern.
Note: Above idea is for educational purpose only. It is advised to diversify and strictly follow the stop loss, and don't get stuck with trade

COMP compound price movement predictionPrice Prediction
not financial advice
this is for entertainment purposes only
always DYOR

📊 COMP broke the downtrend channel. What's next?Hello, dear TradingView members.
This idea is a COMP analysis.
COMP also broke the downtrend channel a few hours ago, and we're waiting for more confirmation.
The upper band of the downtrend channel can confirm the breakout and work as support.
Another support level is also static and shown on the chart.
The price is now testing a resistance area, and it can reach the potential targets shown on the chart in case of crossing.
Scenario one:
The price will increase, and the buy volumes in the market can help the price reach the potential target levels.
Scenario two:
The price will lose Buy volumes, get rejected by the static resistance level, and fall into the support zone.
RSI is showing overbought signals, so be careful with your long positions.
The Speedometer indicator shows Sell volumes on the market for COMP on a 1D interval.
Now have in mind: ANY news about this coin can cause a big pump or dump at this moment!
Let me know if you guys have any questions;
I will be more than happy to help.
Good luck, and thank you.

Compound Bottomed Out! 230% Potential Profits Next!We are looking at Compound (COMPUSDT) and after two days of bullish action finally a break above EMA10 happens, signaling that the bulls are now in control (candle closure needed for full bullish confirmation).
Notice that the trading volume is still at basically zero.
The RSI made a strong jump and the MACD is showing a bullish cross.
Once the volume comes in, the value of COMPUSDT can have a sudden jump.
It will be fast.
It will be profitable.
It is entertaining and fun.
Buy. Sit back relax watch and enjoy.
Namaste.

COMP Quick Idea for LongHi everyone!
This idea explores price action using one of my favorite indicators, the Gaussian Channel. I used the 4 hour chart and went back some time to see how Comp behaves when we drop below the Gaussian Channel. I was able to find very similar price action not that long ago and outlined it for all to see. There has been a sequence of tests and rejections on t& top lines of the channel along with the 20MA in both cases. We also see a defined bottom formed which leads me to believe we are gearing up for a retest of the trend line. I have a target of approximately $82. This is right where we will be meeting the 50MA & coincidentally the trend line we have been getting rejected from. Even with all this considered I intend on staggering profits just in case we don't see a pump that high. This idea, as always, all depends on what Bitcoin decides its going to do.
Please let me know what you thing.
Like comment and follow for more ideas and remember, ALWAYS DYOR.
Thanks,

Cup and Handle Chart PatternYou can clearly see the pattern of the cup and handle in one hour time frame, and since this pattern is bullish pattern and can experience a 16% price increase by breaking the trend line, I have described the entry points with the image. This is not a buy or sell signal and act on your decision.
God willing, that you will be profitable...

The sexy blonde 2 lockers down :) COMP following the last week liquidations. I have decided to check out the number of On-Chain liquidations amongst major protocols. Comp turned out to be the biggest winner. Most users did not suffer during the retracement and retained their HODL capacity, not being margin called by the protocol. This is incredibly bullish in a Risk-Off environment as users seek safer investments and services.
In matters of TA. The comp Token which is a governance token cannot get much sexier than this chart. My final target for comp and level I would be comfortable shorting is anywhere between 917-3615$. By this I mean I would only close longs untill the valuation stands above 3615$!
By far the sexiest chart in the defi field.
Will be longing it now, DCAing, hodling for the long term. I may have found myself a new crypto wife :P
#LOOOOOONG

COMP looking interestingA full retrace all the way back down, and beyond old support. Would be nice if it get back inside that really low support.
Falling descending wedge could break causing quite the uptrend.

Strongest Bottom on COMP about to Happen Entry = 88.5$
Stop = 78$
Will not miss this ride and will keep editing the targets !

LONG COMP @ 128-129 Compound is a protocol on the Ethereum blockchain that establishes money markets. Money markets are pools of assets with algorithmically derived interest rates. Suppliers (and borrowers) of an asset interact directly with the protocol, earning (and paying) a floating interest rate. Compound is now available on DeFi Swap. Users can swap Compound, be Compound Liquidity Providers to earn fees and boost their yield when staking.

Mirror pattern on $PYPL continues to nail itMirror pattern on $PYPL that I have been posting here continues to perform. Has expanded in time in a bit over the last month.

🆓Compound (COMP) Apr-17 #COMP $COMP
COMP is still holding on to its price after a strong rally from April 12. This could help COMP move further to the $200 zone in the near term. However, if it loses the $140 zone, it will continue to plummet and the support zones we might consider buying are at $125 and $110.
📈RED PLAN
♻️Condition : If 1-Day closes ABOVE 140$ zone
🔴Buy : 140
🔴Sell : 160 - 180 - 200
📉BLUE PLAN
♻️Condition : If 1-Day closes BELOW 140$ zone
🔵Sell : 140
🔵Buy : 125 - 110
❓Details
📈Red Arrow : Main Direction as RED PLAN
📉Blue Arrow : Back-Up Direction as BLUE PLAN
🟩Green zone : Support zone as BUY section
🟥Red zone : Resistance zone as SELL section
