BTC, Daily, LongBTC, Daily, Long
Based on Hyper block liquidity
!st Target 84K
2nd Target 86k
3rd Target 90k
Contains IO script

XAUUSD ShortWhat a Monday that was! Price broke way below 3000 and even hit 2954 level. It was a little shaky so I opt to not put in my positions, even if my predictions were correct, I chose to play safe. Today, price is still a little unstable but placing a position so to catch some pips if ever. Iv placed an SL just for Tradingview purposes, here's my position info: Open at 3014// SL 3164//TP 2964. As usual we decide as we go, but let's see how this trade rolls :)
Day 19of100
L:5
W:4

Quantum's ZIM Trading Guide 4/8/25
NYSE:ZIM
(ZIM Integrated Shipping Services Ltd.) - Sector: Industrials (Shipping)
Sentiment:
--Bearish (slight softening). Pre-market put volume softened, RSI likely ~35 (down from ~38 with a -2.8% drop from $12.9608 to $12.591), X posts overnight mixed—tariff fears dominate, but LNG fleet news (10 new 11,500 TEU vessels announced April 8) offers faint hope, suggesting a less aggressive sell-off than March’s lows.
Tariff Impact:
--Severe. 10% universal tariffs raise fuel and container costs, with 46% Vietnam tariffs threatening Asia-U.S. routes (70%+ revenue). Sentiment overshadows fundamentals, though LNG fleet modernization and freight rate resilience provide a slight buffer.
News/Catalysts:
--Consumer Credit (April 8) could signal trade demand—weak data may deepen ZIM’s slide; X posts on the $2.3B LNG charter deal (announced April 8) and potential freight rate stabilization (e.g., Red Sea tensions) might spark a relief rally today.
Technical Setup:
--Weekly Chart:
---HVN near $15 as resistance (March 25 high: $15.2512), weekly low ~$12.4106 as support
---Downtrend (8-week EMA < 13-week < 48-week, reflecting $12–$20 range since March).
---RSI ~35 (weakening, near oversold),
---MACD below signal (histogram narrowing),
---Bollinger Bands at lower band,
---Donchian Channels below midline,
---Williams %R -80 (oversold).
-One-Hour Chart:
---Support at $12.81 (April 7 prev. close proxy), resistance at $13.547 (April 7 high), weekly confluence.
---RSI ~37, MACD below signal (histogram less negative),
---Bollinger Bands at lower band,
--- Donchian Channels below midline,
---Williams %R -78 (easing from oversold).
-10-Minute Chart:
---Pre-market drop to $12.591, 8/13/48 EMAs down, RSI ~35, MACD flat near zero.
Options Data:
--GEX: Bearish (softening)—pinning near $12.9608 eases pre-market, dealers less aggressive.
--DEX: Bearish—put delta leads but with reduced intensity.
--IV: High—~55–60% vs. norm 45–50%, reflecting tariff-driven volatility.
--OI: Put-heavy—OI concentrated below $13, capping upside momentum.
Directional Bias: Bearish (softening). GEX’s fading pinning reduces downside lock, DEX’s put delta sustains selling but softens, high IV supports volatility without sharp drops, and put-heavy OI anchors lower—bearish with less conviction.
Sympathy Plays:
--SBLK (Star Bulk Carriers): Falls if ZIM dumps (shipping correlation), rises if ZIM rebounds.
--MATX (Matson, Inc.): Drops with ZIM downside, gains if ZIM recovers.
--Opposite Mover: ZIM dumps → defensives like KO rally; ZIM rallies → SBLK/MATX surge.
Sector Positioning with RRG:
--Sector: Industrials (Shipping)
---RRG Position: Lagging Quadrant (slight improvement). ZIM’s pre-market softening from $12.9608 eases its lag vs. XLI, buoyed by LNG news.
Targets: Bullish +4% ($13.50, hourly resistance); Bearish -5% ($12.00, near April low).

BTC Bounce Zones + Reversal Signals Scenario BTC Bounce Zones + Reversal Signals Scenario .
Let's wait a bit guys.
Bulls are coming 🤑

This is Wyckoff Volume Spread Analysis Gotcha Bar with No DemandIn this short video, Author and Trader, Gavin Holmes explains a Wyckoff Volume Spread Analysis Gotcha Bar followed by No Demand on the four hour chart of the E-Mini S&P Futures contract.
This set up appeared last week and again today and is a clear indication of market weakness.
As I type this the headline on BBC News is "Global Markets Plummet as US Tariffs Take Effect.
Panic selling is often an opportunity for the chart readers who can identify a Shakeout, not here yet but watch, I will keep You all posted. Best wishes, Gavin Holmes

The Trump PatternWhen Donald Trump took office in 2017, the U.S. stock market experienced dramatic fluctuations—marked by steep declines followed by eventual rebounds.
This pattern, which we'll call the "Trump Pattern," repeated itself during his presidency and is now emerging again as a point of interest for investors.
While the specific causes of these market shifts varied, key factors—particularly tariffs, inflation concerns, and Federal Reserve (FED) actions—played critical roles in the market's rise and fall during Trump’s presidency.
The Trump Pattern: The Market Fall and Recovery
🏁 1. The Start of the Trump Presidency (2017)
When Donald Trump was elected in 2016, the market responded with a combination of excitement and uncertainty. Initially, the market surged due to tax cut expectations, deregulation, and optimism about a business-friendly administration. But as Trump's presidency fully began in January 2017, concerns over trade wars and tariff policies began to dominate investor sentiment.
The market initially dipped after Trump began pursuing a protectionist trade agenda, especially with China.
As concerns about tariffs escalated, stock markets reacted negatively to potential trade wars.
💶 2. The Tariff Crisis of 2018
The first major example of the "Trump Pattern" emerged in 2018 when Trump began implementing tariffs, particularly on Chinese imports, and announced new tariffs on steel and aluminum. This caused major market disruptions.
The S&P 500 fell dramatically during this period, dropping by as much as 8.6% from its February peak in 2019.
Companies that relied heavily on international trade, like Apple, General Motors, and Ford, experienced significant stock price declines. In fact, Apple’s stock fell 9.5% on days when new tariffs were announced, as their costs for manufacturing overseas rose.
The uncertainty surrounding the global economy, combined with rising tariffs, created fears of a trade war, leading to sharp market declines.
📈 3. Market Recovery: FED Rate Cuts and Tax Cuts
Despite the tariff-induced volatility, the market didn’t stay down for long. After significant market falls, the Federal Reserve (FED) began implementing interest rate cuts to combat slowing economic growth. These actions helped stabilize the market and even fueled a rebound.
FED rate cuts made borrowing cheaper for consumers and businesses, stimulating economic activity and boosting investor confidence.
Additionally, tax cuts, a cornerstone of Trump’s economic policy, provided further support, particularly for corporations.
As a result, after the initial market drop in 2018 and early 2019, the market rebounded, continuing to climb as investors reacted positively to these fiscal and monetary policies.
🎯 The 2024 and 2025 "Trump Pattern" Emerges Again
Fast forward to 2024 and 2025, and we’re seeing echoes of the "Trump Pattern" once again. New tariffs, introduced in 2025, have reignited concerns about a trade war. These tariffs, particularly on Chinese imports, have once again caused market volatility.
The stock market has fallen in recent months due to concerns about these tariffs and the impact they might have on global trade. For example, when new tariffs were introduced in early 2025, the market saw a sharp sell-off, with the S&P 500 falling by over 1.8% in a single day.
Companies that rely on international trade, like Tesla and Ford, have seen their stock prices drop in response to concerns about increased production costs.
The broader market decline, much like in 2018, was driven by fears that tariffs could slow down the global economy and hurt corporate profits.
However, there is optimism that the same pattern will unfold, where the market eventually recovers after these initial drops.
⚠️ 4. FED Rate Cuts Again?
As inflation concerns persist, the Federal Reserve is likely to step in once again. Like previous cycles, we expect the FED to cut interest rates to stimulate the economy. This would be aimed at reducing borrowing costs, encouraging investment, and helping businesses weather the impact of higher tariffs and global uncertainty.
The FED’s actions are typically a key driver of market recovery in the "Trump Pattern." Investors have come to expect that a market downturn triggered by political or economic disruptions can be offset by the FED’s supportive monetary policies.
⚖️ Navigating the Trump Pattern: What Should Investors Do?
The "Trump Pattern" highlights that during periods of heightened uncertainty, especially due to trade policies like tariffs, the market will often experience short-term declines followed by long-term recovery. Here are a few strategies investors might want to consider:
Stay Diversified : During periods of volatility, having a diversified portfolio can help cushion against the risks posed by market swings.
Invest in Domestic Companies : Companies that rely less on international supply chains might fare better during periods of trade policy changes and tariff uncertainty.
Focus on Growth : Once the initial market decline subsides, look for sectors that stand to benefit from a recovering economy, such as tech or consumer discretionary stocks.
Look for Inflation Hedges : Given the potential for inflation, consider investments that tend to perform well during these times, such as real estate or commodities like gold.
📝 Conclusion: The Trump Pattern in Action
The "Trump Pattern" demonstrates how the market tends to react in cycles during the early months of each presidency. Typically, the market falls at the start due to the uncertainty surrounding Trump’s trade policies, particularly tariffs. However, after these initial drops, the market often rebounds thanks to FED rate cuts and other policies aimed at stimulating the economy.
Looking ahead to 2025, we're already seeing signs of this pattern in action as tariffs are back on the table and market volatility has followed. However, history suggests that patience might pay off. Once the FED steps in and cuts rates, a market rebound is likely, following the same trend we saw in 2017-2019.

Gold Longs 8/4/25Testing longs from this weekly buyside imbalance sellside inefficiency. H4 Inversion FVG targeting buyside liquidity

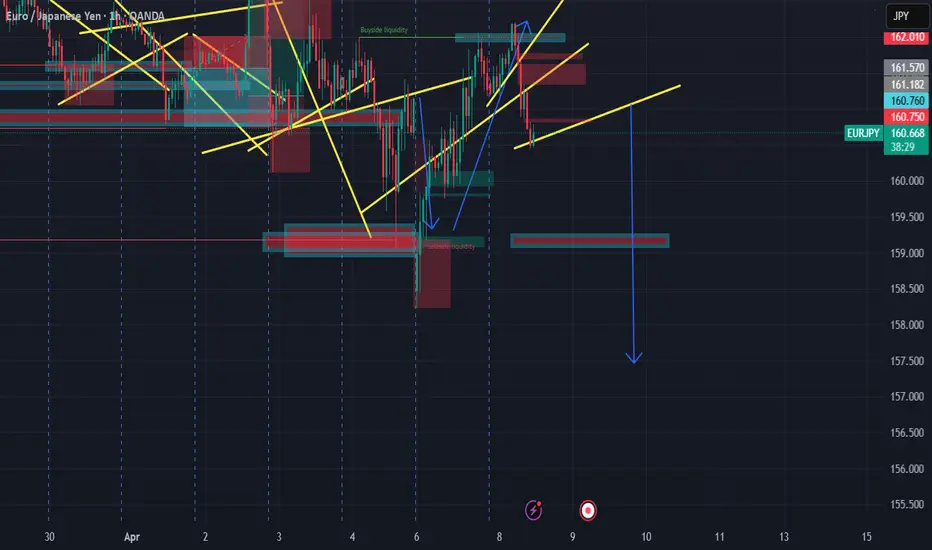
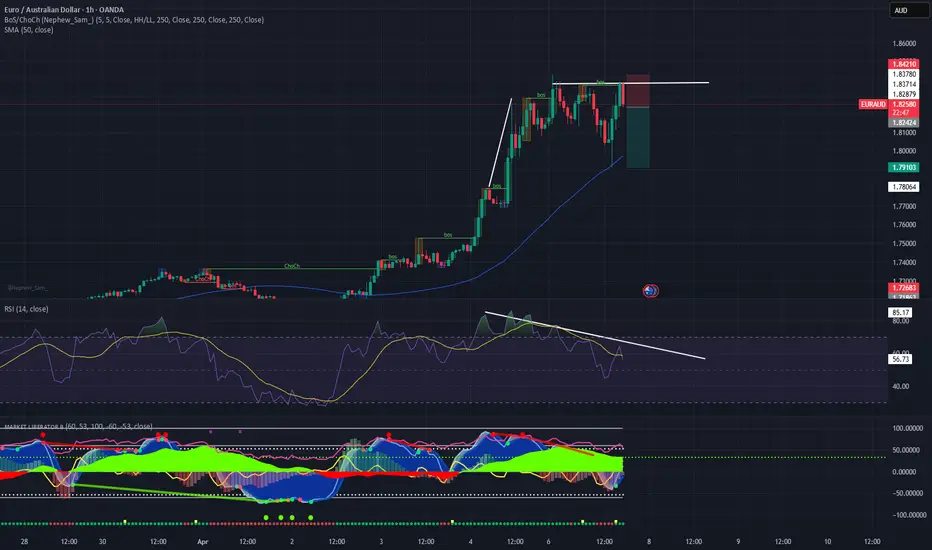
expecting eur jpy to take a FULL SLIDE TO THE DOWNSIDE158.461 DOWNSIDE TARGET for eur jpy im expecting a full liqudity slide
on structure until we see some sell side exhaustion in price action
Nike (NKE) - Monthly Chart Setup | High-Conviction Support Zone📉 Nike (NKE) - Monthly Chart Setup | High-Conviction Support Zone
Nike has officially broken down into a major multi-year support zone last seen in 2017–2018. This area has previously acted as a strong base before the massive run-up to ATHs, and we’re now seeing price re-enter and potentially bottom out in this same zone.
🔍 Key Observations:
Price is currently hovering near the $55–$65 demand zone, marked by previous structural support.
Bullish wick shows demand kicking in after a breakdown.
Indicators are oversold:
RSI around 31, near bounce territory.
Stoch RSI crossed to the upside from deeply oversold.
MACD histogram still bearish, but early signs of momentum loss.
📌 Base Case: Expecting some sideways accumulation within this zone, followed by a potential breakout retest toward the $80–$90 range if momentum builds.
📥 I'm slowly accumulating here on a 2-week basis while price remains within this support region.
⛔️ Invalid if monthly closes under $50 with no demand reaction.

FXAN & Heikin Ashi Trade IdeaBINANCE:ETHUSD
In this video, I’ll be sharing my analysis of ETHUSD, using FXAN's proprietary algo indicators with my unique Heikin Ashi strategy. I’ll walk you through the reasoning behind my trade setup and highlight key areas where I’m anticipating potential opportunities.
I’m always happy to receive any feedback.
Like, share and comment! ❤️
Thank you for watching my videos! 🙏

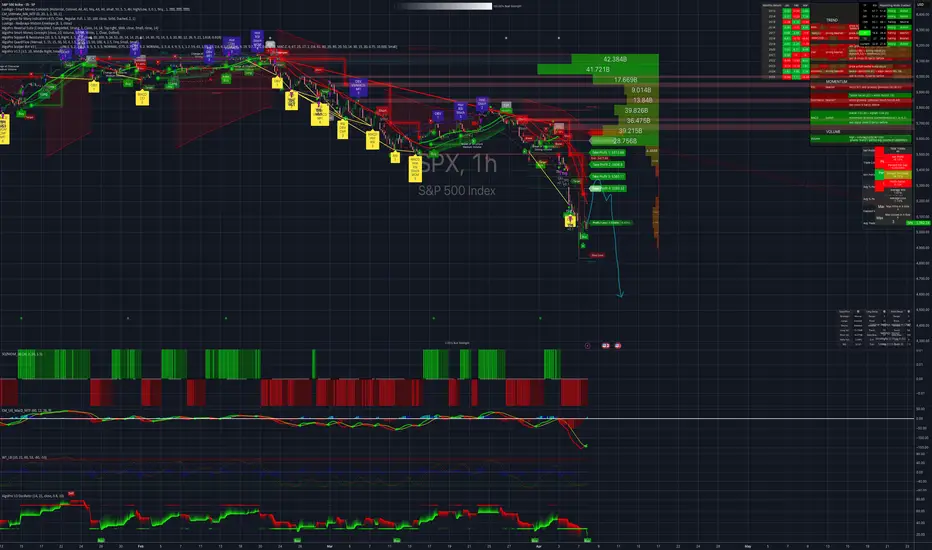
[H] SPX 4.8.2025This deserves a closer look.... The orange thug is going to destroy the biggest economy inevitably. Sadly, stock charts are just the beginning, and things will escalate fast. Brace for a world order change.
TSLA Trade Thesis (Test)TSLA is holding strong at current demand. In order for price to rise, it will have to invalidate closest supply, if demand cannot hold, expecting price to sell off
:bulb: Trade Plan:
Entry Zone: $75.34
Stop Loss: $42.85
:dart: Targets:
Target 1: $139.27
Target 2: $217.02
Raise your stop-loss to entry price once we price reaches $98.95
:mag: Reasoning:
The double correction may be ending at that level for the stock market.

Gold correction to set-up the stage for a multi-year run?I think one should monitor Gold closely as it may be setting up for a multi year run.
I provide levels to watch.

simple BTCUSDT paterrn and ordeblocks t/asimple pattern analysis with 12hr orderblocks (liquidity) momentum clip possibly incoming green doton market cipher B making it also possible to push price higher never guaranteed.

BTCUSDT T/A MIXjust some t/a on possible levels of interest on BTCUSDT to the downside if continuation happens. could all change in 2 mins. UP IS (DOWN DOWN) IS UP

USDT.D(based on NEo wave) short termIm waiting for wave f and g but not sure about f
we should wait for it to show the pattern and breaking down 5.4 will confirm the bullish market.

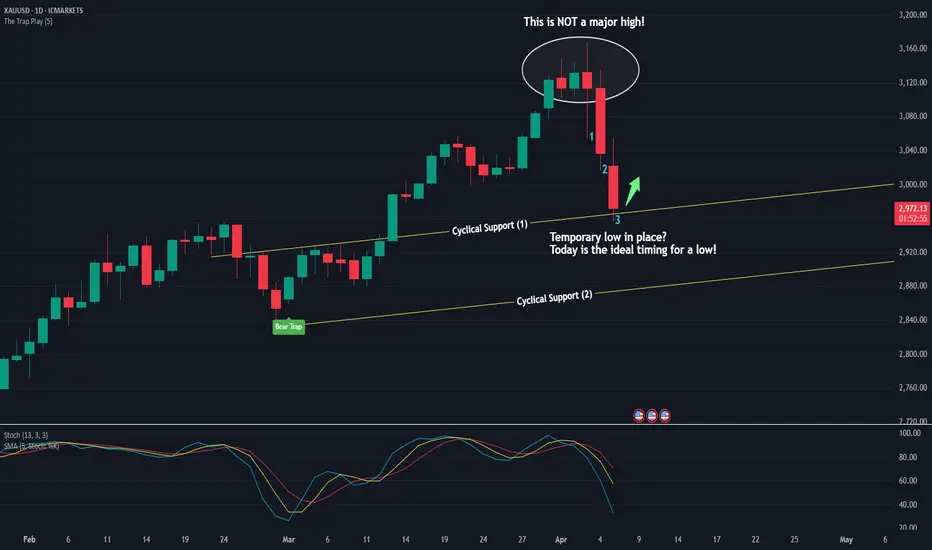
Temporary Low or All-Time Bottom for Gold?Last week marked the ideal timing for a weekly high, which turned out to be accurate.
Today represents the ideal timing for a daily low. Whether this low will be temporary or mark a more significant bottom remains to be seen. From a cyclical perspective, gold has corrected for three time units, which aligns with projected support. Therefore, a bounce tomorrow is likely, as corrections typically last only 1–3 time units. Exceeding this range would suggest a continued decline becomes possible, potentially down to the second support line.
There is still a possibility of a larger "FALSE MOVE" to the downside.
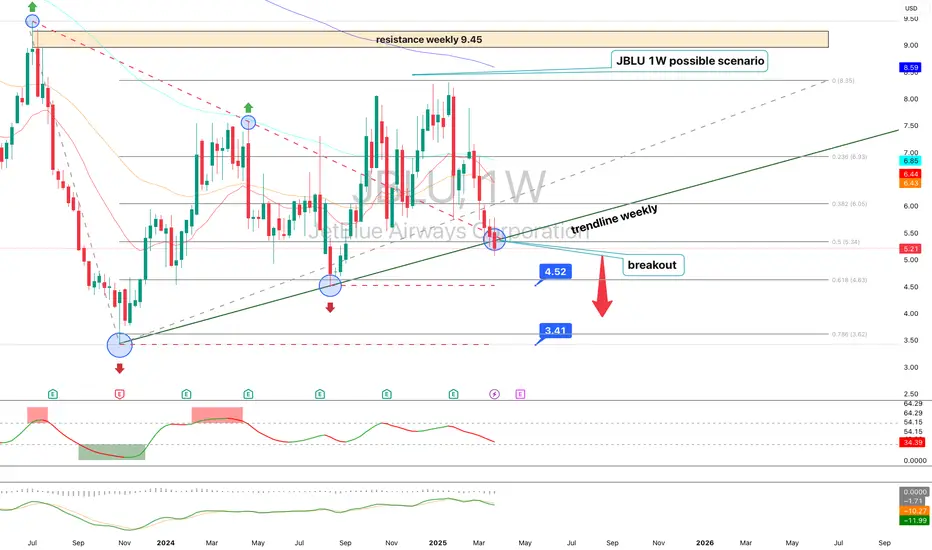
JetBlue Airways (JBLU) – Technical Analysis 1WJetBlue shares have broken a key weekly trendline, reinforcing a bearish outlook. After breaking support at $5.21, the price is heading toward $4.52 and potentially $3.41.
Technical indicators confirm the weakness: RSI shows declining momentum, MACD signals a bearish crossover, and EMA 50/200 indicate sustained selling pressure.
Fundamentally, the airline sector faces macroeconomic instability, rising Fed rates, and volatile fuel prices. A close below $5.21 will confirm the downtrend, targeting $4.52 and $3.41, while a recovery above $6.44 could signal a potential rebound.
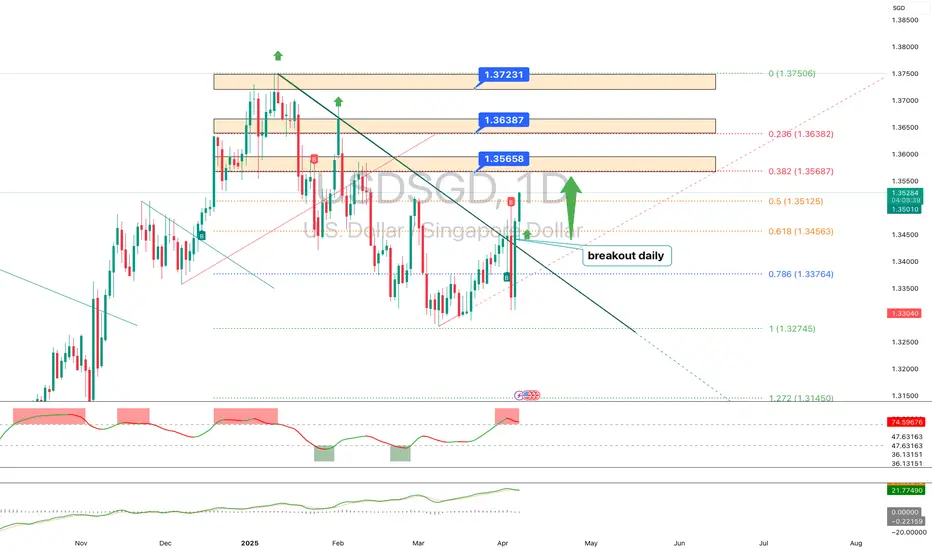
USDSGD – Technical Analysis (1D)USDSGD has broken out of a descending trendline on the daily timeframe – signaling a potential shift in short-term momentum. Price has held above 1.3510, confirming the breakout and opening the door to resistance zones at 1.3565–1.3638 (aligned with 0.382 and 0.236 Fibonacci levels).
If bulls stay in control, next targets lie at 1.3723 and 1.3750. However, a short pullback toward the 1.3450–1.3480 support zone (0.618 Fibo) is also possible.
🔹 Main scenario: continuation to 1.3565 → 1.3638 → 1.3723.
🔹 Alternative scenario: drop below 1.3450 toward 1.3376 or 1.3274.
Cardano (ADA) Long using Lesson 15 MethodologyAlready first target was hit and moved stop loss to BE.
Lesson 15 Methodology:
1. Largest Down wave on support (could have buyers in there)
2. Place AVWAP at the beginning of the down wave
3. Wait for price to cross upwards the AVWAP and pull back to it.
4. Wait for a Plutus long signal where in this case it was a PRL
and up we go!
Now this huge pin with the enormous volume worries me for sellers but since we got 1st target and stop is at BE I will let it run.

BTC.D( based on NEo wave)Bitcoin dominance is too messy for counting but I just count 2 time frames and I find out there is a little bearish wave on the way but breaking 62% confirms this.
if it happens good bullish wave can make eth over 4K

Market Structure is broken - Another - 0 DTE Call Spread on SPXThis may be my last super aggressive Call Spread on SPX, then will watch how the market plays out rest of this week.
-5000 +5005 expires today, 18%
Everything is off atm.
Only options play this week, otherwise I'm a huge buyer of Crypto.

How to use MAD Indicator to capture trend and reversals?Market Anomaly Detector (MAD): Real-Time Performance Analysis
Overview
The Market Anomaly Detector (MAD) Indicator efficiently identifies market momentum shifts and volatility breakouts, clearly marking bullish and bearish opportunities . This real-time chart demonstrates the practical efficacy of MAD in capturing timely market entries and exits.
Indicator Functionality
Mainline (Blue Line): Static reference indicating general market context about the trend (non-trading but act as support and resistance sometimes.
Upper Band (Green Line):
Buy signal when price closes above, indicating potential bullish continuation.
Sell signal triggered if price closes back below, indicating bearish reversal.
Lower Band (Red Line):
Sell signal when price closes below, confirming bearish momentum.
Buy signal activated if price closes back above, signaling bullish recovery.
Performance Insights (from attached chart)
Timely Bullish Signals
Strong bullish signals clearly marked with green backgrounds as price closed decisively above the green band, capturing rapid upward momentum.
Reversal entries triggered effectively as price reclaimed and sustained above the lower red band, indicating bullish recovery.
Accurate Bearish Entries
Precise bearish signals generated consistently upon the price closing below the lower red band, accurately capturing sustained downward movements.
Price rejection at the upper green band confirmed bearish reversals, signaling timely market exits.
Volatility and Momentum Clarity
Contraction phases reliably indicated reduced market activity, clearly distinguished from momentum-driven expansions.
Band expansion highlighted impending volatility, providing actionable insights for traders.
Key Takeaways
✅ Accurate bullish/bearish signal generation at key band interactions.
✅ Consistent reliability in pinpointing volatility-driven market shifts.
✅ Effective filtering of market noise, ensuring clarity in real-time analysis.
✅ Strong alignment of signals with subsequent market trends and reversals.
This performance snapshot reinforces MAD's utility as a robust analytical tool for traders navigating complex market conditions.
