GBPUSD Possible Trade idea GBPUSD H4
After a Bullish BOS, Currency Pros Indicator can identify
Discounted price for possible long positions
targeting the newly created swing high.
Strange enough EU did this before making a new high, but GU made the new high first then went for this LQ grab.
Makes it hard to have confidence on the trade but looks valid.
Contains IO script

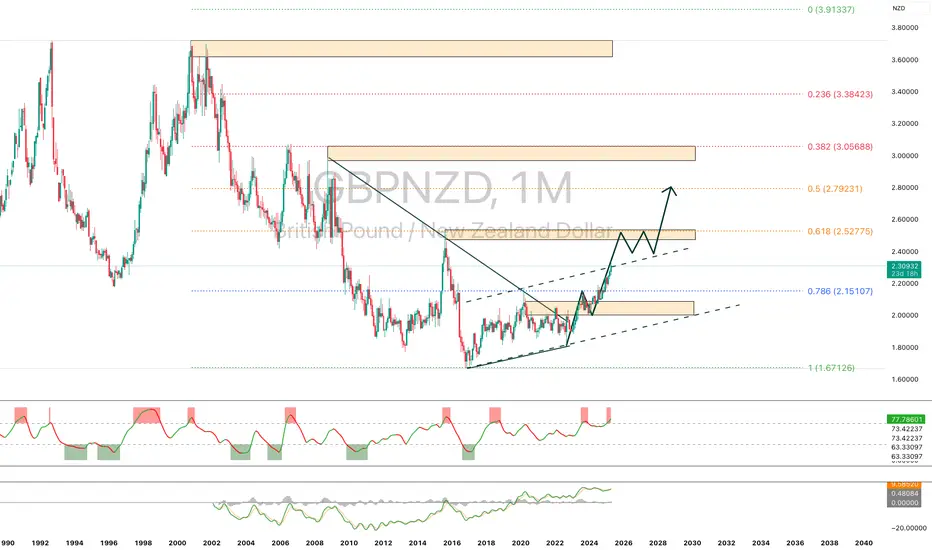
GBPNZD – Technical Analysis (1M)Following a breakout from a multi-year narrowing channel, GBPNZD has established a bullish trend above a key resistance level. Price is now approaching a major supply zone around 2.52–2.55, where a consolidation or pullback may occur. A breakout above this zone could pave the way toward the 0.5 Fibonacci level at 2.79 – a major upside target.
Momentum indicators are in overbought territory, suggesting potential correction or sideways action before further continuation. Chart structure indicates a potential bullish flag or accumulation range forming.
Main scenario: price pulls back to 2.42–2.45 before continuing upward to 2.79.
Alternative scenario: rejection below 2.30, leading to a deeper retracement toward 2.15.
CAN BTC HOLD THIS PARRALELL CHANNEL??Bitcoin has been holding this parralell channel for quite awhile now.
So it's been very bearish with money flow and bearish diverging oscillator on high timeframes.. if it breaks below the channel it could surely be the bear market until next BTC halving!

Gold (XAUUSD) – Technical Analysis for April 7, 2025 (1H)After a sharp drop, price reached the key demand zone around 3025-3030. This area forms a potential buy zone from which a rebound toward 3080–3100 may occur. The chart suggests a possible W-shaped recovery. A breakout above 3100 could unlock further upside toward 3127 and then resistance at 3167.
However, a breakdown below 3015–3020 could increase bearish pressure and lead to a decline toward 2997 support. Indicators are showing signs of local oversold conditions, hinting at potential technical recovery.
Main scenario – reversal from 3025-3030 with a move toward 3080–3100.
Alternative – breakdown to 2997.

SPX500 & Nasdaq: Confluence! Confluence! Confluence!With consumer confidence off at circuit breaking levels, the market, technically, has reached extreme levels of support. Let's look at it:
Technicals:
(1) Horizontal Levels of support
(2) 50%/61.8% fib confluence
(3) exDiv1
(4) extreme indicators
(5) Chikou span testing cloud support
(6) 28% drop is SPX
All of these levels are lining up around the same location. And just like in real estate "Location! Location! Location!" is the adage; in markets, "Confluence! Confluence! Confluence!" is the adage!

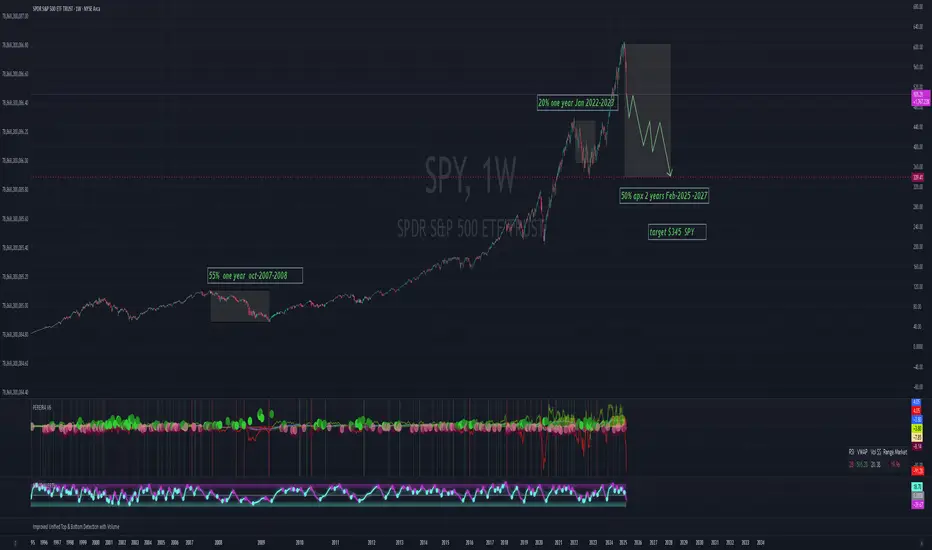
This is a test on SPX500Short thesis for SPX500
🚨 Market Alert: SPX500 Approaching Critical Zone
(April 6, 2025)
Volatility (VIX) just surged to 45—markets are feeling significant fear. This creates high-quality swing-trading opportunities.
🎯 Why this area is important:
Key Support Flip: Previous strong weekly resistance could now act as critical support.
High-Timeframe Imbalance: SPX500 is retesting the exact demand zone that launched the powerful rally from October 2022 → February 2024.
50% Fibonacci Level: Perfect retracement to the midpoint of the entire 2022–2024 bullish leg.
⚠️ What I'm watching for (No-Chase Method):
✅ Lower-timeframe liquidity sweeps + Break of Structure (BOS) as confirmation.
✅ Volume spikes indicating smart-money engagement.
✅ Signs of VIX easing (below ~35), reinforcing bullish reversal thesis.

SNP500 / SPX🔍 SPX/USDT Analysis: Daily Timeframe 📉
SELL IT!
The SPX chart on a daily timeframe highlights significant upcoming dates where price movements may present trading opportunities. These should be analyzed in conjunction with higher timeframes for a comprehensive market view.
• September 3, 2024 - Red Line: This date marks a potential local peak. Traders might consider this as a moment to take profits or reduce exposure, as the price could encounter resistance or a downturn.
• December 6, 2024 - Red Line: This date is another potential local peak, signaling a possible moment to exit positions before a downturn.
When working with this daily timeframe, remember to evaluate these movements within the context of the broader market trend, considering higher timeframes for a more global perspective.
Note: The exact timing of these phases can vary by +/- a few days. All times are based on UTC-7 (Los Angeles).

SPYAs investors, we must understand that in order for consumers to access cheaper products, sacrifices will be required in several key areas. Adjustments in Federal Reserve monetary policy (changes in the federal funds rate and balance sheet reduction) will directly impact GDP and real income. Likewise, consumer prices will reflect the impacts of inflation (CPI) and fiscal policies. Increases in labor costs (adjustments in wages and employment costs) will also play a crucial role in these changes. Private consumption (PCE) will be pressured by these dynamics, and businesses will have to decide between maintaining profit margins or passing these costs onto consumers. The key will be how these adjustments in prices and wages are negotiated, as the market seeks a new equilibrium between supply and demand. Prepare yourself, as these adjustments are part of a long and challenging process, but they are inevitable.
#SPY #SP500
THE KOG REPORT - NFP Con'tTHE KOG REPORT:
In last week’s KOG Report we said we did what we needed to, all the levels were completed, all bullish and bearish targets hit, the bias worked to a tee and we won’t say anymore.
So, what can we expect in the week ahead?
Simple one, we’ll use the same chart from the NFP Report for now. We’ve taken the short trades into the EXC targets, we got the level we wanted, we got the TAP AND BOUNCE finally, and now we’re protected!
For the above reason we’ll stick with the move as it stands, unless we get taken at BE, then we’ll look for the lower hot spot as a potential region. So below we have 3025-7, which if support should give us the push up we want into the 3045 region initially, and above that 3050-55. That’s the region we want to monitor for the break, otherwise, if we can form a swing there with a reversal, we’ll look to continue the move downside.
Short and simple this week traders.
As always, trade safe.
KOG

NZDCAD Trade Setup - 06/Apr/2025Hi Traders,
I expect this pair to start to go up very soon.
The trade RR depends on your trading style and management.
The expected highlighted move is based on For3xScalper findings regarding its special zones combined with WTW special wave concept.

XAUUSD weekly analysis Gold has been in a downtrend covering pass liquidity zones, right now price seems most likely about to pullback maybe to chase a new all time highs. If price fail to do so we can se price go back to the levels of 2980 or 2930. Taking in count the narrative of the world right now, everything can happen this new week.
Hopefully we will be ables to see a new all time highs this week.
GFX SAN. :))


Nasdaq what to expect next?The Nasdaq has declined approximately 23% from its all-time high, positioning us near a notable discount on a global timeframe. In my professional assessment, this presents a compelling opportunity to begin constructing a diversified portfolio. However, I anticipate further downward movement in the near term, so I recommend a measured approach—allocate capital gradually rather than deploying all available cash at once. Consider initiating positions through Contracts for Difference (CFDs) or Exchange-Traded Funds (ETFs), focusing on high-quality, blue-chip equities such as Microsoft (MSFT), Apple (AAPL), NVIDIA (NVDA), Nike (NIKE), and Walmart (WMT), among others.
That said, I advise against overcommitting capital at this juncture. The potential for an economic recession remains, and the market could trade sideways for an extended period—potentially one to two years. Prudence is warranted.
Additionally, the Fear and Greed Index for U.S. stocks currently stands at 6, a level strikingly close to the 5 recorded during the COVID-19 market crash. Those familiar with market history will recall the significant rebound that followed. This historical parallel suggests a potential inflection point.
Personally, I am actively participating in this market, incrementally rebuilding long-term positions within my investment account. Opportunities of this magnitude are infrequent, occurring perhaps once every few years. However, this does not preclude further declines—markets can always test lower levels. From a statistical perspective, though, the current environment supports initiating long-term investment positions with a disciplined strategy.
Let me know if you’d like a deeper analysis of specific assets or portfolio allocation tactics!
NOT FA!


Us100 updateHi traders what is your opinion this week a sell or a buy,according to the strategy n my view,the target is 168 which is likely to hit n am expecting bull run to take over from this 2023 highs soo note that am positioning my self for big move,first thing this market is n uptrend market with weird n normal pull back this one was abnormal do to trade war which it's still going on,soo guys this all sell off is not a threat it is giving you a chance to ride long trades what you have to do is to generate liquidity into position n make sure you hold your trades for big rewards,before you overthink I identify the trend n find the really trend beside pull back understand what is moving n why I am going to buy,note that we are 6% away to recession do me favour invest in knowledge soo that you can be in high level of thinking and seeing things n not overthinking everything knowledge is power,I wish you all profitable week ahead.

Are We Witnessing a Black Swan Event?I’ve spent most of the day digging through charts and studying past crashes — because what we’re living through right now might be a once-in-a-decade opportunity.
This current market crash feels eerily close to a black swan event.
No one really expected Trump to push tariffs this far, and the consequences are already rippling through global markets. If this escalates into true economic isolation, the effects could be both tremendous and long-lasting.
That said, there’s another possibility:
This might just be a blip in history — a bold negotiating tactic that works out, shocks the system temporarily, and fades away.
There’s even speculation this could mirror the 1989 crash, with some analysts warning of a potential 20% drop by Monday.
If that happens, I’d rather not be frozen by fear. I want to act with intention. I want my plan in place and my orders ready.
Before I share stock ideas I believe can outperform in the long run…
Let’s first walk through what I believe might be playing out — at least for now. (Keep in mind, these theses can change fast.)
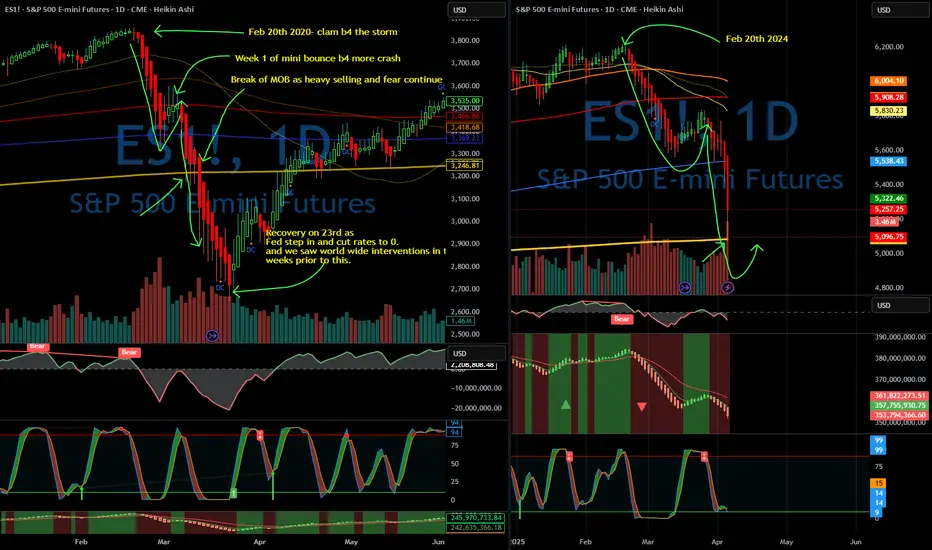
Before the crash, it looked like a replay of 2022:
Markets were clearly overvalued and due for a correction — back then, it was driven by regional bank failures, and the Fed quickly stepped in to stabilize things.
But now, selling pressure is accelerating.
This looks less like 2022 and more like 2020 — where markets broke down in response to a larger, fast-moving, global crisis.
Even though we’re seeing similarities, things can shift very quickly.
We still haven’t seen key reversal signs — like a Doji candle — and more importantly, there’s been no intervention yet from the government or global forces.
Until that happens, panic may continue to snowball.
And as we know from history, panic doesn’t operate on logic.
Source:
📚 2020 Stock Market Crash en.wikipedia.org

Pi network is trying hard.I know recently the Pi pioneers are getting mad because of the prices are getting lower, be chill, be cool guys.. that is the process to making a new high and lows. It has to be that way in the market. All what we need it patients and time, the rest let the news and core team make it happen.
According the chart pattern, we need to wait the breaking of 4hour chart structure bearish patten to be broke, and waitting the next equil to break up. Foresee if the equil is brok, we will see the sunlight of $1.00 mark up.


Key Observations From the XAUUSD COT DataKey Observations From the OANDA:XAUUSD COT Data
Non-commercial traders hold 324,333 long positions vs 73,451 short positions, showing strong bullish sentiment.
Spreads: Significant spread positions (332,329 contracts) suggest hedging strategies, but the longs clearly dominate.
Let’s break down this COT data and identify actionable insights for your XAU/USD trading strategy.
Here's my interpretation:
________________________________________
1. Open Interest Analysis
Total open interest is 851,437 contracts, which reflects the market's overall participation. A change of 24,835 contracts from 03/25/25 suggests increased market activity and potential volatility.
This surge might indicate that traders are repositioning ahead of significant events, which could align with your BBMA setups.
________________________________________
2. Non-Commercial Positions (Speculators)
Long: 324,333 | Short: 73,451 | Spreads: 332,329
Speculators hold significantly more long positions compared to short positions, indicating bullish sentiment.
The large number of spread positions (332,329 contracts) reflects hedging or complex strategies. This group expects potential movement but is balancing risks.
________________________________________
3. Commercial Positions (Hedgers)
Long: 136,052 | Short: 412,893
Hedgers (like producers or processors) are heavily short, suggesting that they are locking in current prices to mitigate risk if gold prices fall. This aligns with bearish sentiment from the commercial side.
________________________________________
4. Changes in Positions
Non-Commercial: Slight decrease in long positions (-391 contracts), but a notable increase in short positions (+7,312 contracts). This suggests speculators are preparing for possible downside risks.
Commercial: Both long (-18,799) and short (-28,736) positions decreased. This may indicate some unwinding of hedging activity.
________________________________________
5. Percent of Open Interest
Non-commercial positions account for 38.1% long and 8.6% short, showing speculative dominance on the bullish side.
Commercial traders hold 48.5% short, reinforcing bearish sentiment.
________________________________________
6. Integration Into My Strategy
Bullish Sentiment (Non-Commercials):
Combine this with your BBMA analysis:
Check for EMA50 support and Middle BB interaction near key Fibonacci retracement levels (e.g., 61.8% or 50%).
Look for strong MA5/10 crossing validation for buy setups.
Bearish Sentiment (Commercials):
Use this as confirmation for sell setups at confluence zones:
Price rejection near EMA50 resistance or oversold conditions breaking downward through Middle BB.
Validate sentiment shifts with FS movement and high confluence.
Manage Volatility:
With open interest increasing, consider tighter stop-loss placements and trailing stops to protect against sudden reversals.
TF Daily
Outlook Bullish
- Current at 0.382 (3039.82) from swing price 2832.72 to 3167.83 (ATH)
- 3039.82 at potential daily support level
- Price has stop at mid bb level of FR 0.382
0.5: 3000.27
0.618: 2960.73 (strong support)
TFH4
Outlook bearish
- Current at 0.786 (3035.50) from swing 4 to 5
- Level 0.786 potential reversal from bullish to bearish for mid term
- FE reach level 100% (3023.13) equal leg
0.382: Potential EMA Zone
0.5: Potential mid-bb + MAH Zone
TFH1
Outlook Bullish for H4 Retracement
Fibo Extension reach level 100% (3023.13) equal leg from the ATH
CSE SELL form (3015.65) follow TPW SELL
- TFD at 0.382 (3039.82) from swing price 2832.72 to 3167.83 (ATH)
- 3039.82 at potential daily support level
HIGH RISK SELL SETUP
ENTRY POINT: FR 0.382 (3061.62)
STOP LOSS: ABOVE FR 0.786 (3110.85)
TAKE PROFIT: FR EXT 1.618 (2940.80)
TAYOR

TSLA is coming down to my buy zoneTSLA is coming down to my buy zone. I will be accumulating at 229 and below.
I will start first by selling cash covered naked puts to collect credits until it drops to that zone. The goal is to get assigned with the naked put options at a cost of 229 and below to purchase TSLA shares.
There is a good possibility that the next earnings of TSLA will disappoint and we might get a quick dip. In that case we may even see early 200s. I would be adding more shares there.
Note that this is a weekly chart so it will take some time to play out.
This is a long term hold for me.
Upside Target:
- Nearest upside target is 11.9% above the current price, approximately $267.86.
Downside Target:
- Nearest downside target is -1% below the current price, approximately $237.04.
- Next downside target is approximately $195.65-196
- Support and Resistance: Monitor the support at $217.02 and resistance at $291.85 for potential breakouts or breakdowns.
- Action: Given the bearish sentiment, consider waiting for a clearer bullish signal or confirmation of support holding before entering long positions. Up Volume to Down Volume Ratio 30-Days is 0.86 and 50-Days is 0.78, both below 0.8, indicating bearish sentiment in the near term so wait for it to come down to the buy zone.


China: 34% Tariffs Against US, Impact on Forex Market
Hello, I am Forex Trader Andrea Russo and today I want to talk to you about China's response to US Tariffs. China's recent decision to impose 34% counter-tariffs on US products represents a significant development in trade tensions between the world's two largest economies. This move, which will take effect on April 10, is a direct response to the 10% tariffs imposed by the United States. The announcement has already had repercussions on global markets, with stocks recording sharp declines. In this article, we will analyze the motivations behind this decision, its economic implications and the impact on the Forex market.
Motivations Behind the Counter-Tariffs
China's decision to impose counter-tariffs is a strategic response to the aggressive trade policies of the United States. The 10% tariffs imposed by the US are aimed at correcting what is perceived as an unfair trade deficit and protecting domestic industries. However, China sees these tariffs as a threat to its economic growth and the stability of its exports. The 34% counter-tariffs are therefore an attempt to rebalance the trade balance and put pressure on the United States to review its policies.
Global Economic Implications
The imposition of counter-tariffs has economic implications that go far beyond the two nations involved. Trade tensions can trigger a series of chain reactions that affect the global economy in various ways:
Increased Production Costs: Companies that rely on imports of raw materials and components from the United States will see an increase in production costs, which could be passed on to consumers in the form of higher prices.
Slower Economic Growth: Trade tensions can lead to a slowdown in global economic growth, as companies may reduce investment due to economic uncertainty.
Inflation: Rising prices of imported goods can contribute to inflation, reducing the purchasing power of consumers and increasing costs for businesses.
Forex Market Impact
The Forex market, known for its sensitivity to geopolitical and economic events, is not immune to the effects of the trade tensions between China and the United States. Here are some of the main impacts:
US Dollar Volatility: The increase in tariffs could weaken the US dollar, as trade tensions tend to reduce investor confidence. Demand for US goods could decrease, negatively impacting the value of the dollar.
Strengthening of the Chinese Yuan: China could see a strengthening of the yuan, as its economy could be perceived as more stable than that of the United States in this context of trade tensions.
Federal Reserve Monetary Policy: The Federal Reserve could be forced to review its monetary policy, with possible interest rate cuts to mitigate the economic impact of the tariffs. This could further impact the Forex market, increasing volatility.
Conclusion
China's decision to impose counter-tariffs of 34% on US products represents a significant development in the trade tensions between the world's two largest economies. The economic implications of this move are vast and complex, affecting not only national economies but also the global Forex market. Investors and analysts will need to monitor these developments closely to fully understand their implications and adjust their strategies accordingly.
