GOOGL Coiling for a Breakout? Gamma Walls Say 160+ in Sight 🔍 GEX & Options Flow Insights
GOOGL is setting up for a potential gamma squeeze. The current price is inching just below a critical gamma transition zone between 155–160, where we see:
* High GEX levels stacked at 159.5 and 162.5 (73% and 70% respectively)
* Call Wall alignment across 159–165 levels — dealers may be forced to buy to hedge if we break 155
* HVL (High Volume Level) sits at 148 — marking key put support and invalidation
IVR is 60.5, which shows there’s still premium left to be sold — but it’s not overpriced. That’s a great environment for directional call spreads with gamma flow support.
💡 My Options Strategy Idea (Bullish Bias):
* Play: Bull Call Spread – Buy 155c / Sell 160c
* Rationale:
1. Risk is capped and affordable
2. Profit range aligns perfectly with GEX targets
3. The spread benefits if dealers fuel a move toward gamma wall pressure zones
The GEX landscape suggests upward dealer flows, not resistance, as long as we stay above 152.5–155.
📊 Smart Money Technical View
From a price action perspective, GOOGL has flipped bullish after reclaiming the CHoCH zone. We’re hovering just beneath the key breakout level.
* Trend Bias: Strong Bullish on 30m and 1h
* Volume Note: Very thin (0.04x) — price is rising, but it needs conviction candles soon
* Structure: Bullish CHoCH formed → BOS confirmed → Setup forming
* Target 1: 159.54 (aligned with GEX #1 wall)
* Target 2: 164.31 (near GEX #2 zone)
* Stop: 150 (under structure + below HVL)
🎯 What I’m Watching for Trade Confirmation:
* Hold above 152.5 = bullish continuation
* Break and close above 155 with volume = BOS confirmed → RUNNER potential
* Fade or stall below 151 = caution — wait for re-entry
🧠 My Thoughts & Why This Setup Matters
This is one of those setups where both the options market and smart money price structure are talking the same language — bullish, but not impulsive yet.
What makes it powerful is the layered confluence:
* Dealer gamma exposure creates a pull toward 159.5–162.5
* The technicals show a textbook CHoCH and BOS pattern
* The entry risk is defined, the structure is clean, and volume is the only missing ingredient
If we get confirmation through volume and momentum, GOOGL could become a high R/R long into the end of the week, especially if the market holds up.
📌 Final Summary:
* Direction: Bullish Bias
* Options Strategy: 155c/160c Call Spread targeting 159.5–162.5
* Entry Trigger: BOS above 155 with volume
* Risk Zone: Below 151–150 (HVL + SL)
Let price and flow confirm. This one could rip with the right spark.
⚠️ Disclaimer
This analysis is for educational purposes only and not financial advice. Always do your own due diligence. Manage risk and never trade based solely on external suggestions.
Contains IO script

MSFT at a Decision Zone – Bulls Trying to Take Control!Options GEX Outlook (04/22/2025):
* Current Price: $373
* IVR/IVX: 55.6 / 39.4
* Options Sentiment: PUTs 19.4% (moderately bearish but not extreme)
* GEX Walls:
* Support (PUT Wall): $352.50 (Highest negative NETGEX)
* Resistance (CALL Wall): $380 (69.1% GEX) – this is the most meaningful upside wall
* Implication: MSFT is hovering just under a high-interest gamma zone at $377.5–380. Option sellers may defend this area, making it sticky and resistant. However, if bulls can break and hold above $380, gamma flip pressure could fuel continuation toward $390.
Technical Analysis + Scalping Bias (1H + SMC Co-Pilot):
* HTF SMC Bias (15min): Bullish structure forming, but not fully aligned.
* Trend Strength: Weak to Mixed — price is reacting, but structure lacks full confluence.
* Market Structure: No clear BOS or CHoCH yet, indicating the need for a clean break before committing.
* Volume: Strong Momentum Spike (1.25x) supporting this bounce.
* RSI, MACD, BBP: All Bullish, indicating price strength, but no defined setup yet.
* EMA/VWAP Reaction Zone: Currently testing EMA9 and watching for confirmation.
* Strength Meter: ⚠️ Mixed bias — 2/5 score.
Trade Thoughts:
* Above 374–377.5: This is the short-term battleground. If MSFT can hold this area with volume support, it may move toward the 380–385 gamma wall.
* Below 367.5: Breakdown of this level would invalidate bullish bias and shift momentum back toward 360–355.
* No Clear Trade Yet: You're in a zone of indecision. Scalpers should wait for CHoCH + BOS or break of EMA support to lean into a direction.
Action Plan:
* ⚠️ Stay Patient — Wait for a clean structure shift (BOS/CHoCH) above 377.5.
* ✅ Watch Volume — Sustained volume could confirm a breakout.
* 🔁 Key Levels to Monitor: 367.5 (support), 377.5–380 (gamma wall resistance)
Conclusion:
MSFT is testing resistance near key option gamma walls. Structure is building, but lacks confirmation for a clean entry. If it clears 380 with volume and structure support, the breakout could get legs. For now, manage risk and wait for confirmation.
This analysis is for educational purposes only. Always do your own research and manage your risk before trading.

TSLA GEX & Price Action Outlook – April 23🧠 GEX Sentiment (Options Flow Insight):
TSLA is showing bullish options sentiment, with the HVL (high-volume level) pinned at 240, acting as short-term support. GEX shows strong call resistance at 260–265, with the highest positive NET GEX wall just below that zone. We also have significant put walls stacked down at 220 and 225, forming a clear risk floor.
* GEX Status: Triple Green ✅✅✅
* IVR: 58.9
* IVx Avg: 106.6
* Flow Bias: CALLS 26.5% — moderately bullish
The options oscillator is still trending upward, giving bulls the upper hand — but not an aggressive breakout just yet.
📊 Price Action & Trade Setup (1H + SMC Analysis):
TSLA just fired an explosive bullish move from the 220s, reclaiming 240 and running up toward 250 into resistance. However, the SMC dashboard suggests “No Trade Suggested” yet. Why?
* The price is now entering a premium zone, where R/R becomes unfavorable
* We have no CHoCH/BOS trigger from this zone yet
* EMA9 and EMA21 have not confirmed a full retest yet
* Strength Meter is bullish but not at full momentum
What to Watch:
* If price can hold above 249–250 and break through 252 with volume → 260+ is possible
* If price stalls or rejects around 252, a pullback to 240–241 could be a high-RR dip entry
* EMA9 and EMA21 are critical — volume reactions there will set up the next clean move
* If volume fades below 240 → be cautious of a rollover into 225–230 demand zone
📌 Summary / Thoughts:
TSLA bulls are reclaiming territory fast — but the move is reactionary and volume-driven. For now, I’m waiting for a confirmation BOS/CHoCH in this premium area before committing. Risk is elevated at these levels. I’d prefer a pullback into the 240 zone with EMA confirmation for a cleaner long setup. If we break and hold above 252, targets toward 260–265 open up fast.

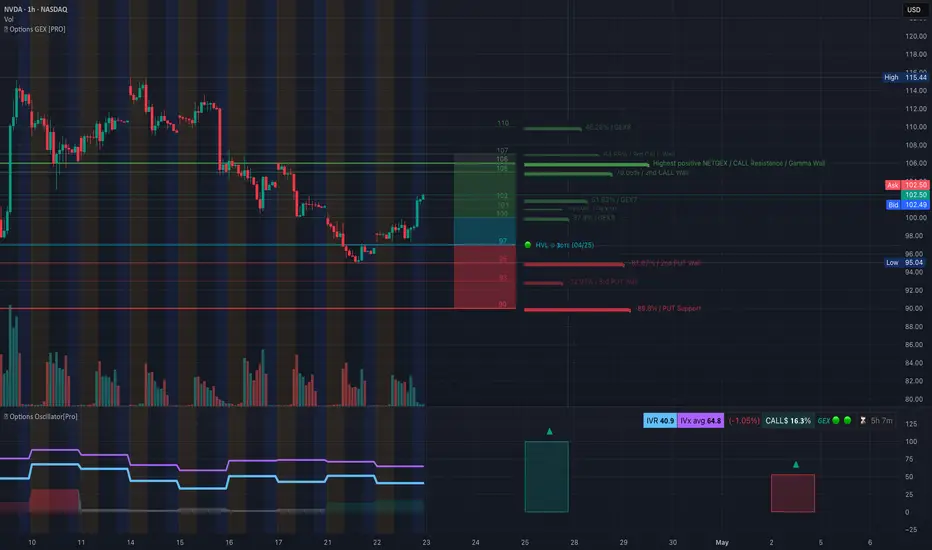
NVDA Options GEX + Trade Forecast – April 23, 2025🔍 GEX Options Overview:
NVDA is experiencing a clear options-driven magnet toward 105–106, with notable call wall concentration and positive NET GEX at those levels:
* Highest positive GEX zone: 105–106 = bullish gamma magnet
* HVL for 3DTE anchored at 97 = strong bounce zone
* PUT walls stacked at 95, 93, 90 showing limited downside support but weakening pressure
* Options Oscillator confirms this bullish lean with green GEX dots, low IVX, and relatively low IVR (40.9)
Despite the macro softness, NVDA has gamma fuel to push up, especially with no strong call resistance until the 105–107 zone. This sets up a favorable risk/reward setup for short-term bullish trades.
📈 Technical Analysis & Trading Outlook:
From the SMC Co-Pilot chart, NVDA is rebounding after forming multiple BOS (Break of Structure) signals and is now consolidating under a previous CHoCH level, near the 102–103 zone.
* Trend Bias (MTF): 30m & 15m bullish, but 1h still recovering
* HTF Structure: Bullish SMC structure forming, but caution is required
* Volume: Extreme spike (1.6x) during reversal = institutions may be stepping in
* Setup Status: No trade confirmed yet – but we are in premium zone, so shorts are risky unless structure shifts
* EMA21 is the decision zone; price reclaiming and holding above would confirm further upside
🧠 My Thoughts:
This is one of those setups where the GEX setup is leading price, and technicals are just beginning to catch up. The move from 97 to 102 was gamma-fueled, and any dip toward 100 or 98 may provide high R/R re-entry zones for CALL scalps or spreads.
No trade now unless we get either:
1. A clean pullback to 99–100 and bounce with confirmation (BOS/CHoCH + volume support)
2. Break and hold above 103.5 with strength — then scalp to 106
⚠️ Avoid chasing at highs without confirmation. Volume and structure will decide whether this is a dead cat bounce or start of a new leg up.
This analysis is for educational purposes only. Always trade with a plan and proper risk management.
PurpleJSE Is printing a Smiley Face PatternPurple Group was a Dog and if Investors sold they lost.
You will see from the history Charts.
However, as scenarios go they can recover.
Here the timing is important.
The MD Mr Savage is listening to his clients and the platform is improving to date.
I have tried to negotiated with Trading View and the Purple Group in the past to provide Easy Equities users a discounted entry price, without a reply from Purple to date.
But Kudos to the Purple Group as the platform is looking way better.
I personally have many suggestions insofar as automatically updating ones local stored data base so that one can manage our own data.
Purple Group is now Printing a Smiley Face Pattern which is positive. I.E Rounding bottom. These patterns can form a Cup and Handle also. Time will tell.
The recent earnings report and subsequent analyst show that this stock can achieve R1.75 in the next 12 months as an expectation offering a potential 40% Upside.
As always if you are unsure please consult with your own personal investment Advisor before making any Trades or Investments as most are 12 months or more views.
Should you like my comments and chart studies - please smash that like button. It's just a click away.
Regards Graham

.55 Inverse H&S move incoming...Inverse Head & Shoulder setup here with a potential .55 move up depending on how you count. Pro Blue Osc Heading back to 0 line with plenty of RSI to run.

BABALICOUS Outlook Part 2 BABA continues the bullish outlook since we called it last on October 23rd.
Babalicous outlook Part 1 :
We continue with our update here!
Baba has broken through our previous resistance/ area of demand and has perfectly retested the zone.
As you can see our Area of demand has always been an area of tough resistance and as of now it is becoming strong support. In addition we have spotted a beautiful rounded bottoming pattern with a target of 80% or $210.00 price target from current levels. If BABA can close this monthly candle as is the $210 price level is sure to be tested!

Bearish Butterfly on the pet rock.pretty textbook if you ask me. Seems like they want some more noob moonboi liquidity before they REK you next month.

BABALICOUS OUTLOOK BABA is Super bullish on higher time frames.
Great entry at current prices.
A move to the $200 level is expected.
Lets see!

April 22st Trade Journal & Stock Market Analysis** April 22st Trade Journal & Stock Market Analysis**
EOD accountability report: +325
Sleep: 3 hour, Overall health: tired
**Daily Trade Signals based on VX Algo System**
— 9:00 AM Market Structure flipped bullish on VX Algo X3!
10:20 AM VXAlgo NQ X1 Sell Signal
10:30 AM VXAlgo ES X1 Sell Signal
10:51 AM VXAlgo ES X1 Sell Signal
11:20 AMVXAlgo ES X1 Sell Signal (Triple signal) C+ set up
1:12 PM VXAlgo NQ X3 Sell Signal (Double X3 signal)
1:30 PM Market Structure flipped bearish on VX Algo X3!
3:00 PM Market Structure flipped bullish on VX Algo X3!
3:10 PM VXAlgo ES X1 Sell Signal (Triple signal) C+ set up

XRP is showing strength after defending the $2 XRP is showing strength after defending the $2 value area low, rejecting downside pressure from the recent swing low at $1.60. The bounce opens the door for a move back into the value area high region.
Key Points:
$2 support has held, with a confirmed swing failure pattern below $1.60.
Value area high near $2.30 aligns with descending channel resistance.
While price remains within a high time frame descending channel, the current bounce could trigger a short-term rally toward the top of the range. As long as $2 holds and volume improves, a 15% upside rotation remains likely. But without volume confirmation, price may stay range-bound.
XRP is holding key support above $2 after a swing failure at $1.60, setting up a potential 15% move toward the range high. However, low volume remains a concern, and price action may stay rotational within a descending channel until a confirmed breakout occurs.

This week is most likely your last chance to get out.This scam has so many MOONTARDS invested they are trying to give you as many chances to get out as possible. But the music will stop by next month.

ETH Key Support| Price Action| Trend| Bounce Continuation Ethereum saw a strong 7% bounce from daily support at $1,550, but the overall market structure remains bearish. Price now eyes the $2,000 resistance, which must be broken to confirm a structural shift.
Key Points:
- Bounce from $1,550 looks strong but lacks significant volume support.
- $2,000 is a key level — failure to break may lead back to $800 range lows.
Right now, this move should be treated as a reactive bounce, not a confirmed reversal. If ETH fails at $2,000, the downtrend likely resumes. But if it reclaims that level with strong momentum, we could see the first higher high in months.
Ethereum has bounced 7% from key daily support at $1,550, but bearish market structure still dominates. A break above $2,000 is needed to confirm a bullish shift. Until then, downside risks toward $800 remain.

Are we headed for ATH? My next tradesTuesday Trading Update 🎯
In today’s video, we dive into the higher time frame analysis of Bitcoin. We’re breaking down key live levels and the ongoing price action narrative.
We’ve seen a solid 3-tap Trinity Model play out on the lows, tapping into a 2H demand zone—a move that’s giving us the conviction for a bullish structure break.
Right now, I’m watching for a potential retracement to confirm support before a bullish continuation targeting the $95K zone.
🚀 Follow for more insights and stay ahead of the move!

What will bitcoin do next! Free money ticket!Tuesday Trading Update 🎯
In today’s video, we dive into the higher time frame analysis of Bitcoin. We’re breaking down key live levels and the ongoing price action narrative.
We’ve seen a solid 3-tap Trinity Model play out on the lows, tapping into a 2H demand zone—a move that’s giving us the conviction for a bullish structure break.
Right now, I’m watching for a potential retracement to confirm support before a bullish continuation targeting the $95K zone.
🚀 Follow for more insights and stay ahead of the move!

BTC Market Structure| Price Action| Trend Bitcoin has finally broken out of its bearish market structure, marking the first significant shift since the all-time high. However, price is now approaching major resistance at $94,259, which could act as a turning point.
Key Points:
- Structure has shifted bullish, but $94,259 remains a key resistance with confluence.
- A retracement to $81,850 could form a higher low if this level fails to break.
If Bitcoin can’t break above $94,259 convincingly, a rotation back toward $81,850 is likely — a region where a higher low could form. As long as that level holds, the bullish structure remains valid. Traders should watch for volume to confirm any breakout continuation.

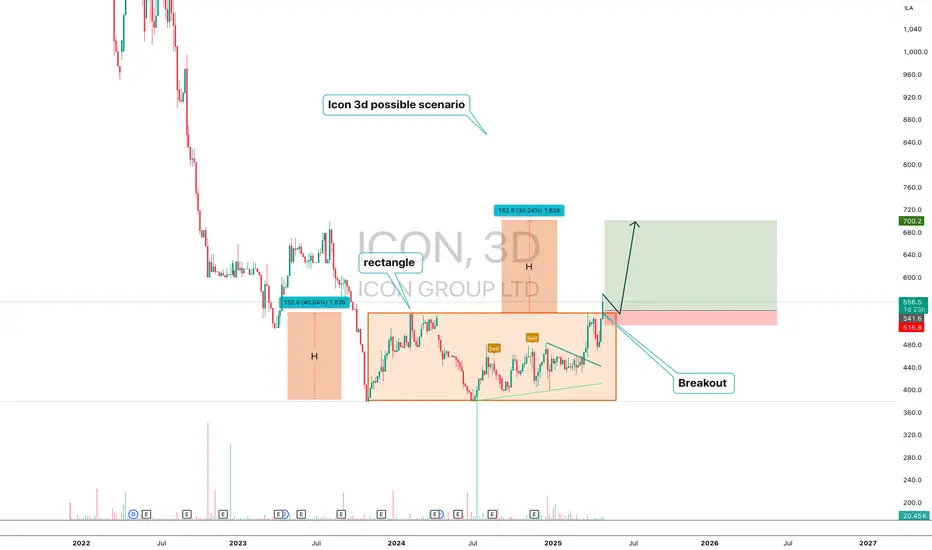
ICON — Breakout from Rectangle with H Projection Targeting $700ICON (3D) — Technical Structure Analysis
ICON has broken out from a prolonged horizontal rectangle pattern ($380–$540). The move activated a measured move structure with two H-sized waves. The first H was completed. The second H projects a move to the $700 area.
Key points:
-Confirmed breakout from range
-First H = 153 pts, completed
-Second H = 162 pts, targeting $700
-Price holding above breakout zone ($515–$541)
ICON has moved out of accumulation and entered trend expansion. As long as the support holds, the scenario remains valid. The technical model targets the $700 area.
WOLFSPEED Price has fallen to and stabilised at the bottom of a huge falling wedge and is at historic lows.
first upside is a test of the upper resistance line of the falling wedge.

Solana LongSolana long scenario, coiling this week into next, possible pump next week.
Invalidation (SL) below 132. TP1 160 TP2 232 TP3 310

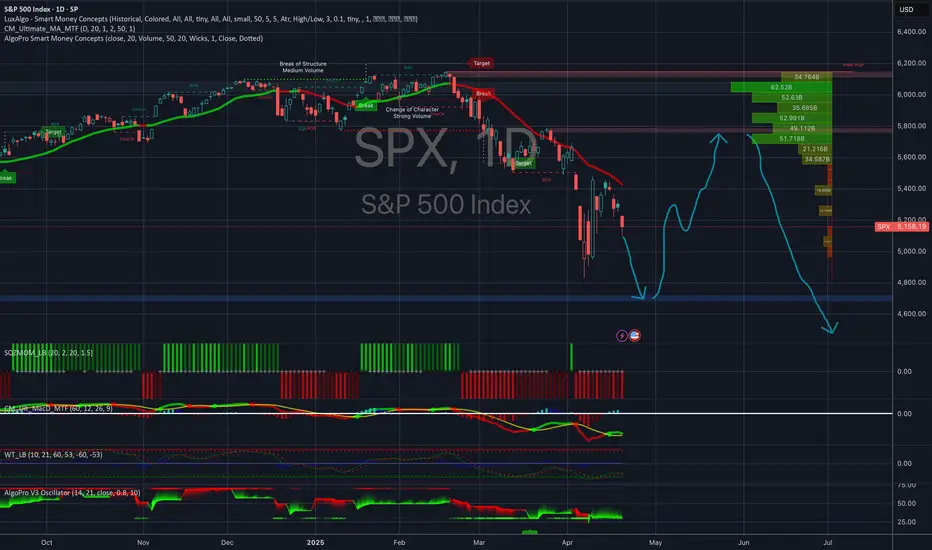
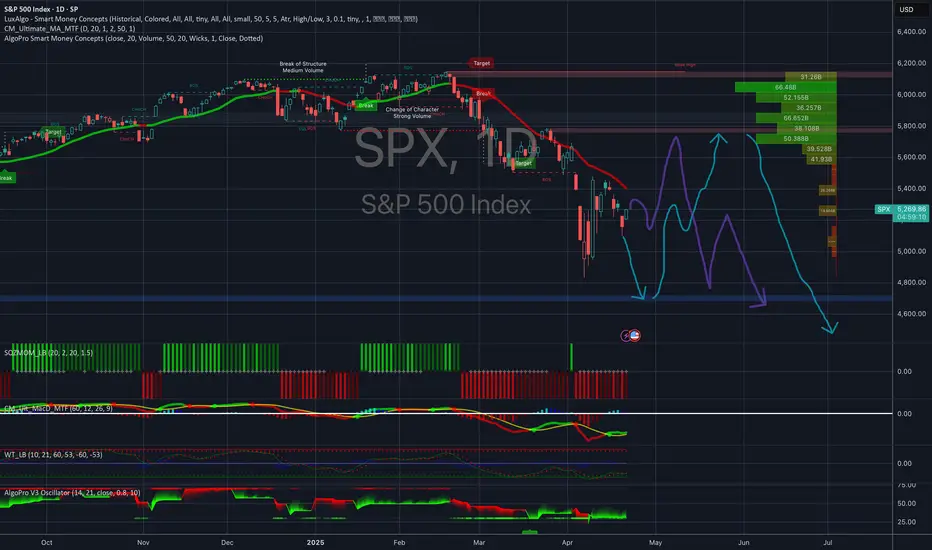
[D] SPX - 22.4.2025 (Scenario 1 & 2)To complement the earlier publish idea, I'm hereby adding another scenario as I'd feel dissatisfied with several candles being displaced. Both tell the same story as I'm fundamentally remain bearish over a prolonged period of time. I expect the things to get moving as soon as mid May for a major move. This year's summer time might hit different.
Bitcoin 15-Minute Chart – Projected Target PriceCurrently, the trend appears to be upward.
If the bullish trend continues, the price is expected to rise toward approximately 90,452.
On the other hand, if it declines, a drop toward around 83,808 is expected.
However, considering the current time of day, the market seems to be losing some momentum, so it's more reasonable to expect a short-term uptrend or sideways movement for now.

Gold hits all-time highTechnical Analysis
Gold prices hit an all-time high near $3,500 earlier Tuesday, consolidating a strong uptrend. This latest surge, which has surpassed 10% in just over a month, follows rapid gains from $3,126 to $3,498. Currently, the bulls are maintaining their dominance.
Looking at historical price action, every significant rise in gold has been followed by a period of profit-taking. Therefore, a short-term correction is expected. Furthermore, a break above $3,417 could trigger a deeper correction, which warrants caution.
Trading Recommendations
Trading Trend: Sell
Entry Price: 3,438
Target Price: 3,235
Stop Loss: 3,534

SP500 Weekly Action Areas & Price Targets 22/04/25In this update we review the recent price action in the emini SP500 futures contract and identify action areas & price targets for the trading week ahead. To review today's video analysis click here!

[D] SPX - 22.4.2024I felt like I wanted to post something positive amid the madness, although I remain bearish on SPX and USD since the beginning of 2024 - as my past predictions suggest. So far, the greatest businessman and dealmaker, Donald Trump has successfully outperformed on the time line most of the expectations that I deemed possible in a real-world setting. If that continues to hold true, it is possible that hereby - somewhat optimistic - prediction will again lag behind the reality on the scale of days to a couple of weeks. What I was hoping for, was a much welcomed break during the summer and a full-blown downfall into a recession afterwards. I'm much afraid, things I expected in 2026 might arrive considerably sooner.