XAUUSD Potential rise There is an upward impulse wave and a correction pattern. Another upward impulse wave is expected.
Correction

SPX500: The trendline show a bottom in Sept 2025 at 4700 We're being magnetically pulled toward the trendline bottom around 4700.
Based on the current MACD and RSI signals, the bearish scenario could continue until September–October 2025. This correction is very similar to the one from 2022.
There will be some dead cats bounces, but do not be fooled, the MACD is reseting hard.
Stay sharp. Be ready.
DYOR.

Bearish Reversal Incoming? Key Resistance Holds as Price StallsAfter analyzing multiple timeframes, we observe that the price has surged significantly and is now trading within a key resistance zone. The resistance remains strong, and the RSI across multiple timeframes is in the extreme overbought territory, showing bearish divergences. Additionally, despite the sharp rally, the price has not undergone any meaningful correction.
Considering these factors—strong resistance, the proximity to a weekly trendline, extreme overbought conditions, and bearish divergence—along with the presence of a hanging man candlestick at resistance, a correction is likely. Our correction targets are the 50% and 61.8% Fibonacci retracement levels.

HelenP. I Gold will correct to trend line and continue to riseHi folks today I'm prepared for you Gold analytics. Earlier, the price was moving inside a consolidation range between 2955 and 2880 points. It tested the support zone multiple times, specifically the area between 2865 and 2880, before making a strong bullish reversal. After bouncing from Support 2 at the 2880 level, Gold began a confident upward movement. It broke through the resistance zone and exited the consolidation pattern, forming a clear uptrend and respecting the trend line throughout the rise. As the price climbed, it reached Support 1 at the 3055 level and paused briefly, consolidating near the support zone between 3055 and 3070. This zone held well, acting as a base for further growth. From there, the price made another upward impulse, reaching the 3125 area before pulling back slightly for a local correction. Currently, Gold is trading above the trend line and remains within a bullish structure. The recent reaction from the support zone confirms buyer strength and interest in higher levels. Given the previous impulse, the trend line support, and price action above key zones, I expect XAUUSD to continue rising toward the 3180 points, my current goal. If you like my analytics you may support me with your like/comment ❤️

Potential rise in the price of the euro/dollarHello traders
The upward momentum is strong and there is a correction. I expect the price to continue its trend and break the top.


GOLD - Price will make correction movement to support levelHi guys, this is my overview for XAUUSD, feel free to check it and write your feedback in comments👊
Some time ago price started to grow inside a rising channel, where it soon reached $2940 support level and broke it.
Then it some time traded near this level and then continued to grow in channel and soon reached resistance line of channel.
Soon, Gold reached the $3055 level and then corrected to the channel's support line, after which it turned around.
XAU reached $3055 level again and broke it, aftr which continued to grow and recently, it reached almost resistance line.
But soon, it turned around and started to decline, so, in my mind, Gold can continue to decline to $3055 level.
If this post is useful to you, you can support me with like/boost and advice in comments❤️

Will Monday Bring a Breakout or a Correction?Last week was characterized by extreme volatility, with price movements reflecting significant reactions across different trading sessions. On Friday, the Asian session managed to push past the $3057 mark, only for early European trading to see a pullback. However, the US session reversed course, fueling a rally that extended until market close.
Key Levels to Watch on Monday
Looking ahead, the critical question is whether the Asian session can break above $3086, potentially paving the way for a push beyond $3100. If this breakout fails, we could see a price correction similar to Friday's, especially during European trading.
At present, I'm taking a cautious approach, observing the market while many anticipate further upside. While momentum appears strong, I prefer to wait for clearer confirmations before making a move.
Potential Scenarios
Breakout Above $3086
A successful push above this level could signal continuation toward $3100+, reinforcing the bullish sentiment.
Failure at $3086 – Potential Pullback
If the market struggles to sustain levels above $3086, a decline to $3076 is likely.
A break below $3076 could see further downside to $3067 and possibly lower.
Technical Indicators & Market Sentiment
RSI (1H): Currently at 52, indicating neutral momentum.
RSI (4H): Around 90, showing overbought conditions—especially following the Asian session rally.
Market Sentiment:
Many traders expect an upward continuation, but caution is warranted given overbought signals and the possibility of a correction.
External Factors: Tariffs & Global Trends
As we approach April 2nd, when new tariffs take effect, global markets have been showing signs of weakness. Uncertainty persists, and with gold acting as a safe haven, investors may seek protection, adding another layer of complexity to Monday’s price action.
Conclusion
The start of the week will likely be dictated by whether the Asian session can achieve a breakout above $3086. If it does, bullish momentum could drive prices higher. However, failure at this level could result in a correction, with key support levels at $3076 and $3067 in focus. Given the broader market conditions and upcoming economic events, a cautious approach remains prudent.
📉 Will Monday bring a correction, or is there still room for another rally? Share your thoughts in the comments! 🚀
-------------------------------------------------------------------------
This is just my personal market idea and not financial advice! 📢 Trading gold and other financial instruments carries risks – only invest what you can afford to lose. Always do your own analysis, use solid risk management, and trade responsibly.
Good luck and safe trading! 🚀📊


World Index Shows 5Th Wave Is Still MissingWorld Index ETF with ticker TSX:XWD has extended its rally for 261,8% Fibonacci retracement, which is ideal zone for wave 3, so current slow down can be just a higher degree ABC correction in wave 4. It’s now testing interesting and important textbook support at the former wave 4 swing low and 38,2% Fibonacci support area, from where we may see a bullish resumption for wave 5 this year. Invalidation level is at 90.

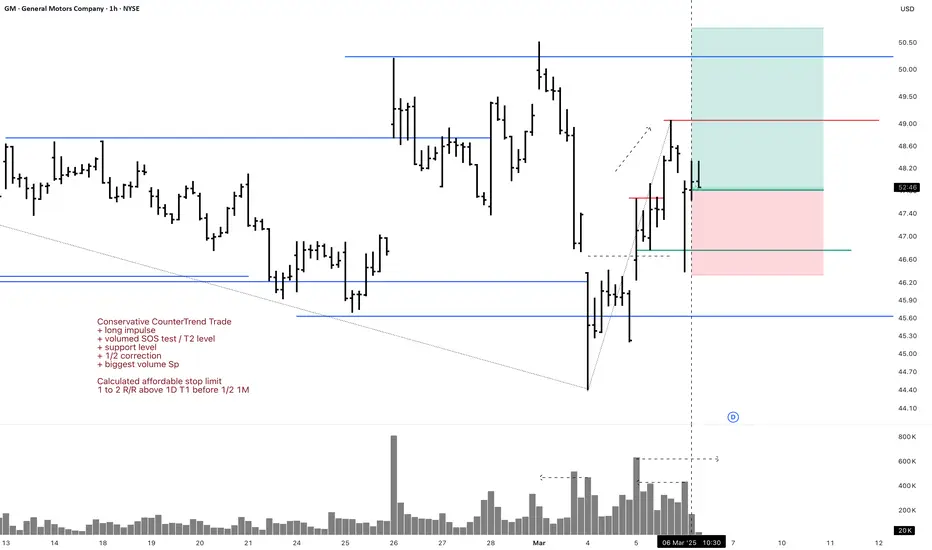
GM 1H Long Swing Conservative CounterTrend TradeConservative CounterTrend Trade
+ long impulse
+ volumed SOS test / T2 level
+ support level
+ 1/2 correction
+ biggest volume Sp
Calculated affordable stop limit
1 to 2 R/R above 1D T1 before 1/2 1M
Daily CounterTrend
"- short balance
- unvolumed expanding T1
+ volumed 2Sp+
+ test"
Monthly Trend
"+ long impulse
- below 1/2 correction
+ SOS test level?"
Yearly Trend
"+ long balance
- neutral zone"
Will add more if 5M corrects to 1/2 or 1H doest weak test and resumes buying
XRP Wave 2 or Wave B incoming Part 1Hello there,
I am presenting a bearish (short term; current post) count and a bullish count (in my next post). This is showing that we hit a truncated top (see previous posts; attached) and we are coming down in the $1.9 - $1.4 ish range to compete Wave 2 (or could be Wave B) of cycle. I see us pushing to the $2.9 - $3.2 ish range to finish the C wave of the Major wave B of the wave 2 before finishing. it seems to me that we are making a Flat in this sideways chop.
please review and ask me any questions
GOD BLESS AND TRADE ON
Stay Humble and Hungry

Another look at the wedge/pennant I just postedI decided to do a second chart idea on the pennant I posted in the last chart, this tme including the super pivotal support trendline and moving the emasured move line to the point that support line crosses over the top trendline of the wedge. Will be interesting to see if either of these measured move line projections from this dea and the last one play out. *not financial advice*

Falling Wedge/Pennant on BitcoinThe full wedge extends all the way into August. I certainly hope we break up from it well before then. I place the measured move line around where I think we old break upward from if we can flip the 200ma back to solidified support. It of course could actually take much longer to break up from the wedge but even if it did the lowest price of the wedge is really not that terrifying in my opinion and would instead just be a phenomenal buying opportunity if we were allowed to accumulate mote that cheap. Because of other major supports not shown here however going below 70k for anything but an extremely brief wick seems an incredibly low probability. *not financial advice*


BTCUSD, Are we going to face 35% Correction ?!If we take a look at previous 2 notable cycles we easily notice similarities.
From these 2, 2022-2024 looks more similar to 2016-2017, as long as we had -
Breakout of downtrend line. ✅
Reaccumulation zone. ✅
Testing major bear market impulse (Which in all cases became strong resistance). ✅
What we didn't experience is correction after these 3 moves.
In 2016 it was around 40% (Tested reaccumulation zone)
In 2019 it was around 53% (Tested major support / resistance zone).
As long as current market structure somewhat repeats 2016 move, have possibility to retest top of after trend line breakout reaccumulation zone, which sits around 33-32k.
Percentage wise it's around 35% from ETF top and 23% from current price.
What you think ?

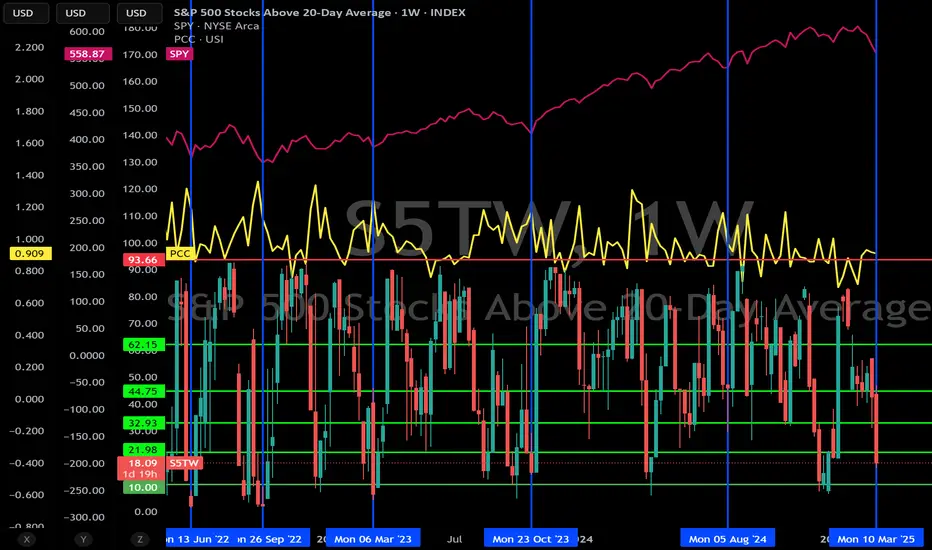
SPY, PCC & Percentage of S&P 500 Stocks Trading Above 20 SMASPY is in pink, PCC is in yellow and candles show S5TW (Percentage of S&P 500 stocks trading above their 20 SMA) on this weekly chart. You will notice after a significant drop of over 5% on S&P 500, once S5TW start getting below 20%, a reversal isn't that far away. Relief rally rips can be dramatic, so it really isn't the time to get bearish. Need to put that bull hat on! For now I am leaning after this retrace pump to 590 area, conclusion of B wave, but we still will put in a C wave which will likely head lower than where we finished A, but after that it will be one more impulsive wave to finish this bull run which should take us to SPY 650 by mid next year. Won't want to miss that one!!!
$SOL Dumps 60% - Is it Over !?CRYPTOCAP:SOL DUMPED OVER 60% ‼️
That’s after a 3,500% pump
from the bear market low in ’22.
Is it over!?
TL;DR - NO.
This is common after such an insane pump.
SOL Dec ’20 - May ’21
5,700% pump
71% correction
then another 1,290% pump
Let’s look at previous cycles with $ETH.
Dec ’16 - June ’17
6,380% pump
67% correction
then another 916% pump
Dec ’18 (bear market low) - May ’21
4,860% pump
62% correction
then another 185% pump
So you see my fine feathered friends,
there’s nothing new here.
Targets still remain $700-850 🤠

VIX againUVXY is landing in a short term trendline. SPY is heading to a resistance zone. I bought the ETF (no calls this time) I'll keep buying if it gets to the support at 18.30. I think the market is consolidating and we will have ups and downs like crazy. I'll take advantage of it. My first TP at 22, then will see.

$MAGS Monthly Chart Signals Caution: What’s Next for the MagnifiMacro Outlook Based on the Monthly Chart ⚠️⚠️⚠️⚠️
The Roundhill Magnificent Seven ETF CBOE:MAGS has had an incredible run, but the monthly chart is sending some cautionary signals. December closed with a massive sell-off wick, followed by a weak January close. This kind of price action suggests potential exhaustion in the near term.
The last time we saw a similar setup was in July, when a sharp sell-off wick led to a 23% drop before the market resumed its upward trend. Does this mean CBOE:MAGS has to plummet again? Not necessarily, but with market uncertainty around the tariff war and the monthly chart showing signs of stagnation, a steeper retrace could be on the horizon before any further upside. It’s possible we’re seeing a temporary top for now.
Short-Term Outlook:
As long as price holds above the yearly open, I expect a retest of the $57 resistance level. However, for the macro trend to turn bullish again, we’d need to see strong momentum and a solid close above $57 by flipping this level from resistance to support. Until then, the current price action feels more like a dead cat bounce than a sustainable recovery. Expecting volatility in the near term.

18 Times, +2000%, 5800 Days - All About NASDAQ100 Corrections!Hi, all!
I need to repost some of my recent ideas on TradingView due to issues with the platform's moderation. Let's start! The most up-to-date post is coming right away - one that serves as a timely reminder during these interesting times: never forget history.
From November 2008 to February 2025, the Nasdaq 100 (NDX) index has grown by over 2000%! Yes, that’s a 20x increase! This tech giant, made up of the 100 leading technology stocks, has shown impressive strength.
For comparison, the S&P 500 has risen about 820% in the same period. A great performance but Nasdaq 100 leaves it far behind.
Has this been a straight-line rise? Not really. Looking back, it may seem like the perfect investment. But the road was not smooth. Nasdaq 100’s success came with painful drops, investor panic, and moments when it felt like the market would never recover.
From the outside, everything looks great. But would you sit through a 30% drop, while the news is screaming about the "end of the world"?
So, I decided to analyze every correction of 10% or more since the market bottom in 2008.
- How long do corrections and recoveries last?
- How often do they happen?
- What should investors know?
- Can this help you in any way?
DATA ANALYSIS - 18 corrections in Nasdaq 100 (2008–2025), -10% or more.
Retracement Stats:
- Average drop: -15%
- Median drop: -13%
- Biggest drop: -37.72%
- Smallest drop: -10%
Correction Length (17 completed corrections): How many days does a correction last from the peak to the bottom?
- Average: 60 days
- Median: 35 days
- Longest: 325 days
- Shortest: 14 days
Recovery Time: From bottom back to new highs.
- Average: 165 days (~5.5 months)
- Median: 119 days (~4 months)
- Longest: 752 days (over 2 years)
- Shortest: 42 days (~1.5 months)
Correction Frequency
If we take a rough estimate, in 5800 days, there were 18 corrections, which means a correction happens every 322 days (~10.5 months) on average.
Total Time Spent in Corrections vs. Rising Markets
- Corrections lasted 1016 days
- Recoveries lasted 2801 days
- Total time spent in "work mode": 3817 days
- Total "smooth uptrend" days: 1983 days (~5.4 years)
Basically, like a hardworking employee – the market spends more time struggling than rising!
What Can Investors Learn from This?
1. Accept Volatility
Knowing that market swings are normal, investors can keep a long-term perspective and avoid panic-selling during downturns.
2. Nasdaq 100 Has Always Recovered
In the long run, Nasdaq 100 has always bounced back to new highs. Each recovery has been different, but so far, making new all-time highs has never been a problem.
3. Make Better Decisions
Understanding psychological biases helps investors make rational choices and manage risks better.
4. Market Drops = Opportunities, Not Threats
Most big market rallies started when most investors were too scared to buy.
"A simple rule dictates my buying: Be fearful when others are greedy, and be greedy when others are fearful." – Warren Buffett
Market drops always feel unique and scary but history shows they follow repeating patterns. And those who keep their emotions in check have the best opportunities.
"The time to buy is when there's blood in the streets." – Baron Rothschild
Final Thoughts: Is the current retracement a buying opportunity? No one knows for sure but history suggests - stay calm!
So, that's all. Like & Boost if you find this useful! 🚀
Have great day,
Vaido
💬 Before you leave... What’s your take on the current Nasdaq 100 correction? Drop your thoughts in the comments 👇
Putting the current pullback from ATHs into context ES FuturesCME_MINI:ES1!
Big Picture:
ATH on December 6th, 2024: 6,184.50
There has been no significant correction or pullback since the ATH.
Currently, the market has pulled back ~8.20% from the ATH.
The previous correction (over a 10% pullback, but less than a 20% downturn) occurred after ES futures hit an all-time high of 5,856 on July 15th, 2024. The market bottomed out on August 5th, 2024.
Currently, ES futures are trading below the 50% retracement level from the ATH on December 6th, 2024, and the swing low on August 5th, 2024, at 5,719.25.
Given the current "risk-off" sentiment, let's review the updated price map for ES Futures.
Key Levels:
Important level to reclaim if no correction: 5,795.25 - 5,800
Key LVN (Low Volume Node): 5,738 - 5,696
Mid 2024 range: 5,574.50
Key Support: 5,567.25 - 5,528.75
2024 YTD mCVAL (Market Composite Value Area Low): 5,449.25
2022 CVAH (Composite Value Area High): 5,280
Key Support: 5,567.25 - 5,528.75
This zone is important in the event of a 10% pullback, which could lead to a bounce thereafter.
On our regular 4-hour time frame, which we use for weekly analysis and preparation, higher lows have been breached, and ES futures are now trading below the lows from November 4th, 2024, January 13th, 2025, and February 28th, 2025.
The probable next downside target is the 50% retracement of the 2024 range, which stands at 5,574.50.
Unless we see a sustained bounce that reclaims the 5,795.25 - 5,800 zone, the key support level at 5,567.25 - 5,528.75 is likely to be tested, aligning with our expected 10% pullback.
Note that a bear market (i.e., a pullback greater than 20%) wouldn't begin until prices drop to around 4,900, which is still about 750 points away from the current price level of 5,650.
Considering all the above, what can we expect this week?
CPI and PPI data are due this week, and the market is currently in "risk-off" mode. This sentiment is exacerbated by Federal Reserve Chairman Powell's comments on needing more data before altering rate path, combined with tariffs complicating the US economy.
What price level might prompt policymakers to adjust their stance?
The Fed’s dual mandate considers both 2% inflation and low unemployment. With the unemployment rate edging above 4% and inflation remaining high, this upcoming inflation reading is critical. We believe this report may trigger volatility not seen in recent months with CPI releases. We have the SEP and FOMC rate decision coming up on March 19th, 2024.
Scenario 1: Soft CPI than expectations
Expecting volatile price action, however, a V-shaped recovery given softer CPI reading. Markets go in wait and see
Scenario 2: Range bound week
In this scenario, we expect a range bound week, with inflation print in line and markets in wait and see mode for FED FOMC announcement.
Scenario 3: High CPI print
With a higher CPI print, FED will be in a difficult position to cut rates. Will this bad news be bad for the market or good? Mounting risks point to further downside if we do not get any pivot on macro level to support the economy.
