Atom downtrend movementatom is in a downtrend channel and as you can see it bounce from the demand zone and also fibo 0.50, but I think its downward movement will continue and the next target for the short position is placed around 9.96 and 8.96
if we see good support around them can long here, but I think we will touch 5.55 again, for taking a long position it's better to wait and watch the reaction to our channel's lower band. if break 8.96 and close at least 1 daily candle below it. I am sure we will touch 5.55 again.
I am already in a short position and my target is on the chart...
I consider all analyses performed in relation to that trade position.
Our analysis is not a buy or sell referral.
If you found our analysis useful and interesting, feel free to share it so that more individuals might benefit from it.
And please don't forget to like and comment; we will read them all.
Cosmos

ATMUSD - Long Cosmos shows strong upward trend against USD. Buyers should wait for a bullish signal near previous higher low to buy at a discounted price.

COSMOS/ATOM looking ready for 16$Nice pullback and bounce off 382 Fib. 16$ perfectly aligns with 16.50! Lets go

Cosmos (ATOM) - November 3Hello?
Welcome, traders.
By "following", you can always get new information quickly.
Please also click "Boost".
Have a good day.
-------------------------------------
(ATOMUSDT 1W Chart)
Whether the 12.262-15.837 section is supported and able to rise is the key.
(1D chart)
If the price holds above 12.887 and above the M-Signal line of the 1W chart, it is expected that this will lead to an attempt to move higher above 15.083-15.837.
If not, you should check to see if it is supported near 12.282.
If it falls below 11.377, it is expected to drop to around 9.603, so Stop Loss is necessary to secure cash.
------------------------------------------------------------ -------------------------------------------
** All descriptions are for reference only and do not guarantee a profit or loss in investment.
** If you share this chart, you can use the indicators normally.
** The MRHAB-T indicator contains indicators that indicate support and resistance points.
** HA SRRC indicators are expressed as StochRSI(line), RSI(columns), CCI(bgcolor).
** CCI indicator is expressed as overbought range (CCI > +100) and oversold range (CCI < -100).
(Short-term Stop Loss can be said to be a point where profit and loss can be preserved or additional entry can be made through split trading. It is a short-term investment perspective.)
---------------------------------

Trading opportunity for ATOMUSDT CosmosBased on technical factors there is a Long position in :
📊 ATOMUSDT Cosmos
🔵 Long Now 13.710
🧯 Stop loss 12.440
🏹 Target 1 14.900
🏹 Target 2 17.000
🏹 Target 3 19.900
💸RISK : 1%
We hope it is profitable for you ❤️
Please support our activity with your likes👍 and comments📝

Trading opportunity for ATOMUSDT CosmosBased on technical factors there is a Long position in :
📊 ATOMUSDT Cosmos
🔵 Long Now 13.10
🧯 Stop loss 11.450
🏹 Target 1 16.950
🏹 Target 2 19.990
🏹 Target 3 25.000
💸RISK : 1%
We hope it is profitable for you ❤️
Please support our activity with your likes👍 and comments📝

Cosmos (ATOM) - October 27Hello?
Welcome, traders.
By "following", you can always get new information quickly.
Please also click "Boost".
Have a good day.
-------------------------------------
(ATOMUSDT 1W Chart)
Whether the 12.282-15.837 section is supported and able to rise is the key.
(1D chart)
The key is to find support at or above the 11.377-12.282 zone and move higher than 15.083.
Otherwise, it is expected to fall below 9.603.
If it is supported and rises in the 15.083-18.837 section, it is expected to rise to around 22.948.
------------------------------------------------------------ -------------------------------------------
** All descriptions are for reference only and do not guarantee a profit or loss in investment.
** If you share this chart, you can use the indicators normally.
** The MRHAB-T indicator contains indicators that indicate support and resistance points.
** SR_R_C indicators are displayed as StochRSI(line), RSI(columns), CCI(bgcolor).
** CCI indicator is expressed as overbought range (CCI > +100) and oversold range (CCI < -100).
(Short-term Stop Loss can be said to be a point where profit and loss can be preserved or additional entry can be made through split trading. It is a short-term investment perspective.)
---------------------------------

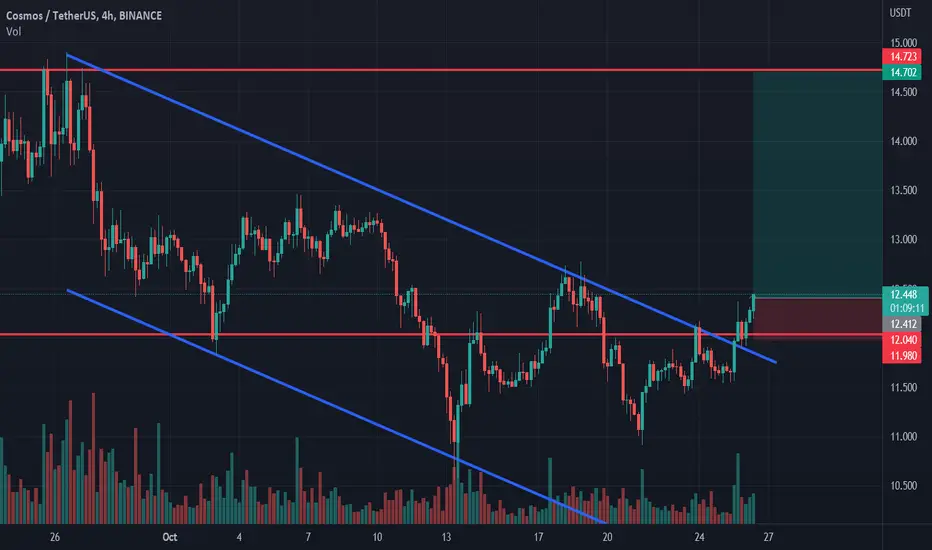
Cosmos longCosmos broke trough off the upper boundary of descending channel. Asset broke trough off the resistance level. Bullish movement to resistance level at 14.7 is expected to happen.
ATOM Trend Broken!!KEY Levels mapped!
Love it or hate it, hit that thumbs up and share your thoughts below!
Every day the charts provide new information. You have to adjust or get REKT.
Don't trade with what you're not willing to lose. Safe Trading, Calculate Your Risk/Reward & Collect!
This is not financial advice. This is for educational purposes only.

Cosmos Surprising- Atom have been more bullish than others altcoins on his come back.
- Seems like we got a Bottom around 5.4$.
- Like always in cryptos, everything can happen as most of altcoins will follow TheKing, so invest wisely.
-----------------------------------------------------
Trade Setup
-----------------------------------------------------
Buy Zones : 11.5$ - 10.5$
- TP1 : 19.5$
- TP2 : 29$
-----------------------------------------------------
2 strategies for this trade :
-----------------------------------------------------
1/ - Set a Stop Loss around : 9.5$
- i never do that because cryptos are too volatiles and can make fast dip wicks, i prefer DCA rebuy.
2/ - invest only 25% at actual price and keep some juice.
- invest 75% if Atom back to Bottom around 5.5$
-----------------------------------------------------
Stay Safe ! Happy Tr4Ding!

Cosmos longCosmos broke trough the resistance level. Asset broke trough the descending trendline. Bullish movement to resistance level at 15.2 is possible

Cosmos Hub (ATOM) - October 17Hello?
Welcome, traders.
By "following", you can always get new information quickly.
Please also click "Boost".
Have a good day.
-------------------------------------
(ATOMUSDT 1W Chart)
The key is whether it can rise above 12.282 and find support.
If not, expect to touch around 9.603.
(1D chart)
The key is whether it can find support near 11.377 and move above 12.282.
Otherwise, it is expected to decline to the 8.060-9.603 section.
If it rises above 15.837, it is expected that the uptrend will continue.
------------------------------------------------------------ -----------------------------------------------------
** All descriptions are for reference only and do not guarantee a profit or loss in investment.
** If you share this chart, you can use the indicators normally.
** The MRHAB-T indicator contains indicators that indicate support and resistance points.
** SR_R_C indicators are displayed as StochRSI(line), RSI(columns), CCI(bgcolor).
** CCI indicator is expressed as overbought range (CCI > +100) and oversold range (CCI < -100).
(Short-term Stop Loss can be said to be a point where profit and loss can be preserved or additional entry can be made through split trading. It is a short-term investment perspective.)
---------------------------------

Atom(cosmos) update Remember about 2 weeks at 16$
I said we will go lower to 10$ We already touch it and pull pack
Now we can see a strong move up side but it will not last 3-4 days maybe less
Best way to trade it sell gradually or go long for 2 days maximum and start selling
Furthermore , the Moving averages is crossed and going down is high probable.
The continuation to our target around 5$
GOOD LUCK

ATOM Pull-back Reversal - SHORT SETUPHello, I am Tommy.
If this is your first time coming to my idea, thank you very much for taking the time to pay attention to it. My opinions are all subjective and personal. It might be right, or wrong, but there is one thing I can guarantee you will never go wrong - always set the SL for each entry before setting the TP for it.
ATOM Price Chart is building a pull-back reversal, create a price compression with the MA21 line. It's a short setup.
Entry ~ 11.7

ATOM uptrend channel and supply zoneatom is rejected from the daily supply zone and as we can see it's going to retest the Pivot point around 13-13.4$ , we may see a bounce from here, but I think it will be weak,
anyway, just watch levels and make your decisions,
for those who have atom in their budgets, it's better to sell, because we may see a good drop...
I will short if break the daily upward channel
remember as always green is support, Red is resistance

ATOMBTC is in end of upward movement , be careful as you can see atom is Rejected from the supply zone, and in daily and weekly its in the distribuends phase, if you have any long positions I recommend you close them, just watch the levels and enjoy that.

ATOM Very simple ... Very clear
We are probably at the end of the corrective correction and the next downward step is starting. (ATOM - ATOMUSDT - COSMOS)
This is my personal opinion. Please do not trade based on my analysis and data.

Cosmos: ComebackCosmos has come back below the green strip between $12.75 and $12.17 and should be very careful now, as there isn’t much room left until the support at $11.54. There already is a 40% chance that the altcoin could drop below this mark, which would then trigger further descent. However, as long as Cosmos abides above $11.54, we still primarily expect it to get its act together and to develop strong upwards momentum. Thus, Cosmos should be able to rise above the resistance at $16.96, heading for the green zone between $22.38 and $25.88.

$ATOM - LONG or SHORT ?Hello my Fellow TraderZ,
The day before I had shared the idea of $QNT forming an ASCENDING TRIANGLE and its possible move.
Similar structure is visible on $ATOM #COSMOS on 1 HTF where price is ranging inside the ASCENDING TRIANGLE and constantly getting rejection from $13.2. Breakout Target would be around 6-11% Profit.
But also it is a bit confusing as it seems like it is also forming a Head & Shoulder pattern with the Trendline as the Neckline. Breaking of the neckline would give us the profit ~ 7-10% on Short.
As a trader our task is to trade on both the sides.
Let's see. Good Luck.
Happy Trading. CHEERS!!!

AtomATOM is at the bottom of the Weekly Control Candle. Created the range and did a sweep below the range. Stuck back in the range again. Overall quite good with this market turmoil. Now we just need to get out of that range.

Cosmos Hub (ATOM) - October 7Hello?
Welcome, traders.
By "following", you can always get new information quickly.
Please also click "Boost".
Have a good day.
-------------------------------------
(ATOMUSDT 1W Chart)
Whether the 12.282-15.837 section is supported and able to rise is the key.
(1D chart)
You need to see if you can move up along the uptrend line.
If not, you should check to see if it is supported near 12.282.
If it falls below 12.282, it is likely to move towards the 9.603 area.
The next volatility period is around October 30th.
------------------------------------------------------------ -----------------------------------------------------
** All descriptions are for reference only and do not guarantee a profit or loss in investment.
** If you share this chart, you can use the indicators normally.
** The MRHAB-T indicator contains indicators that indicate support and resistance points.
** SR_R_C indicators are displayed as StochRSI(line), RSI(columns), CCI(bgcolor).
** CCI indicator is expressed as overbought range (CCI > +100) and oversold range (CCI < -100).
(Short-term Stop Loss can be said to be a point where profit and loss can be preserved or additional entry can be made through split trading. It is a short-term investment perspective.)
---------------------------------

Cosmos longCosmos bounced off the support level. Asset broke trough off the descending trendline. Bullish movement to resistance level at 14.7 is possible.

$ATOM - Smash the NecklineHello my Fellow TraderZ,
In recent time, is there any coin which has outperformed most other top 50 coins is $ATOM #Cosmos.
Looks like it is once again ready to settle for Upward Movement.
On smaller TF, Inverse Head&Shoulder is almost ready to play out just waiting to break the neckline and retest it to BOOM.
Target is set for ~10% .
CHEERS!!!

ATOM COSMOS INVERSE HEAD AND SHOULDERS!! 10% PUMP INCOMING!!Looking at QNT and Matic which have found their bottom its seems like we are getting a bit of relief rally in other altcoins. I have noticed a few with an inverse head and shoulders Pattern. Matic also had one and it played out. Possible 10% profit if it plays out with ATOM. No financial advise though :) It will be better confirmed if we get above $13.089 and use it as support. If this plays out I will be taking profit around $14.00.
