Atom (cosmos) where to buy !One of the best staking rewards .
Unfortunately now in down trend , and the strongest wave down .
In weekly stochastic its over bought .
Going back to 5$ area is logical and healthy
Cosmos

atom vs btcatom vs btc for good measure...used a fractal from the run up after the bottom to superimpose over the fibbonacci...not sure if it works we will find out together


ATOM is looking absolutely stunning!Let’s take a look at ATOM. All drawing tools drawn on the weekly time frame. But wanted to see how the daily time frame is looking.
Daily chart looks absolutely primed and ready for a big movement. ATOM looks bottomed out on the daily and weekly time frames.
Fully expect for ATOM to start making its movement to .618 fib at $22.80 level. Red box of resistance definitely needs to be retested. If these two movements come through then I’d expect a witch to the .786 at $27.50
Take profits off the table at .618, red resistance box and lastly at the .786 then set a trailing stop loss.
Again ATOM has huge upside potential! Trade safe!
What’s everyone think?

The Proof-of-Stake Era is Here. Can ETH Survive the Winter?After Ethereum's "merge" this week, the crypto market continues to sag as a whole, unimpressed. One pattern we see emerging is that coins that have been proof-of-stake since the very beginning (especially ATOM and ALGO this week) have been performing very well relative to the rest of the market. (Coins to keep an eye on in the near future: XTZ, ADA, TRON, MATIC, etc.) As we head further into the recession we're going to start to see some of these patterns get more aggressive.
The reason why this is happening should be pretty obvious at this point: people's attentions are switching over to proof-of-stake, and the coins that offer competitive staking rewards (aka interest rates) are starting to attract new customers. Flipping NFTs is too confusing to most people but most people can tell when one rate is higher than another. (Especially since most banks are still stuck in 0-interest rate savings mode at the moment.)
The crypto community has largely been down on Ethereum lately as the realization that they've fallen behind the curve starts to settle in. But they're certainly not out of the race yet - the roadmap to make ETH competitive in the proof-of-stake race is pretty clear:
1) Make staking liquid - the fact that it's locked up for an indefinite period of time is pretty ridiculous, possibly illegal. (Probably in their own interest to do so quickly before it turns into a lawsuit, tbh.) As it stands now ETH's staking rewards are too cumbersome and not competitive enough for people to consider.
2) Adopting on-chain governance would make skeptics feel at ease and would quell some of the criticisms coming from the Bitcoin maxis too. The real problem is transparency, not centralization.
3) Fix the issues with scaling to bring gas fees down, finally. They can probably consult people from other chains who have already figured it out. (If they can get over themselves, that is, lol.)
They definitely have the resources to do so - that was never in question. Whether they're actually gonna do it, though, that's another story. I didn't exit completely but as a disclaimer I did sell off a pretty big portion of my ETH holdings this year because of concerns over its long-term prospects. Ethereum may be well on its way to becoming Bitcoin 2.0, given that it's now become a deflationary asset.
If you're an ETH holder you'll probably be OK since they'll probably continue to burn their supply to make sure that the price doesn't go down too much. Silicon Valley is known for their appeasement of the investor class and we're likely to see the same pattern play out again. But keep in mind that each coin burned just makes it harder for new people to come in - what they've done is basically put an expiration date on their own project since they're actively restricting the platform's growth now. (Crypto NIMBYism, as I like to call it.)
Coin supply is a controversial topic in the industry but can be understood in a fairly straight-forward way: The higher the supply, the better it is for newcomers; the lower the supply, the better it is for existing holders. Maxis will repeat whatever marketing slogans they were fed but at the end of the day, it's about who's back you're willing to scratch. Getting returns on your investment requires you to see things as they are and read between the lines of what's being said - are they using that wealth to make genuine improvements on the protocol itself, or are they just hoarding it and promoting the scarcity model behind your backs?
More coin supply to attract new talent/investors? Sure, good idea in theory. Just not here - "Not In My Back Yard". NIMBYism is a thing you see in the real-estate markets, and we start to see its ugly head rear in the crypto space, too.
I do owe a lot to ETH - it stabilized my finances, paid off my student loans, and gave me the time to do the things I wanted to do, rather than had to do. But it's probably time for me to move on - I'm here for the dream, not just the money. 🔥

$ATOM will outpace $ETHlooks like a diamond there...FA is through the roof. cosmos security structure is good.


📉✌Atom-Cosmos Analysis✌📈BINANCE:ATOMUSDT
COINBASE:ATOMUSD
Hello traders, first look at my previous analysis and positions on ETHUSDT ,BTCUSDT ,EURUSD ,XAUUSD.
Just don't forget to risk-free your position.
The optimum stop-loss is on the chart.
Please share ideas and leave a comment,
let me know what's your idea.
CrazyS✌


Cosmos Hub (ATOM) - September 20Hello?
Welcome, traders.
By "following", you can always get new information quickly.
Please also click "Like".
Have a good day.
-------------------------------------
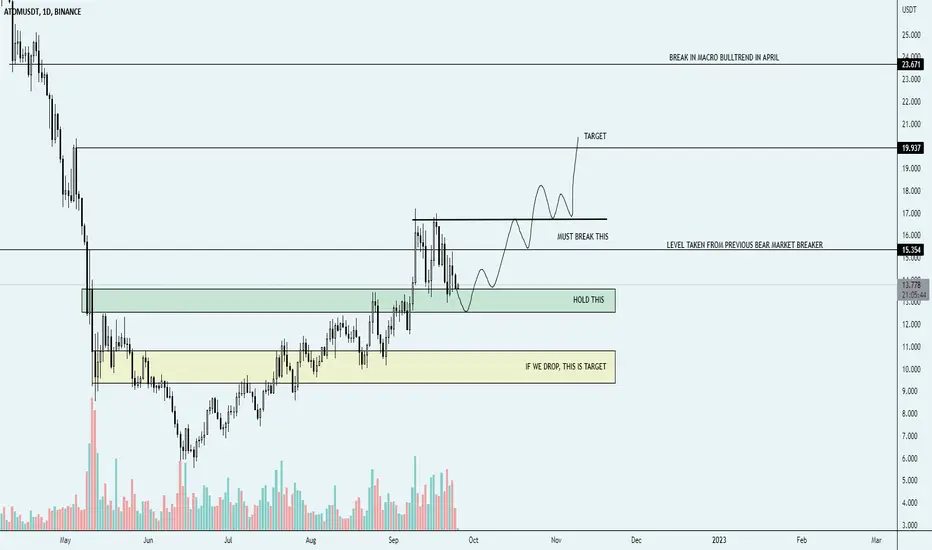
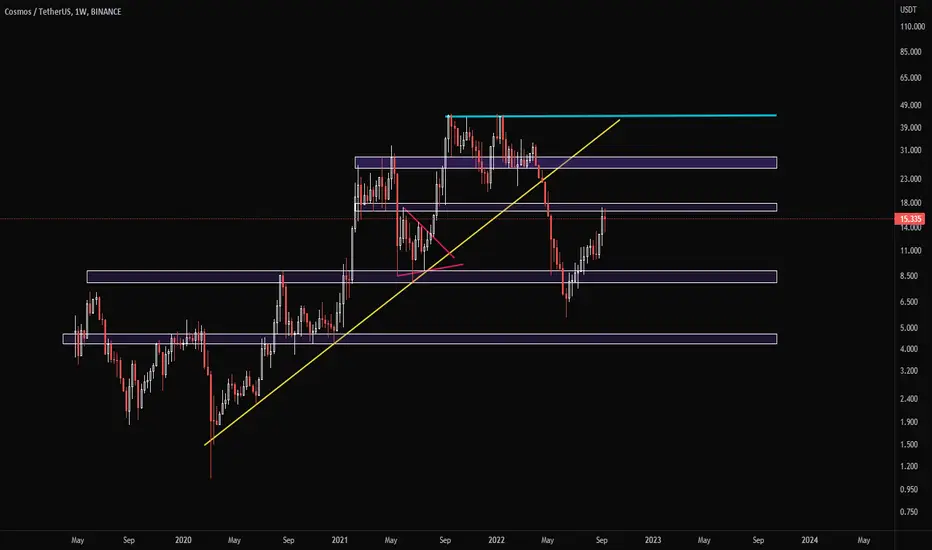
(ATOMUSDT 1W Chart)
The 12.282-15.327 interval is the interval that determines the trend.
Therefore, if the price is maintained above 15.837, it is expected to rise above 20.955.
(1D chart)
We need to see if we can continue the uptrend within the short-term bullish channel.
If the price is maintained above the HA-High indicator, the uptrend is expected to continue.
So, the key is to keep the price above 15.083.
------------------------------------------------------------ -------------------------------------------
** All descriptions are for reference only and do not guarantee a profit or loss in investment.
** The MRHAB-T indicator, which is inactive on the chart, contains indicators that indicate support and resistance points.
** Background color of Long/Short-S indicator: RSI oversold and overbought sections
** Background color of CCI-C indicator: When the short-term CCI line is below -100 and above +100, oversold and overbought sections are displayed.
** The OBV indicator was re-created by applying a formula to the DepthHouse Trading indicator, an indicator disclosed by oh92. (Thanks for this.)
(Short-term Stop Loss can be said to be a point where profit and loss can be preserved or additional entry can be made through split trading. It is a short-term investment perspective.)
---------------------------------


Perfect possible Double Top into the Cosmo?ATOM/USD
Bearish Case
- Double Top can be seen (white line)
- 1hr and 8hr RSI shows a exaggerated bearish divergence
- BTC is retracing, eventually ATOM will follow to in this bear market
Target Zone
- $13.41 (neck line of the bottom of double top)
- $12.81 (0.618 fib retrace)
- $11.60 (0.5 fib retrace & start of double top)
Bullish Case
- May break higher 8hr Histogram showing reversal
Thoughts?

Games of Capital Rotation, example with $ATOM and $AXS$AXS was a coin that hit peak hype and coincidentally has some of the worst tokenomics. $ATOM on the other hand _might_ be forming to be a winner in the next cycle. Simple pair trade, shorting the past hype, longing the future hype and avoiding the crab bites. Similar to SAMA Long below ( + $SOL , $MANA)

ATOM.Usdt (Y22.P3.Video2).Rising wedge and inverted BAR scenarioHi All,
I look at a few scenarios that could work out great to short and long but we need some clues and hence confirmation to be able to do this.
If you have the skills, you will find a good entrance to short and then long.
This by the way could be a great introduction to some technical skills for reading the charts.
Please give me a like and share.
All the best,
S.SAri

The Market Has Spoken - "Liquid Staking" is the FutureFollowing this week's inflation report and the much-anticipated "The Merge" on Ethereum's ecosystem, the crypto markets took a massive dip - in particular, ETH itself. This is the classic "buy the rumor, sell the news" pattern as the hype towards the merge date neared, then the massive-selloff right after.
But not all coins were in the red - COSMOS (ATOM) did very well this week, and showed a very strong decoupling pattern from the rest of the pack. Why? Because they currently offer the best staking rewards (15%+!) out there, beating both the banks and its competitors by a very large margin. If you wanted to sell ETH but stay in crypto, it was the most obvious option to go with, at least on paper.
ETH2 has the problem of being illiquid (there is no set date for when you can withdraw your funds), as well as expensive - which will likely lead to the coin struggling over the long-term as coins that offer low-fee liquid staking (ADA, XTZ, DOT, MATIC, AVAX, etc.) has had a much longer time. ETH2 "final form" isn't likely to happen any time soon (some say as long as 6 years) so they are currently behind the curve of industry standards, not ahead. Whether they can catch up to the rest is yet to be seen.
Now that ETH has de-coupled itself from proof-of-work, we're going to start to see public attention towards different aspects of Web3 and DeFi - and staking rewards is likely to be the talk of the town, especially as we go further into the recession.


Cosmos: Well begun is half done!Cosmos seems to have taken this motto to heart and is appearing at its best. The altcoin has already managed quite some altitude difference on its way upwards to the resistance at $21.54, and it should keep going. Once above this mark, Cosmos should be well-positioned for further ascent. A 40% chance remains, though, that the altcoin could lose its steam and drop below the support at $5.54. In that case, Cosmos should make a detour through the turquoise zone between $5.27 and $0 first before starting to rise anew.
