10D Chart shows Falling 3 , Pullback to 3/18!! $SPYAMEX:SPY shows 10D trend very clear. It is my hidden gem. We, by my charting, Should pullback until 3/18 ... not sure how far but I have plenty of targets on the way down to my ultimate target at 5200... I think we could flush to $560.. Good Luck yall. Gems I tell ya... sorry I'm so bad at explaining things..
Crash!!!!!

$SPY $SPX OLD CHART BAR PATTERN COVID CRASH NOW!!!!Holy crap.... I just came across an old chart and literally in the nick of timeI tell you. All I'm going to say is... I'm a pattern chart trader and this is the COVID bar pattern attached to our daily from like a year ago almost and I loaded up an old layout to do work and boom... here we are... Good LUCK ... Not sure what the trigger will be but we are here.

$QQQ Dead Cat to 10 WMA, then lower. Buy $496, Sell $514 What I see here is a double top on the weekly just like 2022. I can see our last 9 count in 2022 produced a 30% rally to the top. After the rally several months of sideways movement until we break trend. If we are Indeed Repeating the 2022 TOP. Then we have a harsh year ahead of us. As I said in previous posts, we should close February at the low of January. I have KRE falling out next week so I'm skeptical about what's going on. We've got DOGE checks and what not, who knows. I'm extremely bearish and I do believe we will bounce into a rejection this next week, then fall even further the week of 3/14. I will update day by day. For now, $496 will be my Buy. and $514 will be the Sell. Take Care Yall.


CRASH - CRASH - CRASH - Don't believe a word of it...I created this video because I'm seeing a bunch of content/videos where everyone is suddenly calling for a CRASH. and I laugh about it.
If you want to believe the markets are going to CRASH - go for it.
Sell everything. Bet the farm on the CRASH. Leverage your house and everything you own to bet on the CRASH.
It's not going to happen soon.
My research is very clear. I believe the first opportunity for a deep (more than 25-35%) market pullback will happen after late 2029 and into 2030.
Until then, we are going to see moderate pullbacks in a very solid uptrend.
Watch this video and learn why real research and modeling systems don't react to the Crash-Dummies that continually push out CLICK-BAIT.
It's time to get real about your trading and investing.
If you are following someone who continually calls for a market crash - good luck.
At some point, you are going to come to the realization they are wrong 90% of the time. Try to find someone you trust who provides clear, timely, and ACCURATE forecasts.
Get some.
#trading #research #investing #tradingalgos #tradingsignals #cycles #fibonacci #elliotwave #modelingsystems #stocks #bitcoin #btcusd #cryptos #spy #gold #nq #investing #trading #spytrading #spymarket #tradingmarket #stockmarket #silver

My current XRP 'flash crash in April' thesis chartThis is the current chart that I'm using, which includes approximate areas and an approximate timeline for my coming 'flash crash in April' thesis. This involves XRP bottoming out very soon, then going on a 'false breakout' heading into April, followed by a flash crash sometime in mid to late April. This will then mark the low of this area of the chart, and the real breakout will occur sometime in May, which I believe will take XRP to a new all-time high and true price discovery.
Keep in mind that this is a theory, which is developing day by day, and may or may not actually come to fruition. It's based on a chart I've released in the past called 'THE XRP BREAKOUT CHART.'
*** The yellow line on the chart is a simple wave count, and not affiliated with Elliot Wave Theory, just for clarification.
Enjoy the ride.
Good luck, and always use a stop loss!

The current BTC chart, incorporating my 'flash-crash' thesisThis chart illustrates the current Bitcoin pattern, with my 'April flash crash thesis.'
I believe we will see another thrust lower into the green box ranges before a spring into the fifth wave. However, the fifth wave will be a "false breakout," as a flash crash in mid to late April is likely to occur, intentionally designed to sweep liquidity by liquidating overleveraged positions and triggering stop losses—driving price past the previous low set in the green box, only for the market to recover shortly thereafter and continue its breakout to the upside. This breakout will likely push beyond the pattern, taking out the all-time high, and setting a new high somewhere in the 20K to 25K range.
There could be some opportunities in the next 4 to 6 weeks, but with opportunity comes risk. Always use a proper risk management strategy suited to your skill level and wallet size.
Good luck, and always use a stop loss!

$QQQ WARNING! April Fool's Market a Joke this year at SUB $400Is this happening? I'm going to have to bet my money on yes. I have been doing this for a long time. Pattern Chart Trading . This has a high probability of happening imo. Is it absolute? Of course not. Is it better to be prepared? Absolutely. Now for the technicals of it.. I'm trying to do better with this...
If we take a bearish perspective on the fib from the previous high in December , and the most previous lower low mid January , we have ourselves at the 1.61 Golden Pocket below. I have a Bullish perspective if we hold here and move above the 1.00 Fib Level, mid January Lows at $499.70 . Last defense would be a 50% retracement to the .786 FIB at the $508 area. Currently, I expect a rally to the 50 day SMA for a retest, then a SLAM to $380s in April . This is the possibility. Take it with a Grain of Salt. The possibility is there. I have one Bullish outlook.. I will post after this...


BTC Major Pullback - Before Huge Upside PotentialI anticipate a significant retracement in Bitcoin over the next 12 to 24 months. If the price falls below $50,000, it may decline further to around $25,000, followed by a period of consolidation.
Renewed interest from new investors and institutional funds could ignite the next bull run.
What are your thoughts?

Solana: Time to Buy or More Pain Ahead?Solana has been in freefall since peaking at nearly $300 on January 19, 2025, dropping a staggering 61% to $115,47 in just 50 days, currently trading at around $119. A support zone for potential reversals.
The big question now: Is this the time to go long, or is more selling pressure ahead? Let’s break it down.
Key Support & Resistance Levels
Lost Key Level at $120
Solana lost the key support at $120, turning it into a resistance zone. For bulls to regain control, SOL must reclaim this level with confirmation and increased volume.
Next Key Lows to Watch
Below the current price, the next key liquidity zones are at $110 and $105, where buyers may step in.
Major Support Zone – $104 to $96
If selling continues, we have a strong support zone between $104.14 and $96.96, backed by multiple confluences:
Anchored VWAP Support: Taking the anchored VWAP from the 2023 lows at $8, we find it currently aligning near $100, a key psychological level.
Monthly Order Block: On the monthly timeframe, an order block sits right at $100 mark, reinforcing this level as strong support.
2024 Yearly Open: The yearly open from 2024 is at $101.72, adding another layer of confluence.
0.666 Fibonacci Retracement: Measuring from $8 to the all-time high of $295.83, the 0.666 Fib retracement is at $104.14, further strengthening this support zone.
Liquidity Pools: There's a lot of liquidity around the $100 area
Fib Speed Fan Support: The 0.7 Fib speed fan also aligns perfectly with this support zone.
Conclusion: The $104–$97 range becomes a high-probability long entry zone with minimal risk.
Long Trade Setup
Entry Zone: $118 – $97
Stop Loss: Below $95
Take Profit Target: $135
Average Entry: $105 (DCA)
Risk-to-Reward (R:R): a solid 3:1 or better
Strategy & Execution
With SOL already down over 60%, scaling into a long position makes sense. Here's how to do it the right way:
1️⃣ DCA Strategy – Instead of going all in, scale in gradually within the $118–$97 range for a better average entry.
2️⃣ Volume & Price Action – Watch for a spike in volume and bullish price action before adding to the position.
3️⃣ Psychological Level Play – There are likely many buy orders around $100, meaning a bounce before hitting lower support is possible.
Stay tuned for updates as this trade unfolds! 🚀

$1.51 to $3.25 casually DOUBLED while rest of the market crashes$1.51 to $3.25 casually DOUBLED today after being mentioned in chat many times
Sweet catch on NASDAQ:HMR 👏🤑
All while the rest of the market continues to hits new lows on a big red day NASDAQ:TSLA NASDAQ:NVDA AMEX:SPY NASDAQ:QQQ AMEX:DIA NASDAQ:META NASDAQ:AMZN NASDAQ:GOOG
Got to love these type of stocks
AEON 1.26 - 1.33 (+5.5%)
HMR 3.02 - 3.16 (+4.6%)
Total profit today: +10.1%
Nice profit today again while the rest of the market goes into deeper red.
Bulletproof strategy delivers again, no matter the overall market conditions.
Congrats!
See you in the morning!

Market Snapshotwww.saferbankingresearch.com
In light of Jerome Powell speaking Friday thought this was a great article
The below quote is from the FED as referenced in the article and Avi Gilburt rightfully asks why they would make stress tests LESS STRINGENT....hmmnnn
"The current severely adverse scenario features a slightly smaller increase in the unemployment rate in the United States compared to the 2024 severely adverse scenario. The current severely adverse scenario also features slightly smaller declines in house prices, which reflects the Scenario Design Framework’s response to the slightly lower ratio of nominal house prices to per capita disposable income at the end of 2024.
The current severely adverse scenario reflects a decline in commercial real estate prices that is 10 percentage points smaller compared to the previous year’s severely adverse scenario, recognizing that those prices have already declined by a little more than 10% relative to their most recent peaks and limiting the procyclicality in the stress tests.
The potential for spillover effects in asset markets and sharp changes in investor sentiment are captured by a decline in equity prices and an increase in corporate bond spreads, although these changes are less severe relative to last year’s scenario, reflecting less severe stress in commercial real estate markets.
The international component of the current severely adverse scenario shows a recessionary episode that, relative to last year’s severely adverse scenario, is the same for the euro area and less severe in all other countries or country blocs."

Greatest Volatility of all times is approaching...#vix the volatility index has been accumulating since covid 2020 crash. In higher time frame, TVC:VIX has broken out in 5th August 2024 and it was just a test!.. Then continued consolidation till this time , also doing the retest. at this zone, accumulation of the 2020 covid crash for a new impulsive wave!..
In lower time frame , several days ago VIX broke out the accumulation zone coming from 5th August and this warns you about your greedy positions my friends. We haven' t seen a real great volatility since covid crash and VIX chart is getting alarming. You' ve been warned. Not financial advice.
Temporary INVALIDATION: If VIX dumps below 13 zone , this will be more secure. Below 10 is the main invalidation.

$QQQ $508 Rug Pull ? All in on REDSo… attaching the bar pattern from Spring 2022, I see the next decline by the middle of next week. I’ll be placing my bets at today’s close if possible . 🫡 Target is $480 by next Friday. Short $508 into next week.


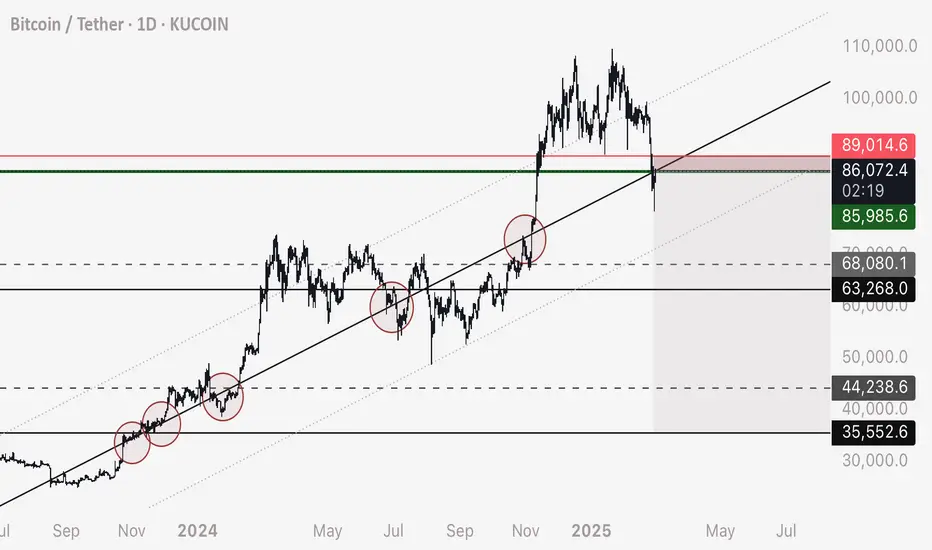
BTC - Watch this Trendline - Potential Short to 36,000I’ve drawn the main trendline and marked the contact points in red circles if you’d like to replicate this on your own chart
I’ve also demonstrated that when the correct trendline is identified, it can be duplicated and placed at different points on the chart that price seems to follow - IE support / resistance works on a diagonal grid
I’ve marked my personal entry in green, stop loss in red - minor targets in grey dashed lines and major targets in black solid lines
Fundamentally this drop makes sense as there is a mass amount of liquidity in these below zones.
Not financial advice, do your own research and experimentations.
God speed!
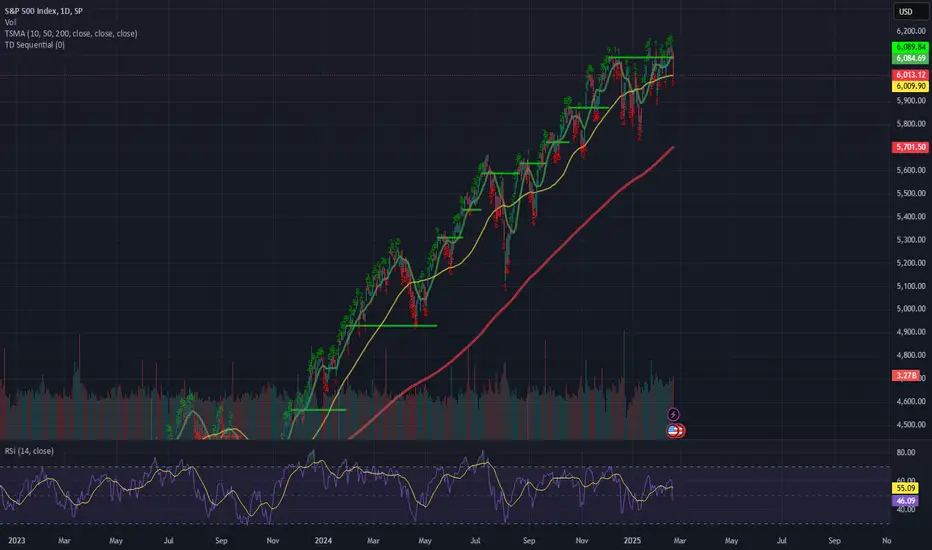
The stock market is not "Crashing"!I keep hearing people saying the stock market is crashing, a mild pullback is hardly a crash, we are not crashing, at least not yet, and maybe not for an extended period.
We use the S&P 500 because it is the best gauge of our markets with the most diverse representation of any of our indices.
A short history of the trend of our stock marker since 1992, correlated to presidencies.
1992-1999 Clinton: Stock market transitioned from fairly flat to a steady ascending path, we reduced our yearly deficit 6 years and had a budget surplus 2 years.
2000-2007 George Bush Jr: Descending or neutral trend most of the 8 years, we broke our 15 year ascending trend and started an overall descending trend. Deregulation led to the recession via predatory lending giving Walmart cashiers $300k loans, banks labeling bad debt as Grade A and banks leveraging 80% of all of Americans money on risky investments. 2008 was devastating for the US Stock market. Increased the yearly deficit 6 of 8 years.
2008-2015 Obama: Converted descending trend back to ascending trend and trended up in a tight ascending channel for the rest of his presidency, while implementing an array of regulations to prevent banks from doing this to America again. Decreased the yearly deficit 6 of 8 years.
2016-2020 Trump.v1: Maintained tight ascending channel and broke out of 15 year resistance, introduced a lot of lot of volatility and uncertainty, ultimately ended term with the market on the same trajectory it was when he took office. Diluted all US Dollars by 50%, 25% of the dilution was in 2020, coupled with $3T of quantitative easing in a single year (2020) and more than $2T direct stimulus, this dilution and excessive stimulus during a supply chain crunch directly conveyed into rising inflation the following 2 years. Increased our yearly deficit every year in office.
2021-2024 Biden: Broke out of ascending path to a much steeper and unsustainable ascending path, likely due to all the stimulus pumped into the market in 2020 & 2021. Hard pull back in 2021/2022 as Interest rates were increased to deter spending to reduce interest rates which skyrocketed to 10% in 2021 and was brought back down to just above 2% by 2024. We saw a volatile and sharp ascending channel form. At the end of his term, the market was at top of channel and well above all time highs with some of the most growth in the stock market ever witnessed anywhere on earth, ever, as seen in the charts, nearly doubling the S&P 500 in 4 years, the American economy was booming! Decreased the yearly deficit 2 of 4 years.
2025-2038 Trump.v2: Inherited the market at all time highs on the steepest incline we have witnessed to date, and at a point the market is expected to retract based on the charts. Currently it looks like the S&P could lose 15% or so of its value and still be in our ascending channel of 6 years now. As you can see recent pullbacks don’t even register on a weekly candle. Yes these tariffs and subsequent tariff wars will almost certainly wreak havoc on markets as we already see increase in unemployment, significant drops in consumer confidence, increase in debt ceiling, increase in debt through corporate tax breaks, uptick in inflation and uncertainty in policy but --- we still have a long way to fall before we can call this a bear market or a crash. If we do breakdown from the ascending channel, we can expect the S&P to eye around 3200, or nearly half of its current value. If this administration takes over the federal reserve, they can stimulate the economy to fight the decline and prolong the consequences but those measures will involve further dilution, further debt, further smoke in mirrors, further uncertainty and will likely ignite a ticking time bomb with even greater consequences then outlined here.
So in short, stop saying the market is crashing, it is not. But, be vigilant, there is a high probability of short term pullback and a long term crash based on the charts, historical precedence and current administrations activities.

BTC DOWNTREND FOLLOWSThe cryptomarket is facing a sell-off pressure as Bitcoin, the world’s largest cryptocurrency, has fallen below the $85,000 mark to trade at $83,740 on Thursday during intra-day, which is over 20 per cent down from its January peak of $109,350. This is the largest sell-off in 2025. Experts said ETF outflows and US President Donald Trump’s EU tariff threats have pressured the market, and Bitcoin (BTC) might experience a potential drop to $74,000.
As of 10:38, the live price of Bitcoin stood at $84,916.18 per (BTC/USD) with a current market cap of $1,683.86B. The 24-hour trading volume is $67.37 billion. Bitcoin declined by 4.61 per cent in the last 24 hours with a circulating supply of 19.83 million, according to binance.com.
EXPECT TO 78,000 AND BELLOW

To Thine Own Shoe be True - $BTC's Other Foot is About to FallBitcoin’s Floor Must Be Lower – Chart Physics and Market Psychology at Work
In this video, I explain why Bitcoin has no choice but to find a lower floor, despite many traders believing the worst is behind us. While price is briefly going to appear to confirm support, this is just part of the process before it comes back down and breaks through it on the third test. The real focus here isn’t whether this level holds for another day or two—it’s about why Bitcoin must go lower before it can establish true support.
For a long time, Bitcoin has been floating over clear air with no real structural support. When price climbs too high without building a strong foundation, it eventually has to fall back down to fill the gaps. Right now, the market is in denial, desperately trying to hold Bitcoin in the $90,000 range, but this isn’t about what traders want—it’s about chart physics and liquidity. When there’s nothing left to hold the price up, it must seek a lower equilibrium.
Psychologically, traders don’t want to accept that Bitcoin might have to revisit $70,000 or lower to reset before moving higher. But markets don’t move based on hope—they move based on supply, demand, and liquidity positioning. Right now, there are no meaningful buyers willing to absorb the sell pressure at this level, which means Bitcoin has nowhere to go but down. Once it finally breaks through, it will likely move quickly, as there’s no real support structure beneath it.
Know thy shoe.
The shoe will find the ground.
(My sincerest apologies about the volume ladies and gentlemen. The problem which I thought I had corrected from a prior video still exists in this video. It is an issue I'm hoping Trading View can correct before too long on their end… The problem originated on my end, but there was nothing I can do after it was recorded, and I had to get this video up there - I believe it contains important time sensitive information…
Please try listening with the volume turned all the way up or perhaps with headphones until the problem can be corrected.
My system issue has been corrected for the future, but Trading View if you can, please tweak this on your end and amplify it. This video is extremely worthwhile..)

BITCOIN/USDT Potential test of the 86k LevelsThe distribution of Bitcoin still in power, building top structure can potentially gets us to 86k Levels.

Solana - Likely to hold the 50% level at $138Solana at $139
50% level from top 2021 to bottom 2022 is at 138. Most likely this is the bottom area and we should eventually bounce form here. If it takes days or hours is hard to say. But for the bulls this is the area to hold.
For the bears you want to break below and hold below for days.
Im bullish. Total 3 going down on low volume is also a bullish sign for the market. Im buying.
Are you buying?

$SPY $SPX OLD CHART BAR PATTERN COVID CRASH NOW!!!!Holy crap.... I just came across an old chart and literally in the nick of timeI tell you. All I'm going to say is... I'm a pattern chart trader and this is the COVID bar pattern attached to our daily from like a year ago almost and I loaded up an old layout to do work and boom... here we are... Good LUCK ... Not sure what the trigger will be but we are here.
Market SnapshotHow do you see the economic future of America?
www.youtube.com
www.saferbankingresearch.com
"As such, as of Q3 2023, the total equity of the banks participating in the 2024 stress test was already lower than their loans to shadow bankers. Given that on-balance sheet loans to shadow bankers have increased by nearly 20% since Q3 2023, and assuming off-balance sheet loan commitments have grown at the same rate, total loan commitments to shadow bankers from the largest banks are now even higher. This makes shadow banking lending one of the largest segments—and, for some, already the largest—of these banks' credit books."
