Bitcoin At Resistance: OMG! Not Another 20X SHORT!Sell at resistance; buy at support.
Good morning my fellow Cryptocurrency trader, I hope you are having a wonderful day.
Being able to adapt to changing market conditions is one of the signs of being a great trader. Being able to spot changes on a chart is also indicative of someone that can produce great results in this and other markets. How are you feeling today?
It is no secret, we let everyone know; We sell when prices are high, we buy a lot when prices are low.
Bitcoin is now trading below its 20-Jan 2025 peak price. And it is also producing a lower high. Both bearish signals that are pointing to a lower low.
If the first drop settled around 100K, the second one should settle in the low 90s or right below 90K. It can go lower of course but we go step by step. I am not saying GO SHORT 20X again. This would only be possible for people who are smart, experienced traders and those that can take advantage of a changing situation without breaking their portfolio or long-term plans. Those can definitely SHORT this setup and profit short-term.
A trader trades, it is what he/she does. You sell when prices are high if a drop is incoming, you buy when prices are low if a rise is next.
This is a friendly reminder and it carries great entry prices and timing. Follow the chart.
Trading volume is super low as Bitcoin trades near resistance and this is one of the biggest exchanges in the world. Low volume at this point reveals a pattern of distribution, distribution means lower of course.
Both the MACD & RSI move on the bullish zone but trending lower, bearish at this point.
What will it be: Will Bitcoin move down next? Will Bitcoin move up?
My money is on down.
Leave a comment if you agree.
Thanks a lot for your continued support.
Namaste.
Crypto

XAU/USD.4h chart pattern.Gold (XAU) buy trade setup:
Trade Setup
Direction: Buy
Entry: 3386
1st Target: 3435
2nd Target: 3500
Stop Loss: Not provided (highly recommended to define this)
Potential Profit
To 1st Target: 3435 - 3386 = 490 points
To 2nd Target: 3500 - 3386 = 1140 points
Recommendation
🔺 Without a stop loss, the risk/reward profile can’t be fully evaluated. Please specify your stop loss to assess trade viability.
🛡️ Suggested Stop Loss (example): If you use 3340, then:
Risk = 3386 - 3340 = 46 points
RR to 1st Target = 49 / 46 ≈ 1.06
RR to 2nd Target = 114 / 46 ≈ 2.48
Would you like help setting an optimal stop loss based on volatility or recent support levels? I can also provide a visual chart analysis if needed.

Solana's Retrace Isn't Over, Lower HighSolana's retrace is not over, some weakness is showing up on the chart. Here we have a strong lower high on the daily timeframe coupled with very low trading volume. Low trading volume at this point signals that buyers are just not present. When no new buyers are present, the market will continue in the same trend. The trend is the drop that started 19-Jan, confirmed 23-May with a lower high. Today, a local lower high points to even lower prices.
Once the retrace is over, we can expect a new wave of growth; for now, we have to step back and watch (SHORT) until a new support level forms. When support is in, we can again buy (go LONG).
Sell at resistance, buy at support.
Adapt live to market conditions.
Thanks a lot for your continued support.
Choose wisely. Be smart.
Namaste.

BTC/USD.1h chart patternBTC/USD 1-hour chart, we can see that MY continuing a bearish price projection, and the chart has clearly defined target zones based on structure and Ichimoku analysis.
🔍 Key Observations:
Price is currently below the Ichimoku cloud, confirming a bearish bias.
A resistance retest has already occurred.
Price action suggests a clear break of structure, aiming lower.
Two horizontal target zones are marked below with a sharp projected drop (red path) and a blue downward arrow for emphasis.
---
🎯 Bearish Target Levels:
1. First Target: Around $104,000
This is your immediate bearish target.
Aligned with minor historical support and possible reaction area.
2. Final Target: Around $100,000–$101,000
This is the extended target and marked clearly on the chart with a bold arrow.
Likely represents a psychological level and strong liquidity zone.
---
✅ Conclusion:
Short-term bear bias remains strong unless the price reclaims and closes above the resistance/cloud zone (~$108,500).
Watch for potential reactions at $104K; if it breaks cleanly, $100K–$101K becomes highly probable.
Let me know if you want support/resistance zones or confirmations using volume or Fibonacci confluence.

Bitcoin's Price Action Reveals A Bearish Ethereum—Back To BasicsBitcoin is bearish, top confirmed; we know Ethereum and Bitcoin move together in the exact same way. This means that Ethereum will also move lower.
Here we have a higher high but lacking strength, volume is dropping. There will be a continuation of the retrace.
Consider waiting (SHORT) until after the FED decision result. The market can remain slightly bearish until after the event. The drop will open the doors for new entry prices. Market conditions can always change.
We are live with a 20X SHORT on Bitcoin, Ethereum will do the same. Just a small drop (can be a strong drop) ending in a higher low followed by a new wave of growth. Not all charts/pairs/projects are the same. Some will move down while others move up. Sell at resistance, buy at support.
Namaste.

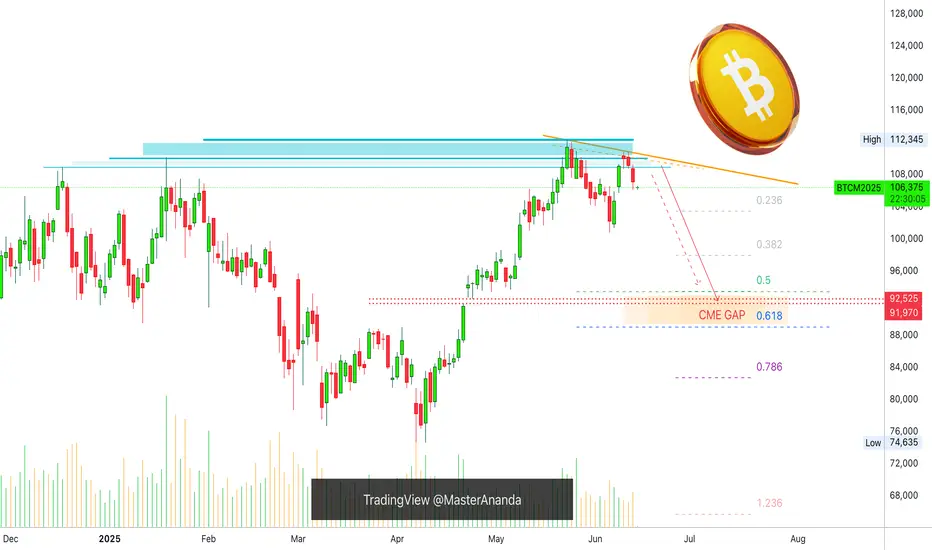
5 Bearish Signals —Bitcoin CME Gap (91,970 - 92,525)Bitcoin's bearish bias is confirmed clearly. Bearish signals are starting to pile up one on top of the other, let's recap those real quick:
1) Bitcoin is trading below its December 2024 high, it's January 2025 peak price and the recent 22-May all-time high. Trading below these levels open the doors for a move downward.
2) Recent lower high. 10-June closed lower compared to 22-May. This is a local lower high.
3) Overall low volume. Total volume decreasing since January 2025. No strong buying activity.
4) Sustained growth. Bitcoin grew straight up for 45 days. It is normal to see a retrace after sustained growth.
5) CME Gap. This is the latest signal that came to my attention and this gives further strength to the bearish case. The GAP sits between $91,970 and $92,525.
It is likely that Bitcoin will move lower before producing a new all-time high. Bitcoin is not likely to move below 80K. This is very unlikely.
Most likely Bitcoin will find support above 90K and if it moves below 90K this might be a brief occurrence lasting only a few hours or a few days at max. When all is set and done, we will continue to see long-term growth based on a bullish structure of higher highs and higher lows. The 7-April bottom will remain untouched.
Namaste.
Ethereum Set To Continue Lower, How Long?The drop is now confirmed and yet, it is still early...
Good afternoon my fellow traders, all is good when we consider the chart, Ethereum's price and the bigger picture, nothing changes. But we are witnessing a retrace. This retrace will end in a higher low and I am thinking of time now, duration.
Initially I was thinking about the Fed meeting and this event being the catalyst for change, but the Cryptocurrency market is following its own cycle and for it to be super bullish later this year, all bearish action, all weak hands, needs to be removed now, today.
So the bearish action can fluctuate between just a few days, 3-5 days, to 1-2 weeks. That's my analysis based on past history, chart data and experience.
The retrace might not last that long though, market conditions continue to improve and Ethereum might not produce a lower low compared to Bitcoin. Bitcoin is trading pretty high and a correction can develop any day. Since Ethereum is already low compared to its ATH, there is less room for prices to move lower, makes sense?
The downside is always limited, SHORTing is riskier than going LONG. It is wise to wait for a new entry before buying more. Experienced traders are recommended to SHORT. This chart setup will change in a matter of days, and then the market will turn bullish again, long-term.
Thank you for reading.
Namaste.

Cardano, What To Expect!The action is turning bearish after a very weak bounce from "higher low" on the chart. There is a sequence of local lower highs on ADAUSDT daily. What to expect?
Expect a test of the "higher low" zone as support and this zone breaking. The next level that will come into question is the "main support" but this one isn't likely to be tested.
Picture the action going lower towards support and ending right in between 'higher low' and 'main support'. This is the main scenario.
This scenario will keep the broader bullish structure intact and at the same time would end as a major market flush. As many weak hands as possible are removed and yet the bulls will remain in control.
Make no mistake, whatever happens in the short-term, Cardano will continue to grow. This is only a temporary event. Patience is key.
Thanks a lot for your continued support.
Namaste.

#TRX Ready for a Recovery or Another Fall Ahead? Key LevelsYello Paradisers! Are you watching the #Tron's recent moves in the market? Let's look at the latest setup of #TRXUSDT to see what could be the next move:
💎After forming a textbook Ascending Channel over the past few months, #TRX just got rejected hard from the upper boundary near the $0.29–$0.30 zone. That rejection didn’t just happen anywhere—it came right at the major resistance zone, which has acted as a key reversal point since early May. This kind of rejection, especially after multiple touchpoints, isn't just noise—it's a sign of momentum exhaustion at the top.
💎From an Elliott Wave perspective, it’s very likely that the first major impulse wave (Wave 1) has just been completed with this recent peak, and what comes next could be the start of Wave 2—a corrective phase that typically retraces deep and fast before the market resumes its larger trend. That means any weakness below the channel support could mark the beginning of a more prolonged decline, trapping breakout buyers and squeezing late longs out of their positions.
💎Price is now hovering dangerously close to the lower boundary of the channel, trading at $0.274 at the time of writing. This is where things start to get interesting. A decisive breakdown from this ascending support would not only confirm a bearish structural shift but would also trigger a cascade effect—invalidating the bullish channel and opening the door for a larger move to the downside.
💎If that breakdown plays out, the first meaningful support sits at the $0.2433 level. But that’s just the beginning. The next major demand lies down around $0.2259—a level loaded with historical volume and likely to attract strong buying interest. Until then, any small bounce is just noise in what could become a significant trend reversal.
Trade smart, Paradisers. This setup will reward only the disciplined.
MyCryptoParadise
iFeel the success🌴

Hyperliquid Correction Exposed, $16.6-$22.5 Range To Be TestedAfter a strong rise there is always a strong correction and I will call this normal market behavior.
Hyperliquid entered the TOP20 altcoins by market capitalization and now sits at #11. Amazing feat.
In a matter of 65 days, between 7-April and 11-June, HYPEUSDT grew a very nice 373%.
A correction can take prices back below the 0.618-0.786 Fib. retracement support range. Which means between $16.7 and $22.5.
As usual, after the bearish wave is over, we can expect a new wave of growth. This one should unravel fast.
Thank you for reading and for your continued support.
Additional details can be found on the chart.
Namaste.

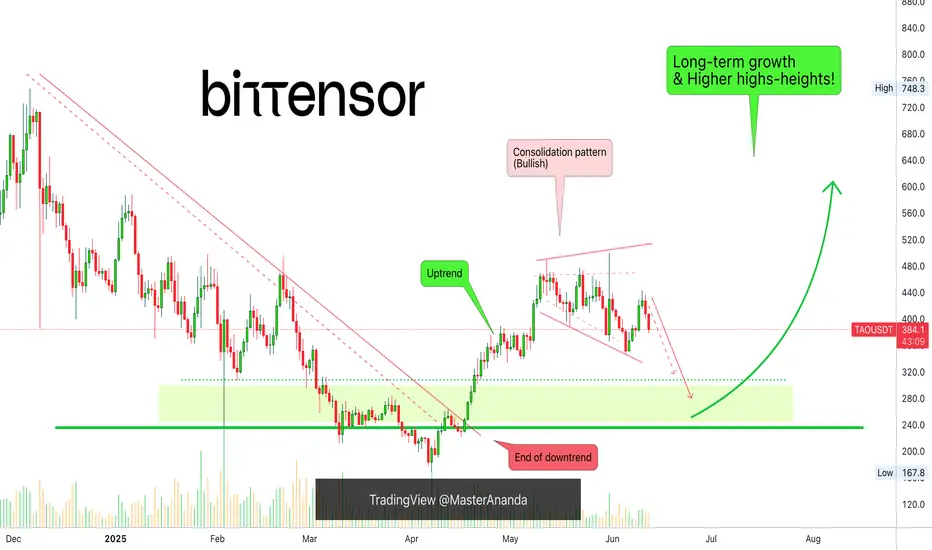
Bittensor Won't Go Much Lower (Long-Term Growth Explained)I am not concerned when looking at TAO (Bittensor) because I know that it won't go much lower and I also know, based on the chart, that it won't be bearish for much longer... And this is all great news.
Good... Good, good, good.
Good afternoon my fellow reader, I am happy to receive once more your undivided attention. It is my pleasure to receive your support.
Please, allow a minute of your time for me to read this chart.
It is the same pattern all over again, when the market is set to grow, it grows; but, long-term growth means months of prices moving higher and the market is never in a hurry to make you rich. So, it will grow but it takes time and time we have, time we want more, time we need but also we waste lots of time in things that are not productive, so let's use this time to plan for what will be coming next.
The moment is now, true. TAOUSDT and Crypto are bearish now and that's ok. You know why this is great news? Because being bearish now means that soon this phase will end. The market can only be bearish for so long. When it is bullish, at some point it turns bearish but, when it is bearish then again it moves back up.
TAOUSDT is already very close to strong support and this support will be the end of the bearish wave. Give or take one week and this will mark the start of the next bullish phase. Three months of sustained growth, another retrace and the more growth, on and on and on.
So, prepare now to be able to profit from the incoming bullish wave. The market will continue to fluctuate but with a strong bullish bias, and that is all that matters. We want to see our market grow because we will grow together with the market. If you are reading this, you are part of this market and that's very wise because Crypto is young.
Joining a new financial market in its early days... The opportunity of a lifetime and it was made for you to take.
Thanks a lot for your continued support.
It is truly appreciated.
Namaste.
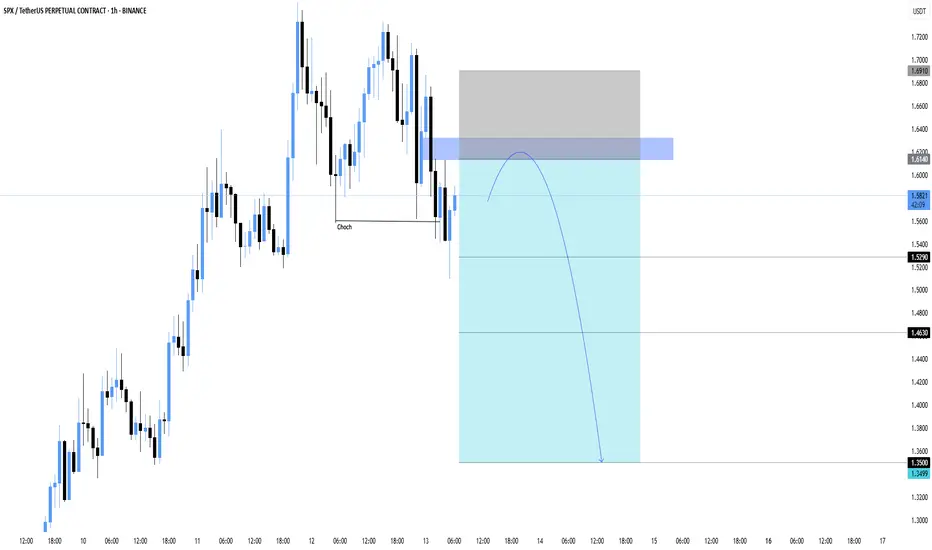
SPX/USDT — Change of Character Signals Bearish Move Incoming The structure has shifted with a clear CHoCH (Change of Character), suggesting that bullish momentum is weakening. Price recently pulled back into a supply zone around 1.6140–1.6910, setting up a potential short opportunity.
🔍 Technical Breakdown:
Price broke below recent higher low = CHoCH confirmed
Bearish BOS followed by retracement into premium zone (FVG/Supply)
Expecting rejection and continuation to downside if price fails to reclaim 1.6140
🔧 Trade Plan:
Entry Area: 1.6140
Stoploss: Above 1.6910
Targets:
• TP1: 1.5290
• TP2: 1.4630
• TP3: 1.3500
This setup aligns with internal structure + supply zone + CHoCH. Wait for confirmation candle or bearish engulfing in entry area before executing.
Bitcoin's Correction Confirmed, 93-97K Next TargetBitcoin's bearish continuation is now confirmed with three consecutive days of bearish action, today being a full red candle.
Good afternoon my fellow trader, how are you feeling today?
Opportunities are endless in this market, and if you trade, you can profit from the bullish as well as the bearish waves. Good entry timing is all that is needed for a successful trade, the right map and mindset.
So the lower high is confirmed and today's action confirms an incoming lower low. The 100K support is very likely to break but this is not written in stone. This is a high probability scenario. We are aiming for a price range of $97,000 - $93,000. But this isn't necessarily the end. Depending on how this level is handled, we will be able to know if prices will go lower or what.
$88,000 is a good level in the case there is strong bearish volume when the above price range is challenged as support. Now it is all a wait and see. Patience is key.
Once the a new support zone settles, we adapt to the market and focus on green. The next step is red. Down we go.
Thank you for reading.
Namaste.

Dogecoin Bearish But...Yes, Dogecoin is bearish now but this is only a short-term situation, it is the end of a long-term correction. Notice the chart, Dogecoin has been producing lower highs long-term, since December 2024.
Recently, there was a major low in April and then a recovery and after this recovery we have local lower highs. The current drop is the continuation of the retrace that started 11-May. This retrace should end soon, within weeks or just a few days.
As soon as the low settles, we can enter the market bullish again. If you trade spot, simply wait. Day traders can easily SHORT but the range is short, after a small drop cover and switch back to LONG. Experts only.
That's the scenario. We are very likely to get a higher low compared to 7-April. If too many leveraged positions are open though and the market wants to remove those, there can be a long wick that pierces support for the action to recover the next day.
So, the drop can be fast, can be small, can be hard, can be easy or it can be short, it doesn't matter, once it is over, Dogecoin will continue to grow.
Patience is key.
Thanks a lot for your continued support.
Namaste.

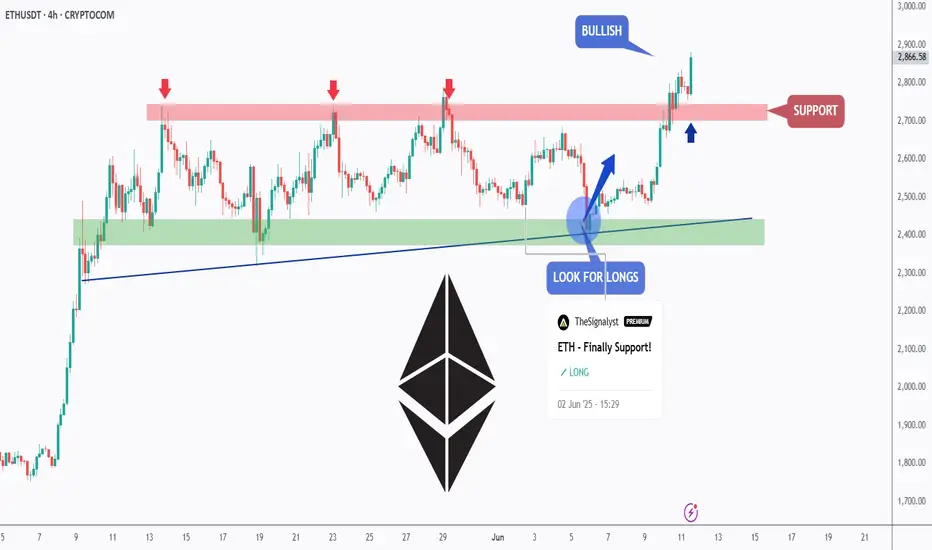
ETH - Medium-Term Bulls Confirmed Control!Hello TradingView Family / Fellow Traders. This is Richard, also known as theSignalyst.
📈 As per our previous ETH analysis (shown on the chart), ETH rejected the green support zone and pushed higher, reaching our target near $2,750.
What’s next?
After breaking above the $2,750 structure marked in red, the bulls have confirmed medium-term control.
🏹 As long as the last major low at $2,700 holds, ETH is expected to remain bullish, with a potential move toward the $3,500 resistance zone.
📚 Always follow your trading plan regarding entry, risk management, and trade management.
Good luck!
All Strategies Are Good; If Managed Properly!
~Rich
Dogecoin, How Far Down Can It Go? Support Confirmed!The retrace is on and Dogecoin is moving lower with a full red candle. The trading day just started and this is truly concerning. As soon as I saw what was happening, bearish momentum growing, I wondered, will the last low (7-April) break or hold?
That's the question I will try to answer.
Since we already looked at the candles and chart structure (lower highs), I looked at the RSI to try and find some clues. Sure, the RSI is already bearish and became really weak 5-June. This is a positive signal because we are looking for signs of a reversal.
Once the RSI becomes weak it immediately starts to turn and the change happens first on the RSI and later the price. This is how you end up with a bullish or bearish divergence on the chart.
For the 7-April low to break, the RSI would have to go into extreme levels, ultra-weak/oversold, but this isn't likely, which means that there is a good chance that the 7-April low will hold.
A support zone is already being tested now which is the 0.618-0.786 Fib. retracement in relation to the April-May wave. While this is a weak support because it is based on the short-term, it is still a support zone and lots of bearish ammunition will be consumed here.
The 7-April low was a peak in September 2024 and also a bigger range from July 2024 (resistance turned support). In October 2024 this level was broken and tested one last time as support before the last bullish wave Dogecoin produced leading to a multi-year high.
In November 2024 again this level was tested on a wick and held nicely.
All in all, this means that we are likely to end with a higher low because this is a very strong support zone. I made it red on the chart.
If the action does move lower, it should only do so briefly on a candle wick. If you are lucky enough to be around when this takes place, you can go all-in at this point and you will be sitting on a great position for the next bullish wave.
Namaste.

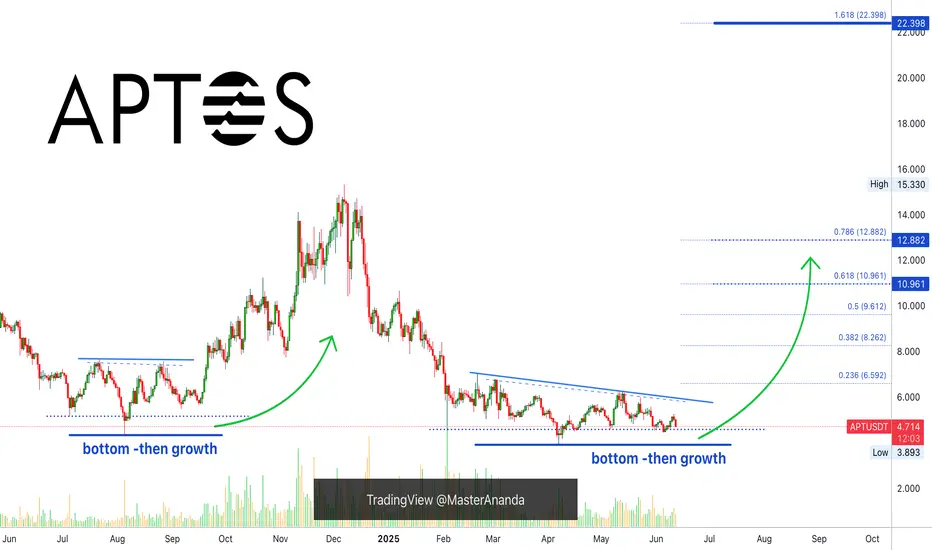
Aptos, Good & Bad (Leveraged Trading vs Spot)This is both good and bad at the same time.
The bad part, or rather sad part, is the fact that there hasn't been any decent bullish action recently. This pair did not grow by any significant amount after its 7-April low.
Ok, what about the good part?
The good part is that prices are low. This pair is "yet to move."
Low prices means a great buy opportunity for what we know comes next.
I know, I know... You might not believe me or your morale might be done but we already had a preview with many pairs growing between 100 and 300%. In less than two months. That's the preview. But the market is big and not the entire market can advance in a single wave. That's why I keep on harping "choose wisely," because sometimes we can end up with the pairs that are not moving in the current wave. They will move, trust, but some will move now and others later down the road.
Ok, good and bad.
The bad part is not that bad but it can be said that it is bad that prices are low. But this is actually good. If prices were high, there would be no buying opportunity, we would have to ignore, dismiss this pair. Since prices are trading low-near support, we can accumulate; buy and hold focused on the long-term.
I mentioned tons of times leveraged trading but all these chart setup can be traded spot. In fact, any setup that is good for leverage is even better for spot because the risk is none.
With spot trading we simply hold. What's the problem? You expected 1,000% growth in 2 months? If that's the case, it simply takes longer and we wait. See? No loss, the worst case scenario is a long-term wait. That's spot trading, buy and hold and you will win in the end.
Leveraged trading is more complex but you know, risk vs reward. You put on lots of risk, huge risk but wow, the rewards potential is awesome. We only approach this tool when we learn the market, when we know what we are doing and we have no need for money; only when money is already plentiful and available.
If you have a need to earn now, "make money fast," and so on; avoid leveraged trading at all costs because it is very likely that you will lose everything rather than achieve success. But, on the other hand, if you are living the good life, you communicate with your wife and you have heart, you are grateful for the food you eat, for the simple stuff, for your house, your friends, your bed; then you can use leveraged trading. Because you will be able to know when to close a position and say "thank you!" rather than double-down on a losing trade.
In short, we need a stable life and mind to use this tool with any success. If our lives and minds are not stable, it is better to start slow. If you cannot make money slow, you will not be able to make money fast. If you cannot appreciate $100, you won't be able to accept $1,000 for a single trade.
So, thanks a lot for your continued support.
I hope you are enjoying the content. It is always my pleasure to write for you, day after day after day.
Remember, it is not about getting it right or getting it wrong, it is all about a mental, emotional and spiritual connection. I am sharing what I learn just so that you can avoid the pain of a major loss, something that I know just too well because I've been there before. I've lost everything countless times and yet, I continue to fight, prosper and grow.
Namaste.
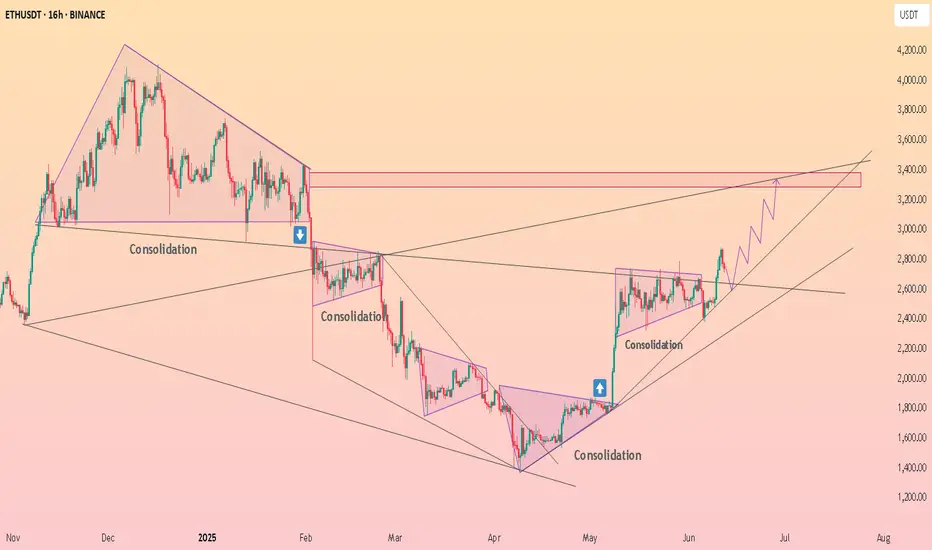
HolderStat┆ETHUSD above the consolidation zoneCRYPTOCAP:ETH
→ Basing above 2 400 while probing triangle apex
↳ Crack 2 550–2 600 for runway to 2 850–3 150
⇢ Trend guard sits at 2 650 → 2 500
⤴ Close < 2 650 drops Ether back into old range
Bitcoin - Breakout incoming towards $115k?Introduction
Bitcoin (BTC) has been consolidating just below a key resistance level over the past several days. This period of sideways movement, without any significant pullbacks, reflects notable strength in the market. Such price behavior often precedes a strong directional move, and in this case, the technical setup continues to favor the possibility of a bullish breakout.
1H BullFlag Pattern
On the 1-hour timeframe, BTC is forming a well-defined bull flag pattern, which is typically a bullish continuation signal. This flag began to develop after BTC surged from approximately $105,000 to $110,000, creating the flagpole that represents the initial wave of upward momentum.
Since that move, price has entered a consolidation phase, forming the flag portion of the pattern with declining volume and tighter price action. If BTC breaks out above the upper boundary of this flag, the measured move target projects a rally toward the $115,000 level. Reaching this target would represent a new all-time high for Bitcoin, signaling a continuation of the broader uptrend.
4H Fair Value Gap (FVG), Downside Scenario
Although the overall structure favors a bullish outcome, it is important to acknowledge the potential for a short-term retracement. On the 4-hour chart, there is a Fair Value Gap (FVG) between $105,700 and $106,800. If BTC fails to break out immediately, this zone becomes a logical area to monitor.
Price may revisit this imbalance to fill the gap left behind by the recent upward move. A dip into this area could present a strong opportunity for long entries, particularly if buyers step in with conviction. Filling this FVG would allow for a more balanced structure before BTC attempts a sustained move higher.
Conclusion
BTC continues to show impressive resilience as it consolidates near its prior highs. The presence of a bull flag on the lower timeframes, coupled with minimal downside volatility, suggests that a breakout above resistance is becoming increasingly likely.
However, reclaiming the previous all-time high remains a critical step before targeting the projected $115,000 level. How BTC reacts to that key resistance area will provide important insight into the strength of this rally.
At this stage, the bullish case remains the higher probability scenario, while any short-term pullback into the FVG zone could offer a healthy reset and a potential long setup for continuation toward new highs.
Thanks for your support.
- Make sure to follow me so you don't miss out on the next analysis!
- Drop a like and leave a comment!

XRP Showing Some Weakness But...Here the bearish signals are not as pronounced as they are on Bitcoin or some other pairs which are basically trading near their all-time high, XRP is in a different situation. Still, a lower high is in place and trading volume is really low right now. This low volume always works as a continuation signal, which means it has no value. Whatever the chart is doing that is what is happening for real.
The main high happened 12-May and then a retrace. The lower high happened 9-June but then again today. Today's session wicked higher but it is already full red. Again, the signals are weak but we know the market is all the same. The big cap. projects move together, if Bitcoin goes down, Ethereum goes down, if Ethereum goes down, Cardano goes down, if Cardano goes down XRP is going down, etc. But we can also look at the charts individually.
On the other hand, smaller pairs can be growing strong and thriving, some will grow while others move down, why? Because we are in bull market zone. When the market is bearish, a bear market, Bitcoin goes down and everything follows. When the market is bullish, many can grow while some go down. This is what is happening today.
Wait patiently (SHORT), once support becomes established we can enter again.
We don't know if the market will produce a higher low short-term, vs 5-June or a lower low. But it is wise to secure your position because things can change in a flash. A higher low is possible which would mean a non-event, but, seeing the lower high and the low volume weakness, a market flush is likely to take place.
If we are set to experience new heights in late 2025, the correction must happen now, and with this statement the chart agrees. Down we go. It is still early though for this pair.
We will see how it goes.
Thank you for reading.
Namaste.

Bitcoin will rise from support level and exit from wedgeHello traders, I want share with you my opinion about Bitcoin. This chart shows how the price rebounded from the current support level and then turned around and rebounded up. Price broke the 109000 level, coinciding with a support area, and then traded near this level for some time. Later price turned around and started to decline inside a downward channel, where it soon broke the 109000 level, reached the resistance line, and continued to fall next. Bitcoin fell to the support line of the channel, which coincided with the 103000 support level and buyer zone, after which it rebounded up. Then BTC exited from channel and later entered to upward wedge, where it at once made a correction movement from the resistance line to the support line, breaking the 103000 level. But soon, price made an impulse up, breaking the support level one more time. Next, it rose to the current support level, broke it too, and now trades inside the support area. In my mind, BTC can rebound from the support level and rise to the resistance line of the wedge. Then it can break this line, thereby exiting from the wedge and continuing to move up; therefore, I set my TP at 112000 points. Please share this idea with your friends and click Boost 🚀

Aave Has Room To Go Lower, I Will Spot The ReversalAave outperformed many pairs. Total growth reached 185%. It even produced one final advance and peaked only two days ago, 11-June. But now the bears are in and taking control of the chart. A strong rise is balanced out by a strong drop.
I think this is a nice project, a great project a nice pair. The strategy here is all the same. Advanced traders go SHORT. The rest, wait for support to be established before going LONG. Wait for the drop to end before buying again.
Remember, there will be plenty of time and plenty of signals showing the low is in. I will be here posting charts everyday.
I will catch the perfect bottom on this retrace, the same we did 7-April. It will be easy.
In fact, we will spot the reversal even before it takes place.
Thanks for the follow and for your continued support.
Namaste.

BITCOIN (BTCUSD): Pullback From Support
Bitcoin nicely respected a key horizontal support.
A breakout of a resistance line of a falling wedge pattern
provides a strong bullish confirmation.
I think that the price will go up and reach at least 108.320 level.
❤️Please, support my work with like, thank you!❤️

BTC/USDT 4H Chart Update –BTC/USDT 4H Chart Update –
After a strong rejection from the $110K+ zone, Bitcoin is now retesting a critical trendline support on the 4-hour chart.
Key Highlights:
Price dropped sharply to $103K, almost tagging the key ascending support zone.
The previous breakout from the descending trendline is now being retested, which is a classic bullish retest pattern.
If bulls defend this region successfully, expect a potential bounce towards $108K–$ 114 K.
However, a clean breakdown below $102K would shift short-term momentum bearish.
Eyes on this zone. High-probability decision area.
Watch for reaction candles and volume spikes to confirm the next move.
Thanks for your support!
DYOR. NFA
