BTCUSD Can it do this one more time?Bitcoin / BTCUSD is on a strong 1week MA50 rebound, while staying inside the Channel Up from the Cycle bottom and holding the 1week RSI Support.
Last time it did that was during the 2015-2017 Bull Cycle.
In fact it was May 2017 when the price started rising aggressively and eventually broke above the Channel Up into a relentless parabolic rally until the end of the year.
With the Cycle seemingly identical, do you think Bitcoin can do this one more time?
Follow us, like the idea and leave a comment below!!
Crypto

HEDERA Not high hopes. Upside is limited.Hedera / HBARUSD is on a 1week MA50 rebound with the 1week MACD close to a Bullish Cross formation.
This is the very same pattern it followed near the end of the previous Cycle on the June 21st 2021 rebound.
See the identical 1week MACD patterns, even the similar price structure on the 2020 and 2024 Bull Flags that initiated parabolic rallies.
Actually HBAR topped 2 weeks after the 1week MACD formed the Bullish Cross. The Bearish Divergence there was evident.
As a result, since the previous Cycle topped on the 1.236 Fibonacci extension, we expect HBAR to rise to 0.5000 max. Nothing like the parabolic rally it had after the recent U.S. elections.
Follow us, like the idea and leave a comment below!!

PEPEUSD broke and closed last week above its 1week MA50.Inside its historic Channel Up, this is the earliest confirmed buy signal and last time it priced the bottom of the pattern, confirming the start of the new bullish leg.
Note also that it just formed a Bullish Cross on the 1week MACD.
Last time the whole wave peaked at a massive +2756%. Repeating that gives 0.0001400 and that can be achieved by the end of the year.
Follow us, like the idea and leave a comment below!!

1 Billion USD+ SHORTs Liquidation —Bitcoin BullishGood morning my fellow Cryptocurrency trader, I hope you are having a wonderful day.
We all know that life is not a game of checkers, it is more like fifth dimensional chess. It can be easy once we master how to play but it is actually hard to learn the game. The same goes for trading Cryptocurrencies, it is not an easy game.
Billions of dollars are about to be liquidated from SHORT traders. The All-Time High liquidation. This is a friendly reminder.
» If you are bullish, congratulations. You are good and you will do great.
» If you are bearish, there is still time, you don't have to lose knowing beforehand what will happen next.
The whales and market manipulators are setting up a trap right now, but they can never fool you because you know best.
What do you know?
» You know Bitcoin to be bullish because it is easily trading above 100K.
» You know Bitcoin is rising because it has been moving up since the 7-April low.
» You know a continuation will soon follow because we have signals coming from the Altcoins, the Stock market and Gold. Everything is pointing up.
I know you are smart and thank you for coming back and reading again. In only a matter of days, billions of dollars worth of SHORTs will be liquidated. Make sure not to be caught on the wrong side of the fence.
» Bitcoin is going up.
Namaste.

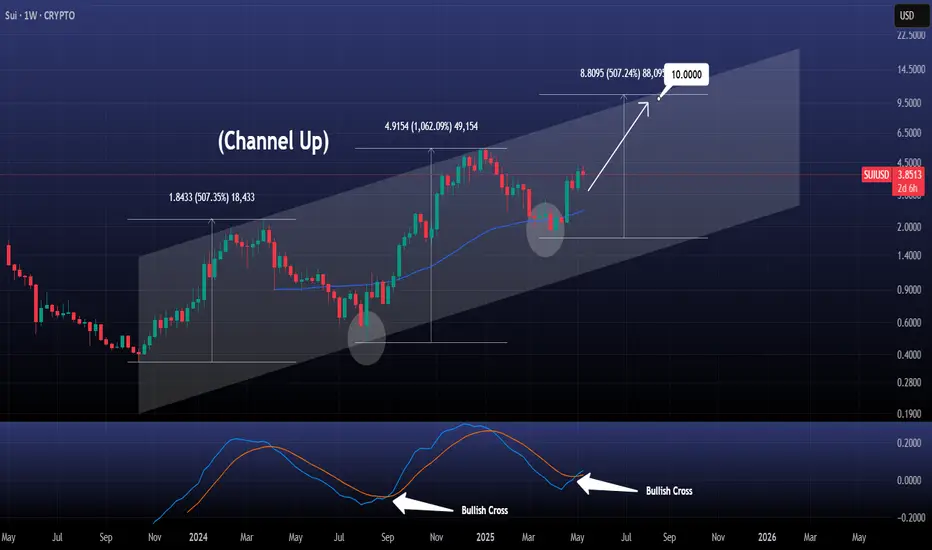
SUIUSD Massive Bullish Cross was just completed!SUI just made a Bullish Cross on the 1W timeframe, its 2nd ever.
The first one was on September 2nd 2024, 4 weeks after the price bottomed on the long term Channel Up and rebounded.
The latest Cross was also formed 4 weeks after the April 7th 2025 bottom and even though we don't expect a similar +1062% rise, we do expect the growth that the first Bullish Leg had (+507.35%).
Target $10.000 right at the top of the Channel Up.
Follow us, like the idea and leave a comment below!!
ETHBTC Is it repeating its first Cycle?I know that the timeframes are not the same but don't tell me that the structure between then and now isn't similar.
The biggest difference is that in 2016 ETHBTC made a deeper low than now, but the current rebound is showing signs that we might have a similar parabolic rise.
Now will that be enough to give a new All Time High?
We will see, but don't tell me that this can't target 0.0900 byu the end of the year.
Follow us, like the idea and leave a comment below!!

BTCUSD: is far away from its Sell Zone.Bitcoin remains overbought on its 1D technical outlook (RSI = 70.017, MACD = 4154.600, ADX = 16.535) but still in the middle of the Cycle's Channel Up. After a 1W MA50 rebound (April 7th) on the bottom quarter, it is aiming for the blue Sell Zone of the top quarter of the Channel Up where the last two tops were priced. A +93.64% rise has been the most common inside this pattern. Based on that the minimum TP for this run is 140,000.
## If you like our free content follow our profile to get more daily ideas. ##
## Comments and likes are greatly appreciated. ##

NEOUSD: Minimum target for the end of this Cycle $30.Neo turned marginally bullish on its 1D technical outlook (RSI = 56.743, MACD = 0.356, ADX = 25.407) as it has validated the start of the new bullish wave, rebounding on the same level as it did on March 9th 2020. This is the least aggressive Bull Cycle for new but the presence of a HH trendline implies that a Cycle high can be minimum made on it. With the 1W MACD about to form a Bullish Cross, we expect the HH to get hit by the end of the year (TP = 30.000).
## If you like our free content follow our profile to get more daily ideas. ##
## Comments and likes are greatly appreciated. ##

Ethereum is Approaching an Important Support Zone!!Hey Traders, in today's trading session we are monitoring ETH/USDT for a buying opportunity around 2,520 zone, Ethereum is trading in an uptrend and currently is in a correction phase in which it is approaching the trend at 2,520 support and resistance area.
Trade safe, Joe.

Will #JASMY Retest Trigger a Rebound or a Breakdown? Key LevelsYello Paradisers! Have you prepared yourself for what’s about to unfold with #JASMYUSDT? The #JasmyCoin setup is showing signs of a major move:
💎#JASMYUSD has just completed an impulsive move from the Major Demand Zone around 0.01509 and is currently retesting the ascending support after breaking down from the short-term channel. This is the critical moment where disciplined traders prepare their next move, not after the bounce, but before it.
💎What we’re seeing now is a textbook retest of the ascending support, after an aggressive move from the major demand zone. The price is currently hovering just above the 0.01742 support level, a critical area that aligns with the high-volume node from the visible range volume Profile (VRVP), making this a high-probability reaction zone.
💎If the #JASMY price holds here, and we start seeing buyer strength reclaim the broken ascending channel, this could trigger a sharp bounce targeting the mid-term resistance at 0.02221. Above that, the next magnet will be the major resistance sitting around 0.02512, a level likely to attract profit-taking or even large-scale short entries from smart money.
💎However, failure to hold this support and a confirmed breakdown below the 0.01509 zone would invalidate the bullish structure entirely. In that case, we would be looking for a possible bearish continuation, driving the price toward 0.01400 and possibly lower, where more liquidity pockets remain untapped. That move would also trap late long entries and clean out weak hands — the exact kind of shakeout we warn about.
Play it safe, respect the structure, and let the market come to you!
MyCryptoParadise
iFeel the success🌴

HelenP. I Bitcoin will fall to support zone and then start riseHi folks today I'm prepared for you Bitcoin analytics. This chart shows how the price continues to trade inside a rising channel, with the price currently hovering just above the support zone around 101000. After forming a clean consolidation phase near the upper boundary of the structure, the market is showing signs of a potential pullback toward this zone. However, the broader trend remains bullish, and as long as price holds within the ascending formation, this correction may act as a base for the next move higher. The consolidation structure formed at the top indicates that buyers are not rushing in aggressively, but they are also not allowing prices to drop sharply, a classic sign of accumulation. This aligns well with the previously confirmed trend line and horizontal support zone. If BTC holds this area and finds renewed momentum, I expect a breakout from the consolidation range to the upside. My goal remains at 107000 points, which sits a little higher than the projected top of the current channel. Given the strength of the structure, the higher lows, and the recent defense of support, I maintain a bullish bias and anticipate another upward wave from this level. If you like my analytics you may support me with your like/comment ❤️

XLMUSDT Potential UpsidesHey Traders, in today's trading session we are monitoring XLM/USDT for a buying opportunity around 0.2730 zone, XLM/USDT is trading in an uptrend and currently is in a correction phase in which it is approaching the trend at 0.2730 support and resistance area.
Trade safe, Joe.

Bitcoin Potential UpsidesHey Traders, in today's trading session we are monitoring BTCUSDT for a buying opportunity around 100,000 zone, Bitcoin is trading in an uptrend and currently is in a correction phase in which it is approaching the trend at 100,000 support and resistance area.
Trade safe, Joe.

AC Milan Fan Token, Volume SignalHere we have the "volume signal" as well as other signals that I mentioned in the ATM analysis. That is, ACMUSDT is now trading green for four consecutive weeks after a new All-Time Low and the action just recovered above its 3-Feb. low.
Good afternoon my fellow football fan, how are you feeling in this wonderful day?
This is a great chart because prices are low and the best time to buy is when a trading pair (a Cryptocurrency project) is trading low near support.
As soon as the first major low came in February 2025, the session that followed produced the highest buy volume ever. Then again in late March there is really high volume and the last four weeks volume has been good (above-average) and green. Before February 2025, the volume bars are very small, very small... With the exception of August 2022 when the All-Time High was hit followed by the strongest and longest bearish cycle in the history of this coin.
A long-term downtrend or bear market is followed by a long-term uptrend or bull market.
This is a good pair right now.
Strategy: Just buy and hold, never use a stop-loss, never, unless you are a professional trader and have been trading Crypto for 6 years or more. If you have been around for less than six years, you don't need a stop-loss. You can make more money with the strategy of buy and hold. With time you will understand. If you set a stop-loss, the whales and bots will take your money away. You just need to inject money into the market every day, every week, every month or as much as you can afford; let it grow. With time, you will be happy with the results.
Set it and forget it, that is all it takes. You just wait patiently and over time you will see how your balance appreciates. This is a young market, imagine buying Google, Apple or Microsoft when these companies were new and young. You don't want to be selling nor setting stop-loss orders on these stocks, you just wanted to buy to later retire when the inevitable happens. Or you can sell when prices are up. Never sell when prices are down.
If you don't sell at the All-Time High, there is no point in selling at the All-Time Low. Better wait, it will recover.
Thanks a lot for your continued support.
Namaste.

BITCOIN - Price can leave pennant and rise to $106500 pointsHi guys, this is my overview for BTCUSDT, feel free to check it and write your feedback in comments👊
Some time ago, price traded inside a flat, where it declined to the $93400 support level and then rose to the top part of the flat.
Then it corrected, after which made a strong upward impulse, exiting from flat, and continued to grow in pennant.
In pennant, BTC broke $97800 and $102300 levels, after which it made retest and continued to grow to resistance line.
When the price reached this line, it corrected to support area, after which tried to grow, but failed and fell back.
But recently it rose to the resistance line of the pennant, where at the moment it continued to trades near.
In my opinion, BTC can correct to support line and then bounce up to $106500, exiting from the pennant.
If this post is useful to you, you can support me with like/boost and advice in comments❤️

ADAUSDT IDEAI think chart looks pretty clear now. Red supply area properly laid down. Along with price properly taking buys from demand area in blue with higher lows. So obvious path will be the movement above supply till next supply (red area). Remember the supply is selling area (no retest concept) so strong selling could also originates. so trades are only after breaking out with clear price marching above supply zones.

XRP is so BACK!Hello TradingView Family / Fellow Traders. This is Richard, also known as theSignalyst.
As per our last XRP idea, attached on the chart, it rejected the lower green structure and surged by over 25%.
📈XRP is now bullish long-term trading within the rising channel marked in blue.
Moreover, the upper green zone is a strong structure!
🏹 Thus, the highlighted blue circle is a strong area to look for buy setups as it is the intersection of structure and lower blue trendline acting as a non-horizontal support.
📚 As per my trading style:
As #XRP retests the blue circle zone, I will be looking for bullish reversal setups (like a double bottom pattern, trendline break , and so on...)
📚 Always follow your trading plan regarding entry, risk management, and trade management.
Good luck!
All Strategies Are Good; If Managed Properly!
~Rich

Litecoin H1 | Swing-low support at 61.8% Fibonacci retracementLitecoin is falling towards a swing-low support and could potentially bounce off this level to climb higher.
Buy entry is at 97.47 which is a swing-low support that aligns with the 61.8% Fibonacci retracement.
Stop loss is at 94.80 which is a level that lies underneath a multi-swing-low support and the 38.2% Fibonacci retracement.
Take profit is at 104.78 which is a multi-swing-high resistance.
High Risk Investment Warning
Trading Forex/CFDs on margin carries a high level of risk and may not be suitable for all investors. Leverage can work against you.
Stratos Markets Limited (tradu.com):
CFDs are complex instruments and come with a high risk of losing money rapidly due to leverage. 63% of retail investor accounts lose money when trading CFDs with this provider. You should consider whether you understand how CFDs work and whether you can afford to take the high risk of losing your money.
Stratos Europe Ltd (tradu.com):
CFDs are complex instruments and come with a high risk of losing money rapidly due to leverage. 63% of retail investor accounts lose money when trading CFDs with this provider. You should consider whether you understand how CFDs work and whether you can afford to take the high risk of losing your money.
Stratos Global LLC (tradu.com):
Losses can exceed deposits.
Please be advised that the information presented on TradingView is provided to Tradu (‘Company’, ‘we’) by a third-party provider (‘TFA Global Pte Ltd’). Please be reminded that you are solely responsible for the trading decisions on your account. There is a very high degree of risk involved in trading. Any information and/or content is intended entirely for research, educational and informational purposes only and does not constitute investment or consultation advice or investment strategy. The information is not tailored to the investment needs of any specific person and therefore does not involve a consideration of any of the investment objectives, financial situation or needs of any viewer that may receive it. Kindly also note that past performance is not a reliable indicator of future results. Actual results may differ materially from those anticipated in forward-looking or past performance statements. We assume no liability as to the accuracy or completeness of any of the information and/or content provided herein and the Company cannot be held responsible for any omission, mistake nor for any loss or damage including without limitation to any loss of profit which may arise from reliance on any information supplied by TFA Global Pte Ltd.
The speaker(s) is neither an employee, agent nor representative of Tradu and is therefore acting independently. The opinions given are their own, constitute general market commentary, and do not constitute the opinion or advice of Tradu or any form of personal or investment advice. Tradu neither endorses nor guarantees offerings of third-party speakers, nor is Tradu responsible for the content, veracity or opinions of third-party speakers, presenters or participants.

ETH is still Bullish!!Hello TradingView Family / Fellow Traders. This is Richard, also known as theSignalyst.
📈This week, ETH has been in a correction phase. However it is still overall bullish long-term trading within the rising channel marked in blue.
Moreover, the green zone is a strong demand and structure.
🏹 Thus, the highlighted blue circle is a strong area to look for buy setups as it is the intersection of structure and lower blue trendline acting non-horizontal support.
📚 As per my trading style:
As #ETH retests the blue circle zone, I will be looking for bullish reversal setups (like a double bottom pattern, trendline break , and so on...)
📚 Always follow your trading plan regarding entry, risk management, and trade management.
Good luck!
All Strategies Are Good; If Managed Properly!
~Rich

Aave Keeps Rising —Makes Sense? Aave bottomed 7-April, and now it keeps rising after just two days red. Aave hitting bottom 7-April means the same with Bitcoin and the rest of the Altcoins which means Bitcoin and the rest of the Altcoins will continue growing as well, makes sense?
Aave peaked in December 2024 same with the rest of the Altcoins market, they are all doing the same. The fact that Aave is bullish now and keeps rising reveals what is to come next, makes sense?
As soon as there is a small retrace people wait for the crash to come, ignoring the fact that we are already in the 2025 bull market and bull market simply means sustained growth. Makes sense?
The Altcoins will continue to reveal what will happen with Bitcoin before it does, it is inevitable, many people in the industry are in the know. When you see Bitcoin stop and you wonder what will happen next, just look around, look at the Altcoins market and the answer will reveal itself, makes sense?
Very easy. Whenever the market drops, see how far down the Altcoins go. If Bitcoin is set to drop you will know it because the Altcoins will start moving down much stronger and much faster than Bitcoin. If Bitcoin finds resistance and is set to move ahead, no retrace, you will have the proof coming from the rest of the market. Some smaller pairs will move ahead.
Thank you for reading.
Namaste.

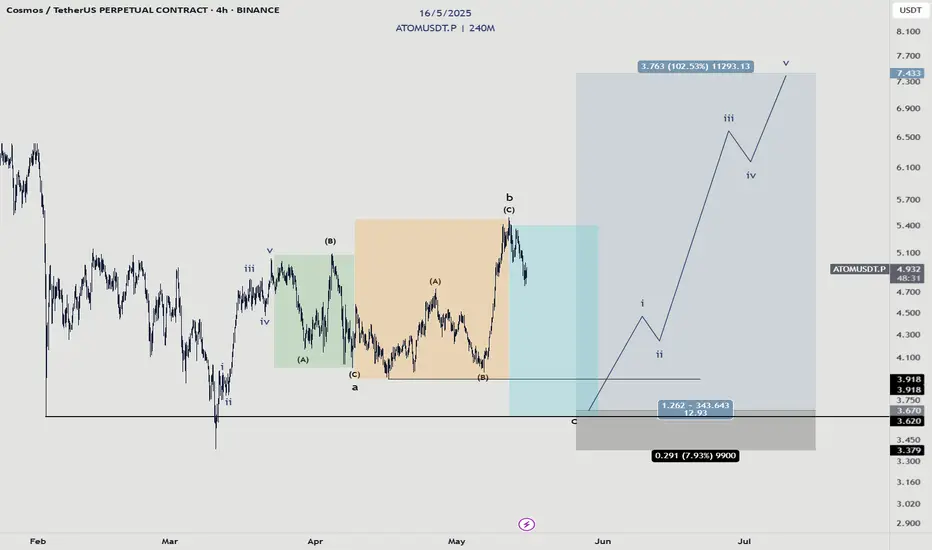
Cosmos - Manipulation?This idea is valid as long as the structure in the orange box maintains its three wave structure.
To prepare for a big run, it goes without saying that there must be some sort of accumulation and manipulation to occur.
In this case, I propose this expanded flat structure where we took the high out to kill the shorts and also trap buyers. Then, terminate that low to take out the buyers and trap sellers.. where we will enter a long into the big move.
Pendle New ATH, Resistance & Support —Highest Ever Within MonthsWatch the same price range alternate between resistance and support, the blue line/space on the chart.
There is also a long-term double-bottom and the Adam & Eve formation, all together in the same chart.
This paints a picture of a changing cycle. The recovery from the A&E is quite strong. From the 11-March low we have two long months of painful recovery, slow and steady growth. But PendleUSDT now trades above resistance/support.
The chart is self-explanatory, once on the bullish zone, PENDLEUSDT can grow. This is the situation now. Resistance was conquered 9-May. The proceeding days it was tested as support and holds.
We can expect some consolidation above this level and then boom! A strong advance hitting new highs. Pendle is set to hit its highest prices ever in 2025 and then some more. $11 and $16 are the main targets.
Thank you for reading.
Namaste.

EtherFi Governance Token & The 2025 Bull Market (PP: 1,111%)EtherFi is hot right now just as Ethereum is very hot. The project looks really good with great offerings, great products... Let's consider the chart. If you have a good product with a great chart, that's a combination for a massive 2025 bull market. You are bound to get numbers beyond this chart.
The long-term support and accumulation zone was lost in late February/early March. It was recovered again in May. The bottom was only available for two months. You are one of the lucky few if you decided to buy at bottom prices. Prices that will never become available again.
ETHFI is back above its August 2024 low, thus bullish; now trading with a bullish bias within its long-term accumulation zone. A price zone where we can buy, big, focusing on the long-term. A great chart, huge potential for growth, can't say it often enough.
There is really high volume here, the highest since launch date.
This high volume indicates and confirms that the bottom is in. If prices were to move back lower, trading volume the past two weeks would be much lower. Since prices are set to grow, volume is really high, the whales are loading up.
Not all is lost. It is still early because the last drop was a stop-loss hunt event. Notice the blue space on the chart, this is the standard buy zone. Here, in this range, ETHFIUSDT traded for more than 3 months in 2024.
A bull market can be expected now, a bullish trend.
Nice and easy, buy and hold; the market will take care of the rest.
This post is meant to alert you of a great entry timing and prices.
This is for spot traders. An easy buy. —Focused on the long-term.
Thank you for reading.
Namaste.

Bitcoin: $150,000, $180,000, $200,000 Or $220,000This is a question that nobody has been able to answer in the past 6 months: Will Bitcoin peak at $220,000 or $150,000?
Will the next All-Time High happen at $150-$160,000 or $180,000?
It is hard to say right now isn't it? But, consider this, if a new All-Time High will be hit within a few short weeks, or days, then there is plenty of room for Bitcoin to reach levels toward 200K. So maybe 150-160,000 is an easy target, it can go higher...
Now, it is true that we can guess and speculate about $250,000 or $220,000 or more, but there is no doubt that the next move is a rise, a strong rise, a continuation of the bullish move that started just a month ago. Five consecutive weeks closing green. As bullish as it gets.
Are you a SHORT trader?
You are about to be liquidated. There is till time, close your position now because Bitcoin is going up!
This is a friendly reminder.
Load up on the Altcoins.
Thanks a lot for your continued support.
Namaste.
