SUBSTRATUM: EARLY OPEN BETA = 19.85% PROFIT!!! IN 24 HOURS!!!Our "Crypto Bottom" Trade Indicator has correctly identified a buy in point on the 12th of May 2018 .
Using this buy in point and selling at today's price, you would have expected to net 27.13% PROFIT!!! IN 24 HOURS!!!
The increase in price may also be explained by positive developments including:
March 23: Successful test of private beta v0.2.0 Node on MacOS
April 11: Completion of private beta SubstratumNode tests on Linux, Mac and Windows OS
April 20: Notice of new version of Substratum v0.3.0 with a number of difference fixes and enhancements.
April 26: Substratum airs mini documentary on Fox Business to 60 million US homes. This is expected to increase publicity of the cryptocurrency.
April 27: Young and Investing (Youtube Personality) names Substratum as one of he "TOP 3 COINS TO WATCH IN MAY"
April 29: Altcoin Buzz (Youtube Personality) names Substratum as the the top cryptocurrency to ensure destabilise threats to net neutrality.
April 29: DataDash (Youtube Personality) names Substratum as one of the "TOP 3 COINS TO WATCH IN MAY"
(NEW) May 11: Korean Exchange Coinbit lists Substratum.
(NEW) May 11: WazirX (Indian cryptocurrency exchange) lists Substratum.
(NEW) May 11: Substratum announces new earning mechanism which allows users will be able to earn for ALL WEB TRAFFIC when running a Substratum Node.
(NEW) May 12: Suppoman (Youtube Personality) mentions he is bullish on Substratum and believes it is underpriced.
(NEW) May 12: Substratum has announces the release of the Substratum Node Early Open Beta.
(NEW) May 12: Bitbns (cryptocurrency exchange) announces deposits for Substratum deposits now active.
(NEW) May 12: Multiple reports from community of Substratum nodes functioning without isssues.
Substratum's increase in price is believed to be resulting from an broad based recovery experienced by the entire cryptocurrency market and the positive developments identified above especially with key social media influencers publicising Substratum as a solution to the Net Neutrality controversy and the release of the Substratum Node Early Open Beta.
Cryptocurrrency

BASIC ATTENTION TOKEN - 24 HOURS = 16.14% PROFIT!!!Our "Crypto Bottom" Trade Indicator has correctly identified a buy in point on the 11th of May 2018 .
Using this buy in point and selling at today's price, you would have expected to net 16.14% PROFIT!!! IN 24 HOURS!!!
The increase in price may also be explained by positive developments including:
February 24: HowToBasic (Youtube Personality with 10 million subscribers) becomes a verified creator with Brave.
February 24: and Bart Barker (Youtube Personality with 20 million subscribers) asks his audience to download Brave.
March 2: Basic Attention Token announces a million dollar referral program allowing Twitch streamers can earn revenue with the brave browser and BAT!
March 20: Basic Attention Token announces Batify extension for Google Chrome.
April 4: Brave for Android is nominated for a #webbys People's Voice award.
April 14: Brave hits 2 million Monthly Active Users and Distributes Million Dollar BAT Referral Program to Content Creators.
April 14: Brave added to all desktops at UC Berkeley, Open Computing Facility (OCF).
April 19: Announcement that the Basic Attention Token, the creators of the Brave Browser have secured a partnership with the Dow Jones Media Group (creators of the Wall Street Journal) to provide access of two years of free access to its Barrons.com website or to a premium MarketWatch newsletter. This is believed to change the online advertising landscape and one of the first validations of blockchain tech into online advertising.
April 19: It has also been reported today that Dow Jones Group has begun testing of Brave Software to replace it's reliance on online ads.
May 4: Brave announces partnership with Town Square Media to monetize ad-blocking traffic and test blockchain-based digital advertising.
May 12 : BAT/BRAVE Open New Office in London, UK; Presentations in Singapore and South Korea.
May 12: BAT nominated for Best Project in the Crypto Influencer Awards
Analysis reveals that a combination of these developments together a broader recovery in the broader cryptocurrency markets has led to increase in the price of Basic Attention Token.

LOOM NETWORK: LISTING ON BINANCE - 24 HOURS = 20.59% PROFIT!!!Our " Crypto Scalper" Trade Indicator has correctly identified a buy in point on the 7th of May 2018.
Using this buy in point and selling at today's price, you would have expected to net 20.59% PROFIT!!!
The increase in price may also be explained by positive developments including:
April 3: Loom Network SDK Alpha release
April 5: Loom Network is mentioned on Korean TV.
April 13: Plasma Cash is supported on Loom Network.
April 16: DelegateCall now has international support in Chinese, German, Korean and Japanese.
April 17: Pixie Shopping Street, one of the fastest growing game developers in Asia, joins Loom SDK to scale games using DAppChains.
April 20: "CryptoZombies Origins: What is Blockchain?" is released.
April 25: RadarRelay lists LOOM Token.
April 25: DelegateCall releases the following upgrades: Notifications, Email Digests, New Transfer Gateway
April 27: A month ago, we announced that CryptoZombies is hard forking to become the second Loom Network DAppChain, and that those who completed lessons before the cutoff date of April 20th would receive some pretty sweet rewards in the form of ERC20 / ERC721 tokens.
April 30: Loom Network will be sponsoring GopherCon Singapore, one of the largest conferences for Golang developers.
May 2: Binance lists LOOM Token.
May 3: Withdrawal Fee for LOOM Token Reduced.
(NEW) May 8: 2nd Loom SDK Project Announced: Neon District, a Blockchain-Based Cyberpunk RPG.
The new exchange listings combined the announcement of the new Neon District RPG explains the increase in price.

POLYMATH NETWORK: CRYPTO BOTTOM SIGNAL = 66.83% PROFIT!!!Our "Crypto Bottom" Trade Signal has correctly identified a buy in point on the 22nd of April 2018 .
Using this buy in point and selling at today's price, you would have expected to net 69.11% PROFIT!!!
The increase in price may also be explained by positive developments including:
February 14: Polymath Network gets listed on Kucoin cryptocurrency exchange.
April 7: Polymath release an update to it's core codenamed "Toro".
April 9: Polymath Network gets listed on Bittrex cryptocurrency exchange.
April 20: Polymath and Trustroot Partner on Verification Service for Security Token Offerings
April 21: Polymath is pleased to welcome our newest advisor, Michael Hyatt. Michael is also a weekly business commentator on CBC and was a celebrated “Dragon” on CBC’s online Dragons’ Den.
April 25: Polymath joins the Blockchain Research Institute along with Aion, Decentral, and Salesforce. Blockchain Research Institute is a multi-million dollar global research initiative undertaking the definitive investigation of blockchain strategies, opportunities, and implementation challenges. Other new members include Navigator Limited, the first public relations firm to join the institute, and brand management agency VIKTRE.
April 26: Polymath and CrowdfundX, a company focused on AI-powered digital marketing, have agreed to pursue a collaboration to offer CrowdfundX’s digital marketing services to security token issuers on the Polymath platform.
April 27: Polymath released guide to launch A Security Token via Polymath.
The positive news combined with the uptrend in prices from the general crypto markets can explain the increase in price.

0x: NEW DEVELOPMENTS - PROFIT = 36.43% !!!Our "Crypto Scalper" Trade Indicator has correctly identified a buy in point on the 1nd of May 2018.
Using this buy in point and selling at today's price, you would have expected to net 36.43% PROFIT!!!
The increase in price may also be explained by positive developments including:
Feb 7: OpenFinance complets the world’s first ever fully compliant security token trade via the 0xProject protocol!
March 24: 0x announces 0x Trade Widget (allows users to instantly buy Ethereum tokens with 0x protocol).
April 5: 0x announces 0x Protocol v2.
April 6: 0x tokens are ablet to be traded ion Abra wallets.
April 19: 0x announces that its protocol enables Compliant peer-to-peer trading allowing for widespread DEX adoption (by meeting KYC and AML 2.71% requirements).
April 26: 0x announces the Bloqboard, the first live Dharma Debt Relayer is launched.
April 26: 0x announces SharkRelay was released live on it mainnet.
April 27: 0x announces Short selling and leveraged long trading coming to decentralized exchanges soon via dydxprotocol
May 2: Radar Relay (facilitates wallet-to-wallet trading using an open order book) using the 0x protocol facilitates $100 million worth of volume during their beta period.
May 2: Rumours released that 0x will be released on Coinbase.
(NEW) May 3: Bambo Relay is released. It is a ERC20 relayer that is built on the 0x protocol. It has the following features:
- Trade directly from your Ledger Wallet
- Night and day mode for the UI
- Trollbox
- The ability to trade any ERC20 compatible token
- Standard Relayer API endpoints
- Free trades during the beta
(NEW) May 3: Radar Relay (which uses the 0x token) is available in Chinese and Korea.
The general uptrend in the crypto markets as well as the positive developments above have caused an increase in demand for the 0x token which have forced up prices.

LOOM NETWORK: LISTING ON BINANCE - 24 HOURS = 43.01% PROFIT!!!Our "Crypto Scalper" Trade Indicator has correctly identified a buy in point on the 3rd of May 2018.
Using this buy in point and selling at today's price, you would have expected to net 43.01% PROFIT!!! IN 24 HOURS.
The increase in price may also be explained by positive developments including:
April 3: Loom Network SDK Alpha release
April 5: Loom Network is mentioned on Korean TV.
April 13: Plasma Cash is supported on Loom Network.
April 16: DelegateCall now has international support in Chinese, German, Korean and Japanese.
April 17: Pixie Shopping Street, one of the fastest growing game developers in Asia, joins Loom SDK to scale games using DAppChains.
April 20: "CryptoZombies Origins: What is Blockchain?" is released.
April 25: RadarRelay lists LOOM Token.
April 25: DelegateCall releases the following upgrades: Notifications, Email Digests, New Transfer Gateway
April 27: A month ago, we announced that CryptoZombies is hard forking to become the second Loom Network DAppChain, and that those who completed lessons before the cutoff date of April 20th would receive some pretty sweet rewards in the form of ERC20 / ERC721 tokens.
April 30: Loom Network will be sponsoring GopherCon Singapore, one of the largest conferences for Golang developers.
May 2: Binance lists LOOM Token.
May 3: Withdrawal Fee for LOOM Token Reduced.
The new exchange listings combined with the uptrend in prices from the general crypto markets can explain the increase in price.

Tale of Two FractalsICOs to be evaluated on Monday May 7th. Any decision the SEC makes will be critical in determining the future of bitcoin and other cryptocurrencies. The printed fractals are both from 2013. The RED means we're in the April bubble. the BLUE means we're in the November bubble. I'm bearish @ 13-14K until proven otherwise. Stay neutral until we determine sentiment post-ICO eval.

EOS Machine Learning 3-Day Crypto SignalThe rolling three-day signal for EOS (EOS) is "Buy". This is day ONE of the three-day signal. The signal will be updated and shared again on Sunday. For further details or discussion, feel free to leave any questions or check out signature/profile.

$BTC - Next stop 9.7k then 11.2k - We movin up degens$BTC looking bullish. Bullish hidden divergence on the 6HR.
In a confirmed bull pennant after breaking a major downtrend resistance.
Held VPVR support beautifully.
If someone says their bearish on $BTC, kindly ask them to drink vinegar.

EOS Machine Learning 3-Day Crypto SignalThe rolling three-day signal for EOS (EOS) is "Buy". This is day two of the three-day signal. The signal will be updated and shared again on Thursday. For further details or discussion, feel free to leave any questions or check out signature/profile.

Cardano Machine Learning 3-Day Crypto SignalThe rolling three-day signal for Cardano (ADA) is "Buy". This is day two of the three-day signal. The signal will be updated and shared again on Thursday. For further details or discussion, feel free to leave any questions or check out signature/profile.

ETHUSD Long Entry- Retest of Demand area with volume at the FibA quick retracement after profit taking by the bulls. Successful tested the demand area at 530 with good stopping volume at the the 61.8% (38.2%) Fib level. Buyers are present! This gives a target of 833 which lines up with the supply area at this handle. Technically obedient which is nice to see.

shitty bitcoin trend analysisbasic trend lines & technical analysis make me think we're not gonna go parabolic again anytime soon; google trends shows how often people are googling "bitcoin" or "buy bitcoin" and only when we get another wave of interest do i think we'll get another mind boggling bull run.
obviously fundamentally 1 BTC = 1 bugatti in the long run
but i still think we're gonna be accumulating around 6k before we take off again

ETH CORRECTION SOON??IF you have been following my charts you know that i have a wave 3 target in the 650 range which still stands as of now but im keeping a close eye on it as the RSI on the 6 hour time frame is showing overbought but the MACD is still showing bullish. If this goes past the 1:1 fib range we could see a shoot up to the 1.618 fib region which would be around 720. If we start to see a correction then im thinking with the bullish trend we should correct to the .618 or possibly .5 area for a heavier correction so the 575-550 range. It looks like the bulls are really starting to charge here but its good to have some targets and stay open to some different possible outcomes. These are just my opinion based off of technical indicators and my perception of them. Good luck to everyone and have an awesome weekend. GO GAINS!!!!

Bitcoin At The Crossroads! What Happens Next?
Well actually your guess is as good as mine.... Love seeing this long, multi-month downtrend being broken to the upside. The fact that we haven't been smacked down back into the bearish channel is definitely good news for the price. Finally on the chart we can draw another long term trend line that BTC is meeting right now and is hugging pretty closely. I think this is something to be watched and a break above this line that dates back to July of 2017 would be "hella good news" to say the least. In fact, it would be fine to even see it head up slowly and continue to hug this line, build a base and then launch out above it (hopefully with some decent volume to confirm the move). The RSI is pretty darn good shape and we have lots of room to run around if we do see higher prices.
The old "Random Number Generator" is in pretty good shape also. We're sitting with a green 1 on the candle that just formed and this sets us up for potentially 8 more days of upside. Sunday we got the 9 sell signal and a break above $8,350 should launch us much higher into the weekend. A close below $8,273 on this chart would not be great and most likely means we need to sit around these levels a while longer before any major price advances.
The sentiment is now pretty much "overwhelmingly bullish." Just look on Twitter at all the alt coiners talking about the bear market being over. We are definitely still in a bear market and bearish environment. The prices have been decimated over the past 5 months or so.
The job of a bear market rally is to get everyone feeling good.... get everyone feeling secure.... get everyone in.... AND THEN BURY YOU SOON AFTER. Hopefully that's not the case here

XRPUSD bullish breakout 4HR
First time i show my enter at xrpusd
on the pullback it was a really good enter point
the next target is 0.82-0.84$
i enter the trade at 0.63$
my strategy is to swing this trade now, Stop-loss is already in profit

Digibyte 4 Hour Chart. BreakoutDigibyte is at a crucial breakout point on the 4 hour chart. This saucer formation started on March 12th and we're finally testing these levels today. A move out above this resistance point here should have some legs to get the price to the 3.5 cent level before pausing to at least digest the move. The RSI is flirting with overbought territory so that may delay the upside move but then again, anything can happen. The MACD did have a bearish cross a few hours ago but nothing that can't be reversed quickly.
I have to say, this DGBUSD chart does look bullish and while nobody knows how far this goes, the characteristics for higher prices are showing up in the chart.
BITTREX:DGBUSD

RLC - On it's ass with a tiny MC, what more do you plebs want?Chart says it all. Based 50m MC coin. What more do you plebs want?

ETH Broke the Daily Lower High, BTC did NOTAnother good example of the importance of the BTC correlation.
We saw a strong bull break on ETH and push to higher highs, but we cannot put too much faith in the bulls, as BTC did not break bullish.
Now we have a bearish dump on BTC which is ending up looking like a big time fake out on ETH,
if you are not aware of the importance of BTC correlation.
This bull spike before the drop will have me pay more attention to the ETH bulls if we do eventually see BTC break the daily equilibrium bullish.
Otherwise I would be ignoring the break of the daily lower highs for anyone but BTC.

GAS on the RiseGas has had quite a few periods respective the 30 day EMA. Now that the EMA's are crossing and the symmetrical triangle is formed. Expect a nice gain from GAS. Purchase around 255 SATs if possible and set stop losses accordingly.

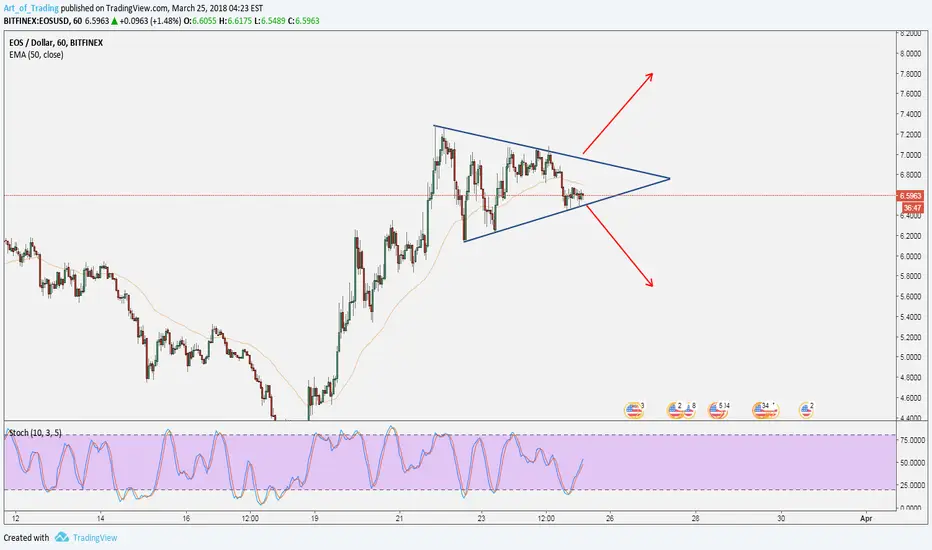
EOS - Triangle BreakoutThe EOS formed a symmetrical triangle on H1 chart. It is a type of consolidation, where none of the market participants (buyers and sellers) controls the price. However, it is getting close to the point where the breakout is expected. The best approach here is to wait for a valid breakout (strong confirmation bar) and then place an order.
Steem Price MovementSteem has been on a roller coaster since it's release. It's seemed to have formed a nice symmetrical triangle which is a nice but signal for short term gains.
If the candles remain tight over the next day, expect a nice pump in the price coming up to previous resistance levels. Potential for nice short term 10% gains, with a 4-5% stop loss to prevent against FUD.

BLZ Price MovementToken is relatively new and seems to be going on a nice rise. Expect a slight correction to come. If the coin stays within the range drawn, expect a nice pump up early April, testing higher resistance levels.
