$100K Bitcoin Within Days » Top Altcoins Choice —Your Pick (S5)Bitcoin is now bullish confirmed with a break above $97,000. Today Bitcoin trades at the highest price since late February 2025, and it is set to continue growing and growing aiming next at a break and challenge of 100K.
As soon as 100K is conquered, the Altcoins will go wild.
Which pair is your favorite Altcoin right now?
Let's start Session 5 of Your Top Altcoin Choice.
» Leave a comment with your preferred Altcoin trading pair and I will reply to your comment with a full analysis.
» We will do one pair per user/commentator.
Feel free to ask any questions.
Bitcoin is bullish now and set to grow long-term. The next All-Time High can happen around $160,000 just as it can be $180,000 or $250,000. Patience is key.
Thanks a lot for your continued support.
Namaste.
Cryptomarket

TradeCityPro | Bitcoin Daily Analysis #80👋 Welcome to TradeCity Pro!
Let’s dive into the Bitcoin analysis and key crypto market indicators. As usual, I’ll review the triggers for the New York futures session.
⏳ 1-Hour Timeframe
Yesterday, price made a bullish move and broke the 97139 zone, but later it turned out to be a fake breakout, and now it’s moving downward.
🔍 It’s likely that this downward move is just a pullback toward the SMA99 zone, and price may bounce back up afterward. If SMA99 breaks, deeper corrections down to 95370 are possible.
✔️ In my view, as long as price stays above the 95370 zone, Bitcoin remains in an uptrend. Only once price drops below this level can we start identifying potential bearish triggers.
📈 For now, we need to wait for more structure to develop before entering any positions. The 97139 level still remains a strong bullish trigger, but it’s best to wait for a reaction to it first so we can pinpoint the exact line, and then enter upon its breakout.
⚡️ Nothing more to add about Bitcoin for now — it’s Saturday, a weekend, and the chances of ranging price action are high.
👑 BTC.D Analysis
Looking at BTC dominance, yesterday it made a slight corrective move and pulled back to 64.77, where it seems to have found support.
📊 The next bullish trigger is the breakout of 64.91. Overall, the trend is still bullish, so if you're considering multi-day or swing positions, Bitcoin remains a better choice than altcoins.
📅 Total2 Analysis
Turning to the Total2 chart, this index was rejected from the 1.05 resistance once again yesterday and failed to hold above it. Until that changes, altcoins likely won’t see any significant upward momentum.
🔑 For downside movement in Total2, the trigger remains a break below 1.03.
📅 USDT.D Analysis
Now to Tether dominance — yesterday, this index finally closed a candle below the 4.99 level, but it was a fakeout, and it moved back above, once again preventing the broader market from turning bullish. This fakeout could inject bearish momentum into the market, potentially leading to deeper corrections.
⭐ For now, the 4.99 level still serves as a strong trigger for a bearish USDT dominance and thus a bullish signal for the market. A break above 5.10, however, would be a solid trigger for USDT dominance to trend higher.
❌ Disclaimer ❌
Trading futures is highly risky and dangerous. If you're not an expert, these triggers may not be suitable for you. You should first learn risk and capital management. You can also use the educational content from this channel.
Finally, these triggers reflect my personal opinions on price action, and the market may move completely against this analysis. So, do your own research before opening any position.

TradeCityPro | LDO: Watching for Breakout in DeFi Leader’s Range👋 Welcome to TradeCity Pro!
In this analysis, I’m going to review the LDO coin — one of the well-known DeFi projects within the Ethereum ecosystem with a significantly high TVL.
✔️ This project’s token currently has a market cap of $748 million, placing it at rank 86 on CoinMarketCap.
⏳ 4-Hour Timeframe
As you can see on the 4-hour chart, after a downtrend, LDO formed a bottom around the 0.676 zone and managed to rally up to 0.868.
🔍 Currently, the price is consolidating below that resistance in a ranging box. A breakout from either direction of the box could determine the next trend.
⭐ If the box breaks upward and the 0.868 level is breached, we can consider the prior downtrend over, and the price would be forming a new bullish structure. However, there is another resistance at 0.904 right above, and there’s a possibility of rejection from that level after the 0.868 breakout.
📈 For a long position, I personally plan to enter upon the breakout of 0.868. While it’s possible that the price might reverse from 0.904, I prefer having an earlier entry and using a more accessible trigger.
🔽 On the other hand, if the box breaks to the downside, the price might revisit the 0.676 support and potentially start a new bearish leg in line with the longer-term downtrend.
📉 The first short trigger is the break of 0.818 (the lower boundary of the box), but there’s another minor support at 0.795, which may cause a bounce.
👀 I personally prefer to wait for the 0.795 level to break for a short entry, given that market momentum is currently bullish, and I prefer a more reliable trigger for shorts.
📊 Volume within this range has been decreasing, which is normal in such consolidation phases. The longer the price stays in this range, the lower the volume tends to be — and typically, a breakout will lead to a sharper move.
The RSI oscillator also has a support zone at 43.17. If this level is broken, it could signal incoming bearish momentum and increase the probability of a downside breakout.
📝 Final Thoughts
This analysis reflects our opinions and is not financial advice.
Share your thoughts in the comments, and don’t forget to share this analysis with your friends! ❤️


BANANAUSDT Analysis D1BANANAUSDT Descending Trendline Has Already Got Cleared, Banana Can Give Solid Bullish Rally In Coming Days .

FILUSDT Analysis D1FILUSDT Looks Bullish So Far Falling Wedge Breakout, Retest Done, Horizontal Resistance Breakout, Retest Done, Another Trendline Breakout, Retest Done So Whats Next? In My Point Of View Rally Towards 5$ .

ETCUSDT Analysis D1ETCUSDT Trendline Breakout & Retest Has Already Confirmed, Currently Consolidating Within Bullish Pennant Once Pennant Got Cleared, Etc Can Lead Solid Recovery Towards 30-35$ In Coming Days .

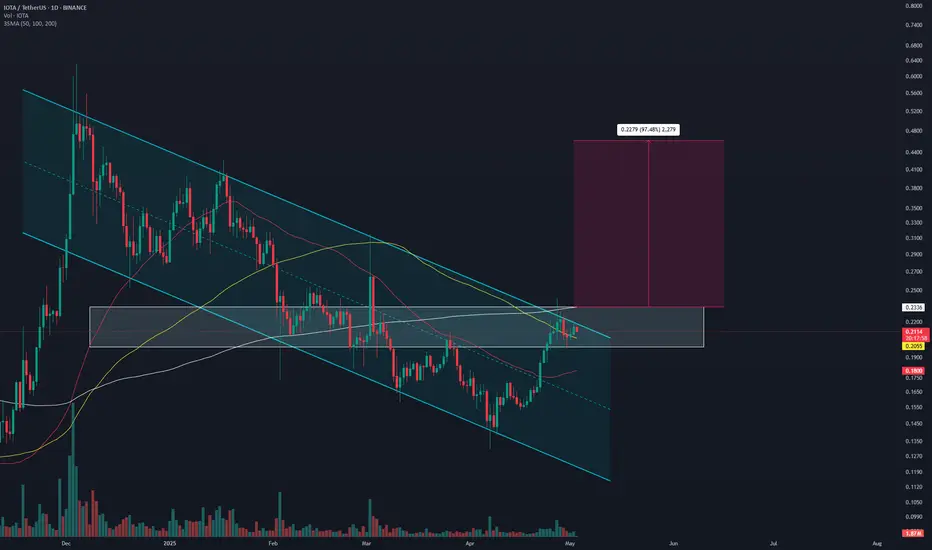
IOTAUSDT Analysis D1IOTAUSDT Seems Like Ready For Strong Bullish Rally, Breakout And Retest Has Already Confirmed, Expecting 2x In Coming Days .
Chainlink Market View - on 03/May/2025Price need to retest on FVG1 or FVG2 , before it break OB and visit the Equal High (17$).
#chainlink

$BTC is on track for a 100% Move Up: Looking at the Weekly!Let's keep it SIMPLE!!!!!
Bitcoin ( CRYPTOCAP:BTC ) has been on an absolute tear lately. After finding a solid base around $74,000, we’ve now broken out and are trading around $96,000—a move that’s caught the attention of everyone from retail traders to institutions.
But could we be on the road to $150,000 BTC?
Let’s break it down simply using the weekly chart, a couple key resistance levels, and the Relative Strength Index (RSI)—a key momentum indicator that often reveals where the smart money is going.
📈 The Weekly Momentum Is Strong
The weekly RSI is currently trending upward and approaching the 70 zone, which is often considered the “overbought” area. But here’s the key: In a strong bull market, RSI staying above 70 is not a warning sign—it's a sign of strength.
We saw this behavior during the 2017 and 2021 bull runs. RSI hovered in overbought territory for weeks, even months, as Bitcoin pushed higher and higher. We're starting to see that same pattern now. The momentum is building, and buyers are in control.
🔓 Key Resistance Levels Being Broken
When Bitcoin was at $74K, we had a few major resistance zones ahead:
$80K – psychological barrier and minor rejection point
FWB:88K –$90K – prior consolidation area and liquidity zone
$100K – major psychological milestone that will bring massive attention
So far, Bitcoin has smashed through $80K and is holding above $90K, showing buyers are stepping in on every dip. Once we confidently break and hold above $100K, the road toward $120K and $150K opens up fast.
💡 Why $150K Is in Sight
This isn’t just about technicals—there’s also a strong macro and sentiment shift at play:
Institutional interest is increasing
ETF flows remain positive
Supply on exchanges is dropping
Halving narrative is still fueling demand
Momentum indicators are still not overheated
Technically, when price breaks into price discovery, it tends to overshoot to the upside—especially if momentum like RSI stays strong.
🧠 Final Thoughts
Bitcoin has already climbed from $74K to $96K, and the weekly chart suggests this could just be the beginning of the next leg up. If RSI continues climbing and price breaks above $100K cleanly, the $120K to $150K zone becomes a realistic next stop.
Stay patient, zoom out, and follow the trend. The momentum is real—and so is the opportunity.

TradeCityPro | Bitcoin Daily Analysis #79👋 Welcome to TradeCity Pro!
Let’s dive into Bitcoin and key crypto index analysis. As usual, in this analysis, I’ll walk you through the futures session triggers for the New York session.
⏳ 1-Hour Timeframe
On the 1-hour timeframe, as you can see, yesterday the price stabilized above the 95370 zone and continued its movement up to 97139.
✔️ The reason the price couldn’t move higher is that the RSI failed to stay above the 70 level and didn’t enter the Overbuy zone — it got rejected there. As a result, the price also got rejected from the 97139 resistance and is currently in a corrective phase.
🧩 The SMA25 indicator has now caught up to the price, and this could bring upward momentum into the market. If that happens, the price might resume its upward move, and breaking the 97139 high could lead to a continuation toward the 98828 zone.
📊 Volume increased during the bullish candles, but after reaching the 97139 high, volume returned to previous levels, and the price has been ranging.
⚡️ Today, if RSI enters the Overbuy zone, a bullish move is very likely — in that case, I recommend definitely holding a long position.
🔽 As for short positions and bearish sentiment on Bitcoin, as I’ve been saying for a while, we should wait for a proper trend reversal before entering short trades.
📈 If the price doesn’t respond to the SMA25 and keeps ranging, the next parameter that could drive bullish momentum is the SMA99.
👑 BTC.D Analysis
Moving to Bitcoin Dominance — BTC.D is still trending upward. Yesterday, after breaking the 64.72 ceiling, it started a new bullish leg, and so far, there’s no sign of trend weakness.
🎲 I suggest waiting for a new structure to form. For now, it’s still rising, and if this continues, Bitcoin will likely outperform altcoins.
📅 Total2 Analysis
Looking at Total2, this index was rejected from the 1.05 resistance yesterday. The reason is that Bitcoin dominance surged, meaning not much money flowed into altcoins, and Total2 couldn’t break its ceiling.
🔼 If BTC.D reverses and pulls back, a lot of capital could move into altcoins — in that case, we can consider opening long positions on altcoins.
📅 USDT.D Analysis
Now to Tether Dominance — another reason Bitcoin couldn’t extend its bullish leg yesterday was this indicator. Support at 4.99 held, preventing money from entering the market, and causing the correction phase.
💫 Currently, the 4.99 level remains a crucial trigger. If it breaks, the main bullish trend in the market could begin. On the other hand, a break above 5.10 would likely push the market into a deeper correction.
❌ Disclaimer ❌
Trading futures is highly risky and dangerous. If you're not an expert, these triggers may not be suitable for you. You should first learn risk and capital management. You can also use the educational content from this channel.
Finally, these triggers reflect my personal opinions on price action, and the market may move completely against this analysis. So, do your own research before opening any position.

SUI/USDT Long Entry at 3.507 (10x Leverage) | Strategy in PlayEntered a long position on CRYPTOCAP:SUI at 3.507 with 10x leverage. Current price action is hovering near entry. Watching key levels:
🔹 Target Zone: 3.8760+
🔻 Support Zone: ~3.25 (highlighted for potential SL zone)
🧠 TP (Take Profit) and SL (Stop Loss) will be updated as the move develops.
Keep an eye on price reaction around the support-resistance flip zone.

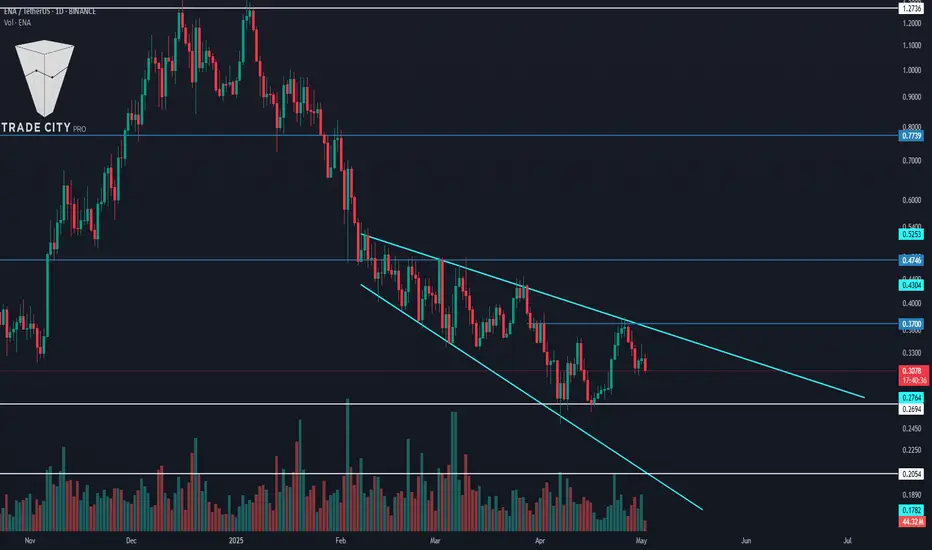
TradeCityPro | ENA: Expansion Pattern Near Critical Break Levels👋 Welcome to TradeCity Pro!
In this analysis, I want to review the ENA coin for you. The Ethena project is one of the DeFi projects in crypto that has attracted a lot of hype in this category.
💥 ENA coin, with a market cap of $1.7 billion, ranks 50th on CoinMarketCap.
📅 Daily Timeframe
As you can see on the daily chart, there is an Expanding Triangle, and the price is fluctuating within this pattern.
📚 One key characteristic of an Expanding Triangle is that while the price is within the triangle, it tends not to respect static levels such as supports and resistances. Currently, the price is within the triangle and, as you can see, it doesn’t respond significantly to static zones.
📈 For this coin to become bullish, the triangle must break to the upside and the triangle trigger at 0.37 should be activated. In that case, the price can move upward and begin a bullish trend. Full confirmation of the bullish reversal will come with price stabilization above 0.4746.
✔️ For continued downward movement, the first trigger is the break of 0.2694. If you already hold this coin, you can use this level as a stop-loss — and once the price closes below it, you can trigger your stop-loss.
📊 For short positions, the break of 0.2694 is a valid trigger, but the issue is that it activates before the triangle breaks, and I personally prefer not to open a position within an Expanding Triangle — I’d rather wait and enter after it breaks.
🔽 Another trigger for a bearish move is the break of 0.2054. This is the main support for ENA, and if it breaks, the price will register a new All-Time Low.
📝 Final Thoughts
This analysis reflects our opinions and is not financial advice.
Share your thoughts in the comments, and don’t forget to share this analysis with your friends! ❤️
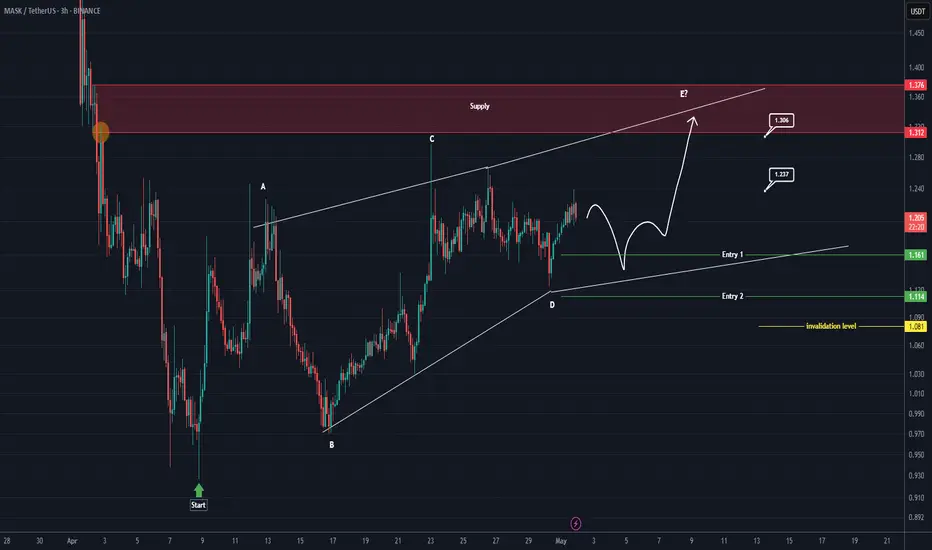
MASK Looks Bullish (3H)Since we placed the red flash on the chart, it seems that the bullish phase of MASK has started. This phase appears to be either a diametric or a symmetrical pattern. We are currently in the middle of wave D. After wave D completes, the price could enter a bullish wave E.
We can look for buy/long setups at the entry points.
The targets are indicated on the chart.
A 4-hour candle closing below the invalidation level will invalidate this analysis.
For risk management, please don't forget stop loss and capital management
When we reach the first target, save some profit and then change the stop to entry
Comment if you have any questions
Thank You
Crypto Total Market Cap. Simple Signals (New All-Time High Soon)On April 22 TOTAL moved above its 3-Feb. low after trading below this level for some 50 days. Moving above this low is a major bullish development. A very strong yet simple signal.
On April 22 TOTAL moved above and two days later, on the 24, this level was tested as support and holds. The session ended with long lower wick.
The candle 30-April produced a higher low compared to 3-Feb. and this is a major bullish signal. This one here reveals that TOTAL is set to challenge the next major resistance point. This is all happening with a very strong RSI.
The strong RSI is another simple signal and cannot be denied. TOTAL is now moving towards a new All-Time High, and this ATH will happen very soon, likely mid-term (within 3 months).
The next resistance after the advance that will happen in the coming days will happen around 3.25T. This is a mild resistance and should break after some bullish pressure. This will be followed by a challenge of the previous ATH as resistance. It will be pierced right away through a wick and then a new price discovery session will develop.
» The entire Cryptocurrency market is bullish right now and set to grow. The grow is already happening since early April.
Thanks a lot for your continued support.
Namaste.

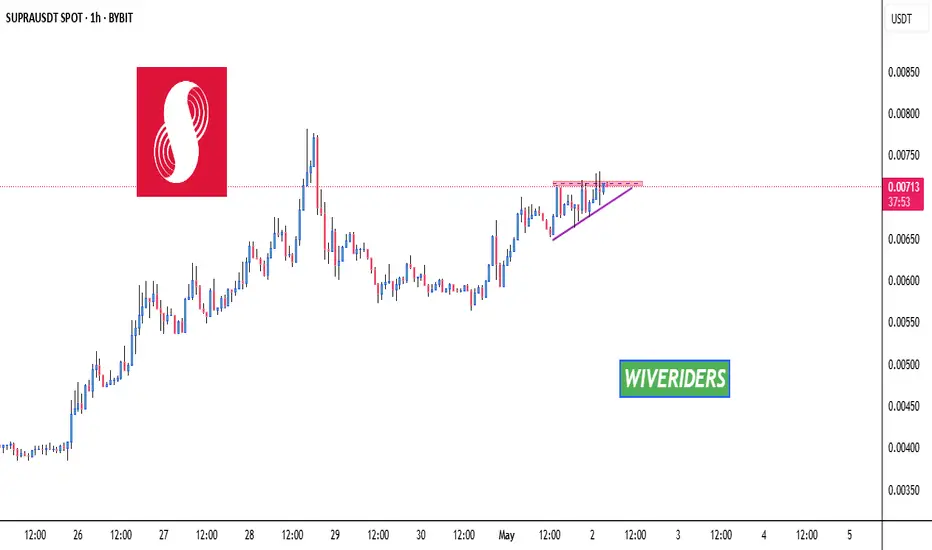
SUPRA is forming an ascending triangle patternSUPRA is forming an ascending triangle pattern and is approaching a key red resistance zone. A breakout above this level could confirm the bullish pattern and signal a strong upward move.
📈 Technical Overview:
Pattern: Ascending Triangle
Resistance Zone: Red area currently being tested.
🎯 Breakout Target: To be determined upon confirmation of the breakout.
USD/JPY Bullish Setup with Ascending Trend line This is a 2-hour chart of USD/JPY showing a bullish setup. The price is currently respecting an ascending support trend line, indicating potential upward momentum. There are two marked resistance levels: the first target around 144 . and the second target near the 146.00– 146.50 zone . The chart suggests a bullish continuation if the price breaks above the first target zone, with the second target acting as a stronger resistance area. Ichimoku cloud support below the price also reinforces the bullish bias.

Forming Potential Cup and Handle Pattern🚨 $HIFI
Forming Potential Cup and Handle Pattern 🚨
$HIFI
is forming a potential cup and handle pattern. For this bullish pattern to be confirmed, the price needs to break out above the red resistance zone.
📈 Technical Overview:
Pattern: Potential Cup and Handle
Resistance Zone: Red area currently being tested.

NAVX has formed a cup and handle pattern NAVX has formed a cup and handle pattern and is now waiting for a breakout above the red resistance zone. If the price successfully breaks out, the target will be the green line level.
📈 Technical Overview:
Pattern: Cup and Handle
Resistance Zone: Red area currently being tested.
🎯 Breakout Target: Green line level upon confirmation.

Bitcoin 1-Hour Chart: Quick Market BreakdownBTC is trading within a well-defined ascending channel, with the price currently at $97,400, after breakout and retest of weekly high resistance around $95,800. The channel’s upper boundary projects a potential target of $104,000 if BTC continues to move upward over the week!
Key resistance levels to watch are $98,000 and $100,000, while support lies at $96,200 and the channel’s lower boundary at $95,000.
A breakout above $100,000 could ignite a rally toward $104,000, but if BTC fails to hold support at $96,000, we might see a dip back to $94,400-93,000.
Key Levels to Watch:
Resistance: $100,000, $98,000
Support: $96,000, $94,000
Breakout Target: $104,000+
Breakdown Risk: $93,000
Will BTC soar to new heights, or are we in for a pullback? Let’s hear your thoughts below!

Brief BITCOIN Weekly synopsis - BULLISH sign everywhere
BLUE DASHED LINE = Current ATH
Bitcoin did Drop below the lower trendline of the ascending channel it has been in since Jan 2023 but it made a sustained recovery since that moment and continues to climb as sentiment returns.
One of the main resons for this, as I have repeatably mentioned, is the Weekly MACD.
This bounced a little Earlier than expected, possibly due to falling out of the channel and the Bulls stepping in to pull it back.
But as you can see, We have yet to cross over the Signal line and so, Yes, the possibility of this being a bull Trap does exist but I am not inclined to believe this.
We have had 4 weeks of recovering Histogram, showing Strength behind the move.
The RSI is also Bullish having just crossed above its own MA ( Moving Average )
This turned Bullish while still around 44, so NOT oversold by any means but still with plenty of Room to climb higher. Again, Signs of a sustained Rise are in play
There are some Stiff lines of resistance above and we will start encountering them from 98K usd ( very soon ) and will remain till around 112K usd
These are IMMINENT
For me, we may not make it first time out but one VERY Bullish thing is that we did bounce of the 50 SMA once again
50 SMA RED - 100 Blur - 200 Yellow
On the chart shown here, that rising trendline is around 112K
The Green area to the right is a projected ATH zon. PA should rise above this to reach cycle ATH
Should PA get rejected off the overhead resistance and fall back lower, the 60 SMA sits around 85K
I would be amazed if that happens BUT anything is possible and we wait to see how Strong MAY is going to be.
Over all, the next 7 Months WILL be memorable.


TradeCityPro | Bitcoin Daily Analysis #78👋 Welcome to TradeCity Pro!
Let’s get into the analysis of Bitcoin and key crypto indices. As usual, in this analysis I’ll review the triggers for the New York futures session.
⏳ 1-Hour Timeframe
As you can see in the 1-hour timeframe, Bitcoin is finally stabilizing above the 95,370 level. If this movement continues and the price stays above this level, the likelihood of a move up to 98,828 increases.
✔️ Over the past few days, I’ve strongly emphasized that you should open a position once 95,370 breaks. I hope you did, because that entry point was very significant, and breaking it could mark the beginning of Bitcoin’s next bullish leg.
💥 Currently, RSI is entering the Overbought zone, and if that happens, the chances of a sharp upward move increase. Buying volume is also rising, which is expected when a resistance level is broken.
📊 At the moment, opening new positions doesn't make much sense. If you already have an open position, I recommend riding the market momentum and taking profits whenever you notice momentum fading.
👑 BTC.D Analysis
Bitcoin dominance dropped slightly yesterday and returned below the 64.60 level. If this level is broken again, we can reconfirm the bullish sentiment.
🧩 If dominance gets rejected from the 64.60 ceiling, it’s likely to drop back down to the 64.22 support level.
📅 Total2 Analysis
Let’s look at Total2. Yesterday we saw a downward correction that extended to the 1.00 level. If you recall, I previously said I wouldn’t consider a trend reversal confirmed just from the 1.03 break — I’d wait for a break of the 1.00 support.
🔑 That’s why I didn’t close any of my positions at 1.03 and instead waited to see how the price would react at 1.00. As shown, the price reacted strongly at that level and quickly returned above 1.03.
✨ If the 1.05 level breaks, altcoins — just like Bitcoin — could begin a new bullish leg.
📅 USDT.D Analysis
Now let’s look at USDT dominance. Yesterday, it made a bullish move and broke above the 5.10 level, but the entire move turned out to be a fakeout, and the price dropped back below 5.10.
⭐ Currently, dominance is heading toward the 4.99 support. The main trigger for a bullish market shift is the break of this 4.99 level in Tether dominance. If this happens, altcoins will likely begin their bullish moves.
❌ Disclaimer ❌
Trading futures is highly risky and dangerous. If you're not an expert, these triggers may not be suitable for you. You should first learn risk and capital management. You can also use the educational content from this channel.
Finally, these triggers reflect my personal opinions on price action, and the market may move completely against this analysis. So, do your own research before opening any position.
