ETHUSDT eth has clear skies up to 2966$ if it closes above this 15 min order block(which will turn into a breaker block). also ETH just tapped the 50% on daily BOS .
Cryptos

Correction in progress but soon very interesting...Enjin is a software that gives developers the ability to create and manage virtual goods on the Ethereum blockchain. The idea is that by using blockchain technology to manage in-game items across many different properties, Enjin can help reduce the high fees and fraud that have plagued the transfer of virtual in-game goods and collectables. Toward that goal, Enjin has released software development kits (SDKs) allowing users to both create digital assets on Ethereum and integrate them into games and apps. Each minted asset is customizable to fit the desired platform and recorded in a smart contract, giving the items the advantages of cryptocurrency, namely speed, cost and security. Central to managing the digital assets on its platform is ENJ, Enjin’s cryptocurrency, and each in-game item created on Enjin is assigned a value in ENJ.
@threads #love #ınstagood #art #elliottwave #crypto #bitcoin #cryptocurrency #blockchain #ethereum #btc #forex #trading #money #cryptonews #cryptotrading #bitcoinmining #cryptocurrencies #investing #eth #investment #bitcoinnews #bitcoins #nft #business #invest

XRP USD - 15MHello Friends :)
Like and comment if you find value in our analysis.
Feel free to post your ideas and questions at the comments section.
Good luck

Classic Break For ALGOIs ALGO finally looking to break to the upside for the first time in 2024? its looking promising! A critical level for ALGO is around $.30 and I think we might be making a slow journey in that direction.
Trading the breakout pull back continuation pattern to confirm direction and volume.

Head and Shoulders Sending BTC to 35KPost-ETF hype, I can see a head and shoulders pattern forming on BTC. Targeting support levels in the mid-30K range. This will also get us a clean retest of the weekly LSMA (see my other idea on the weekly time frame).
Long term I am extremely bullish on BTC and can see us reaching new ATH before the end of 2024. Will be buying if we correct into 30K range.

🚀 Potential Bullish Move Ahead: AI/USDT Following XAI Coin? 📈
Get ready for an exciting ride! 🎢 AI/USDT appears to be on the verge of a significant upswing, following the footsteps of XAI coin. 📈🔥
The charts of XAI/USDT and AI/USDT share a striking resemblance, indicating a potential bullish trend of 50-100% in the coming days. 📊📈 Brace yourself for a massive surge! 💥🚀
Note: Remember, decisions regarding investments should always be made after thorough research and consultation with financial experts. This is merely an observation and not a recommendation. 📝💼
Stay tuned and keep a close eye on AI/USDT as exciting times may be just around the corner! 🔍🚀

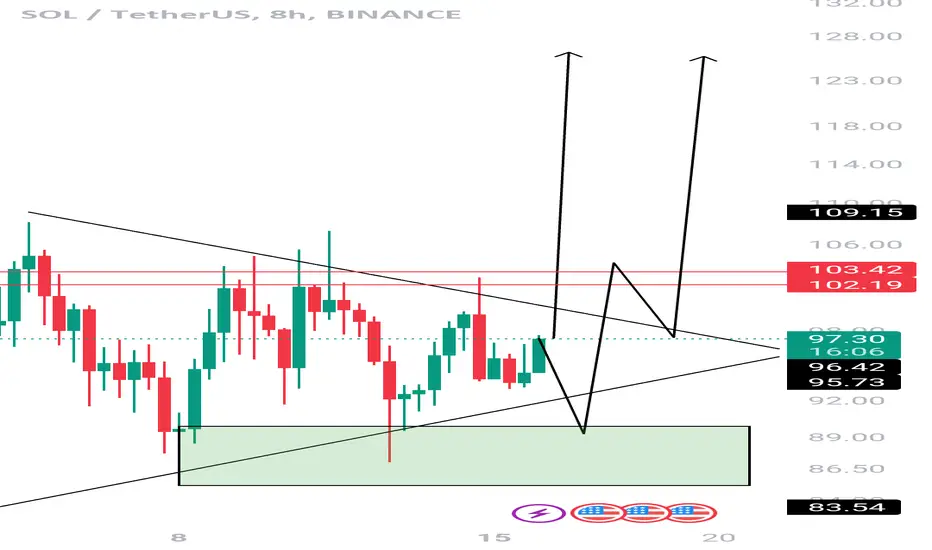
Sol/USDT: Preparing for a Bullish Move
The Sol/USDT pair is currently exhibiting signs of price accumulation within a defined zone. Based on my analysis, there are indications of a significant upward movement in the near future. Specifically, the 8-hour time frame appears strongly bullish, suggesting a potential rise of 25-40% for Solana's price in the coming days.
Please note that the information provided here should not be considered financial advice. Remember to conduct your own research and consult with a professional financial advisor before making any investment decisions.
BTC: Buy the Rumor, Sell the NewsCME: Micro BTC Futures ( CME:MBT1! ), Micro ETH Futures ( CME:MET1! )
Last Wednesday, the U.S. Security Exchange Commission (SEC) approved the listing of bitcoin exchange traded funds (ETFs) for the first time. This is a huge victory for the world's largest cryptocurrency and a game-changer for the broader crypto industry.
Immediately after the landslide decision, spot bitcoin price briefly exceeded $49,000, its highest level since April 2022. However, a huge selloff followed. On January 14th, bitcoin is quoted $42,900, which is $6,000 or 12% lower than the peak from just four days ago.
Cathie Wood, whose ARK 21Shares Bitcoin ETF is among the 11 approved ETFs, predicted that Bitcoin prices would reach $600K by 2030. Why do we see it tumble?
Since its inception in January 2009, “Buying the Rumor and Selling the News” has been a recurring theme in bitcoin price trends. We are experiencing one of them now.
• In December 2017, CME Group and CBOE launched Bitcoin futures trading. Spot bitcoin was trading in the $5000 range but shot up to $20,000 leading to the launch. A selloff immediately followed, and bitcoin was back to $9,000 by January 2018.
• In October 2021, the SEC approved the first Bitcoin-futures-linked ETF trading on the NYSE. Market talks on the decision pushed bitcoin to its all-time-high above $65,000. It fell shortly after and was trading back in the $42,000 range by December 2021.
• In 2023, spot bitcoin rose from $16,538 to $42,265, up 156% for the year. Market anticipation of the SEC decision pushed bitcoin 16% higher in the first nine trading days in 2024. The approval, once confirmed, becomes a good time to book profits.
Key Drivers for Bitcoin’s Long-term Rise
For bitcoin, secular long-term bull market and short-term volatility could occur side-by-side. The case for rising bitcoin prices is supported by solid fundamental drivers:
Firstly, there is a limited supply of bitcoins with a total cap of 21 million.
Currently, around 19 million bitcoins have been mined and are in circulation, leaving approximately 2 million left to be mined. This makes bitcoin superior to fiat currencies, whose supply could be increased by central banks, with or without limits.
Secondly, the demand for crypto investment could increase substantially.
With bitcoin now a SEC-regulated investment asset, the biggest hurdle for participation has been removed. Investors may now buy spot bitcoin, bitcoin futures, bitcoin options, and bitcoin ETFs from their brokerage accounts and trade on regulated US Exchanges.
On the first day of trading, 11 ETFs had transactions totaling $4.6 billion. A modest start, but once investors begin to allocate a portion of their asset to cryptos, trading could grow exponentially over time. According to iShares, Equity ETFs had a market size of $5.6 trillion, which is about 12.7% of US equity market in Q3 2023. Recently, PwC estimated that Global Assets under Management sets to rise to $145.4 trillion by 2025. How big the crypto market could become if just 1% of global investment is allocated to Bitcoin?
Relative outperformance of both Bitcoin and Ethereum could speed up the asset rotation. Robinhood Financial just announced that it has made all 11 bitcoin ETFs available in its trading platform, enabling millions of individual investors to buy these funds.
Brief Review: My previous trade ideas on Bitcoin
Last year, I have written three trade ideas on TradingView:
On March 29, 2023, I published this: “Crypto Staged a Strong Comeback in Q1.” At the time, bitcoin was quoted $28,348, up $11,800 or +71.3% year-to-date. The main driver was flight-to-safety when a series of US bank failures shocked the financial markets.
On July 17, 2023, I published a follow-up idea, “Crypto Bull Market Appears to Take Hold.” Bitcoin was closed at $30,146, up 1,798 or +6.3% since the first report.
On October 30, 2023, I published “Cryptos: Great Hedge for Stock Market Decline”, bitcoin was trading at $34,095.
Past performance is not a reliable indicator of future performance, but bitcoins, as an investment asset, has been through a spectacular year in 2023.
Trading with Micro BTC and ETH Futures
In my opinion, both Bitcoin and Ethereum are set up for a long-term marathon bull run. In the short-term, “Buy the rumor and Sell the news” creates interesting trading opportunities.
As bitcoin is tumbling down after the “News”, it presents bargain buying window for long-term investors. My trading idea is to buy spot bitcoin at low price as a long-term investment and hedge the portfolio with short futures position in the short-term.
CME Group Micro BTC futures ( LSE:MBT ) provide leverage and capital efficiency. Contract notional is 1/10 of 1 BTC. Initial margin is $1,140. March contract was last settled on $43,690. At current price there is a 3.8 times leverage built in the contract, which is the ratio of 4,369 (1/10 of 1 BTC) divided by 1,140. Hypothetically, if futures moves down 10% to 39,321, the 436.9 price fall in Micro BTC futures would be a 38.3% return, using the $1,140 margin as a cost base.
Meanwhile, the new “Rumor” is that spot Ethereum ETFs will be approved this year. I expect ETH to continue its rise, all the way until prices peaked at actual approval. My trading idea is to buy spot Ethereum as a long-term investment, and “supercharge” the return by adding long futures position as the rumor is playing out.
CME Group Micro Ether futures ( NYSE:MET ) also provide leverage and capital efficiency. Contract notional is 1/10 of 1 ETH. Initial margin is $72. March contract was last settled on $2,614. At current price there is a 3.6 times leverage built in the contract. Hypothetically, if futures price goes up 10% to 2,875.4, the 26.1 price gain would be a 36.3% return.
Happy Trading.
Disclaimers
*Trade ideas cited above are for illustration only, as an integral part of a case study to demonstrate the fundamental concepts in risk management under the market scenarios being discussed. They shall not be construed as investment recommendations or advice. Nor are they used to promote any specific products, or services.
CME Real-time Market Data help identify trading set-ups and express my market views. If you have futures in your trading portfolio, you can check out on CME Group data plans available that suit your trading needs www.tradingview.com

BTCUSDTBTCUSDT price is close to the key support zone 40836-42103. If the price cannot break through the 40836 level, there is a chance that the price will test the resistance 51085. Consider buying.
>>GooD Luck 😊
❤️ Like and subscribe to never miss a new idea!

BTC Long setup entry before huge dumpHi folks
Hère us a wonderful entry long on BTC to clear the previous high

Market Update - January 12 2024
Spot bitcoin ETFs begin trading on US exchanges: On Wednesday, the SEC approved the launch of 11 spot bitcoin ETFs, and trading launched on Thursday. The approval of US-based spot bitcoin ETFs marked a historic day for bitcoin and crypto as a whole, opening the door to an entirely new set of retail and institutional investors. As trading started Thursday morning, BTC rose to FWB:49K before paring back gains to sit below $45k by Friday morning. Over $4.6 billion traded across all spot bitcoin ETFs on Thursday, likely setting a record for the highest day-one volume for a single type of ETF.
Ether surges as focus shifts to potential ether ETF: Ether (ETH) had been struggling in comparison to BTC over the past few months as attention centered around the bitcoin ETF applications, with the ETHBTC pair hitting its lowest level since April 2021 at 0.04788. However, following Tuesday’s bitcoin ETF head fake, the pair jumped to 0.052 suggesting a rotation out of BTC and into ETH for a catch up play and an expectation that the narrative will shift toward a potential ether ETF approval later this year. This was further evident on the actual approval Wednesday, with the ETHBTC continuing to rally higher, currently trading near 0.06 as of Friday morning.
Inflation ticks up as interest rate cuts expected in 2024: US equities rose steadily this week as investors awaited inflation data released on Thursday. Thursday’s data showed a mild 0.3% increase in the consumer price index (CPI) for December, reflecting a 3.4% yearly increase. Estimates had been for a 0.2% December increase and a 3.2% annualized increase.
Altcoins perform well as total crypto market cap nears $1.8 trillion: Much of the wider crypto market saw price appreciation this week, with some leveraged ETH and BTC plays showing good returns. Ethereum Classic (ETC) is trading up more than 55% over the past seven days, while Lido DAO (LDO) added 20% over the same period. The total crypto market capitalization is now approaching the $1.8 trillion mark, its highest level since April 2022, prior to the Terra/LUNA collapse.
Circle, USDC issuer, files for initial public offering (IPO): On Thursday, Circle announced that it had filed a confidential S-1 document with the SEC, as it seeks to launch an initial public offering (IPO). While the announcement was light on details, Circle had previously announced in 2021 that it planned to go public via a SPAC, with a $9 billion valuation as of February 2022.
🎭 Topic of the Week: Why was Bitcoin created?
👉 Read more here

SOLANAfrom 22 to 120 in just 3 months
this crypto can reach upto 180 in 2 months
and 250 in 5 months
500 in a year
bullish on this forming bullish flag pattern

BTCUSD Is Pointing Higher After A CorrectionBitcoin remains at the highs at the beginning of 2024, so we assume that more upside can be seen as recovery is acting like an impulse. As such, be aware of further gains within a five-wave cycle, where we are tracking higher degree wave III up to around 48k - 50k area. Looking at the 4-hour chart, we can see some sell-off after Matrixport’s latest report claims that the SEC will reject all Bitcoin spot ETFs in January, and final approval may be achieved in the Q2. However, we are still tracking two counts at this stage due to an upcoming decision of SEC on spot Bitcoin ETF. As a primary count it can be trading in an (A)-(B)-(C)-(D)-(E) bullish running triangle pattern within higher degree wave 4 before a bullish continuation for wave 5. But, according to secondary count, keep also in mind that recent jump could be also 5th wave out of wave 4 triangle pattern, so we should be aware of a larger, deeper and longer A-B-C corrective setback down to 40k-38k-35k support area.

BITCOIN 2024 CHART PLANRemember that these are general considerations, and the cryptocurrency market is highly dynamic. It's essential to stay informed about the latest developments, conduct thorough research, and, if needed, consult with financial professionals before making investment decisions.

Ethereum May Start DominatingETH.dominance chart is waking up from projected support zone after an (A)-(B)-(C) corrective decline. Seems like ETH dominance is kicking in, as traders bet on possible Ethereum ETF next, so ETH can easily start outperforming other coins, especially if breaks above 20%.

BITCOIN (BTCUSD): Detailed Technical Outlook ₿
Price action analysis for Bitcoin.
Important historical structures.
Potential scenarios.
Trading recommendations.
❤️Please, support this video with like and comment!❤️

Coinbase"Cathie Wood’s Ark Investment Management, the second-largest holder of Coinbase Global (COIN) stock, doubled down on its investment in the crypto exchange after the U.S. Securities and Exchange Exchange sued the only publicly traded crypto exchange sending share prices tumbling.
ARK bought 419,324 shares of Coinbase, worth around $21.6 million based on Tuesday's closing price of $51.61." -Coindesk
......
Considering that this company's stock price is near it's lows, I can see why Ark Investment Management would make that move.
I believe the shift begins once there's a break of the $67 level. Afterwards, it's next potential hurdle could be the $190 - $230 price range. However, I'll be even more bullish after a break of the $320.

KDA Kadena is about to pump 2XReady for a beautiful entry LONG !!!
KDA just showed a huge sign of strenth on actual levels
You can enter in position actual price or wait at these levels :
1.18
1.12

BITCOIN ANALYZE 1D📍According to Elliott Wave Theory: It has completed a full bullish cycle and is currently undergoing a corrective phase in the form of a 3-wave abc pattern. Currently, Wave a has been established and Wave b is in formation. In my opinion, this could potentially mark the end of Wave b and the beginning of Wave c (Wave c in Elliott Wave Theory can be the sharpest wave). We might anticipate a significant downward movement for Bitcoin.
📍My initial target is $14,000.

Unleash the power of Ethereum in 2024COINBASE:ETHUSD Ethereum stands tall as a beacon of innovation, and its future in 2024 looks brighter than ever!
With a strong foundation built on the groundbreaking achievements of 2022 and the ever-growing support of the crypto community, Ethereum is poised to make a remarkable comeback in the coming year.
One of the key drivers of Ethereum's bullish thesis for 2024 is the upcoming network upgrade, EIP-4844, which promises to bring significant improvements in transaction speeds and costs. This upgrade is expected to take place during the first half of 2024, and it could be the catalyst that propels Ethereum to new heights.
Moreover, the recent shift in market sentiment towards Ethereum, as evidenced by the growing number of institutional investors and the potential for a spot Ethereum ETF, further strengthens its bullish case. As more investors recognize the unique utility of the Ethereum blockchain for dApp developers, NFTs, and DeFi applications, the demand for ETH is likely to surge.
In addition, the deflationary nature of Ethereum, which was first observed in 2023, is expected to continue in 2024. This deflationary pressure, coupled with the growing adoption of DeFi and NFTs on the Ethereum network, will likely result in increased utility and demand for ETH.
Furthermore, the technical analysis of Ethereum's price action in 2024 reveals a bullish pattern, with the formation of an ascending triangle and a triple top. These patterns suggest that a breakout to the upside is imminent, and the price of ETH could reach new all-time highs in the coming year.
#ETH #BTC

BTCUSD (D) Buy nowBINANCE:BTCUSD BTCUSD (D) appears to have a pattern of narrowing the price range.
Currently, the pattern has been broken. So:
Buy current price at 45450
Stop loss at 41345

BTC etf The picture is pretty clear imo. The ETF is near and the market is giving this clear picture. lets see what happens. IT's GG.

Bitcoin Flat( is the ETF gonna be positive or ?)Bitcoin ETF is either gonna bring Positive news to the space or it is gonna bring negative news.
So, if Negative, from the current price we might see a drop as detailed on the Chart, else if the news are positive, as already detailed on the chart, a move from 39k is needed for a Bullish run continuation.

CAKE party !Entry point and stop loss is based on your personal plan and this is my long term analysis on weekly time frame.
I think the chart says it all.
We will celebrate the cake party soon...
Good luck, dear trader.
Mohammad Goodarzi
Wednesday
3 Jan 2024
